Jake Arrieta of the Chicago Cubs went through some rough patches in 2016. A loss of command to batters in the middle of pitching sequences led to a noticeable uptick in walks. This issue compounded itself and lead to a potential shift in confidence that correlated with overcompensation. Let’s dive into the numbers over his career to see if 2016 was a return to prior form, leaving 2014 and 2015 as the best we will ever see of Jake Arrieta.
This is a guest post from friend of the blog Ricky Mears, who writes over at Innings Pitched. Their website will be launching in January 2017. Follow @InningsPitched on Twitter to stay up to date before the launch and sign up for the Newsletter. Tickets to a MLB or MiILB will be given away to a follower once they reach the 200 threshold.
By The Numbers
Jake Arrieta was lauded as having pinpoint control in 2014 and 2015. His 2.08 walks per nine innings placed him as number 24 out of 84 qualifying starting pitchers over the two year stretch. In 2014, Arrieta had 8.2% walk rate against lefties and a 5.4% walk rate against righties. Similarly, in 2015 he had a 6.6% walk rate against lefties versus a 4.6% versus righties.
The trouble came in 2016 when the walk rate against lefties skyrocketed to 13.6% and walk rates against righties increased to 5.9%. The graph below depicts walks per nine (BB/9) over the course of his career, which follows an identical pattern as the walk rate percentage described above.
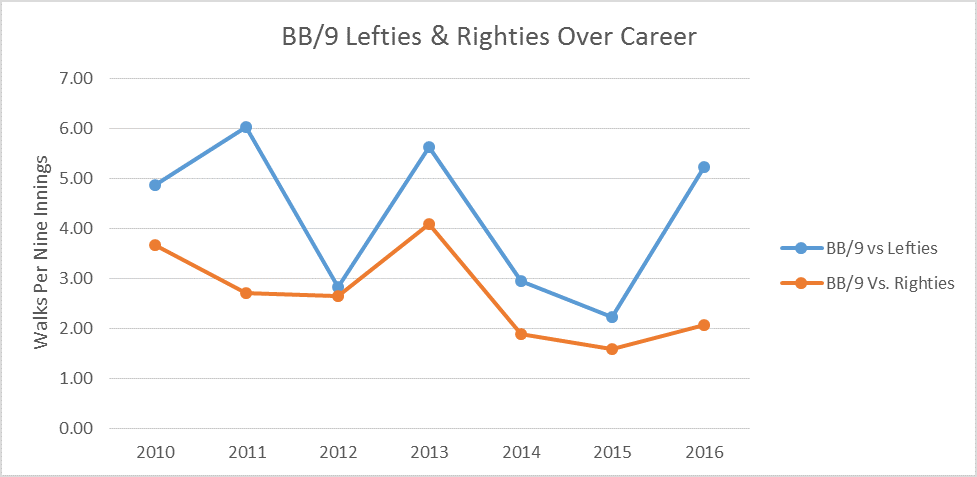
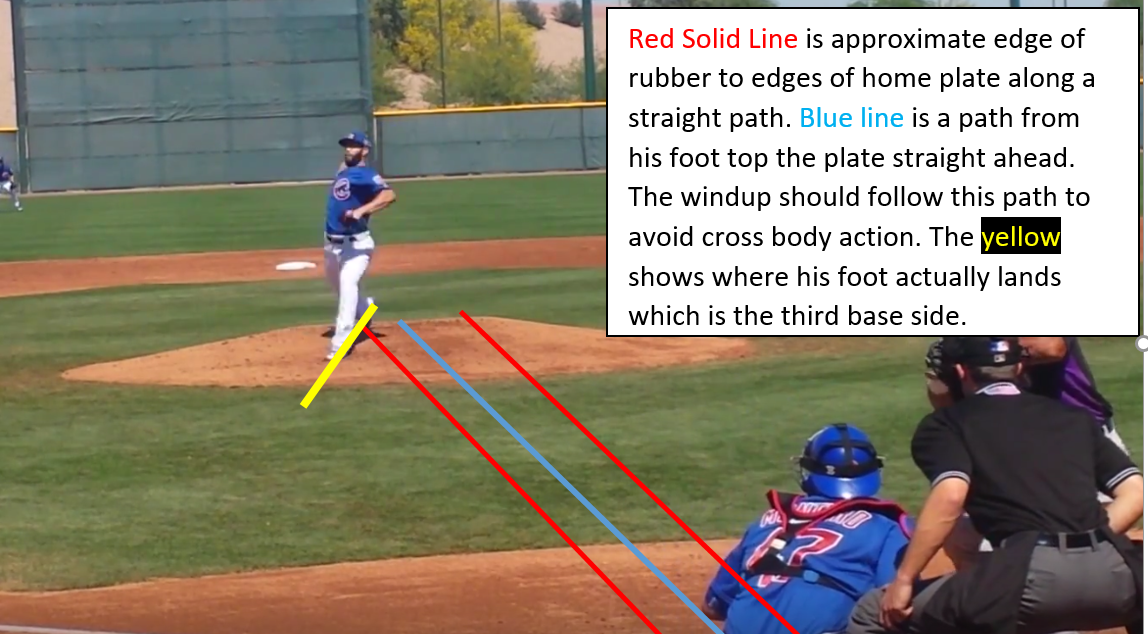
Jake Arrieta was with the Baltimore Orioles from 2010 through the 2013 season and his first season with the Chicago Cubs was 2014. His career average walk rate versus lefties is 4.25 per nine innings versus 2.66 versus righties. Compare this to his 2016 campaign: 5.17 BB/9 versus lefties and 3.25 versus righties. So, Jake Arrieta, did not necessarily fall off a table in 2016, he just regressed to his pre-Chicago Cub ways (at least in terms of control). Lefties are clearly giving Arrieta fits, so let’s dive in and see the numbers and pitching mechanics that could be causing the issue.
Examining Pitch Velocity and Spin Rates
Jake Arrieta’s primary off-speed pitch in 2014 and 2015 was his slider (SL in graph below). He also mixed in a curveball and the occasional changeup to keep the hitter honest.
Innings Pitched will focus mainly on the slider and his fastball. These two offerings appeared to be Jake Arrieta’s achille’s heel in 2016. His fastball sat at an average 93.6 mph in 2016, compared to 94.4 mph in 2015 (0.8 net decrease). Similarly, his slider sat at 89.2 mph in 2016, compared to 90.3 mph in 2015 (1.1 mph net decrease).
The decreased fastball and slider velocity is troubling, as this gives the hitter more time to react. Additionally, a decrease in slider velocity also tends to correlate with a decrease in spin rate. The spin rate of the ball has an effect on the horizontal movement of the ball and can lead to decreased exit velocities off the bat (confirmed in small sample sizes). Generally speaking, Revolutions Per Minute (RPM) above 2000 for a slider is considered slightly above league average with 2500 as near elite.
Do not take my word for this, let us consult Baseball Savant, the statistics database us stat nerds all love.
To continue reading the article on Jake Arrieta’s 2016 pitching mechanics, please click on over to offthebenchbaseball.com
Add The Sports Daily to your Google News Feed!