All baseball players – whether they’re amateurs or professionals – are creatures of habit. When you have a game to play every day, routines form (some on purpose, some by accident) and once a player notices those routines, they typically like to keep them as they are.
Advanced statistics have helped organizations and coaching staffs justify tinkering lineups on a daily basis, but one thing is for certain – most hitters like coming to the ballpark knowing exactly where their name will be penciled into the order.
It makes mentally preparing a lot easier, and they don’t have to wonder when they’ll get their first plate appearance of the night.
With that in mind, I was curious as to which hitters performed the best in 2016 at each particular lineup spot. The only criteria was sample size – 1-5 hitters needed at least 400 plate appearances to qualify, but it dropped to 250-plus for the six-hole and 200-plus for the bottom-third to generate players to choose from.
Here are your most dominant hitters at each lineup spot from 2016, ranked by wRC+.
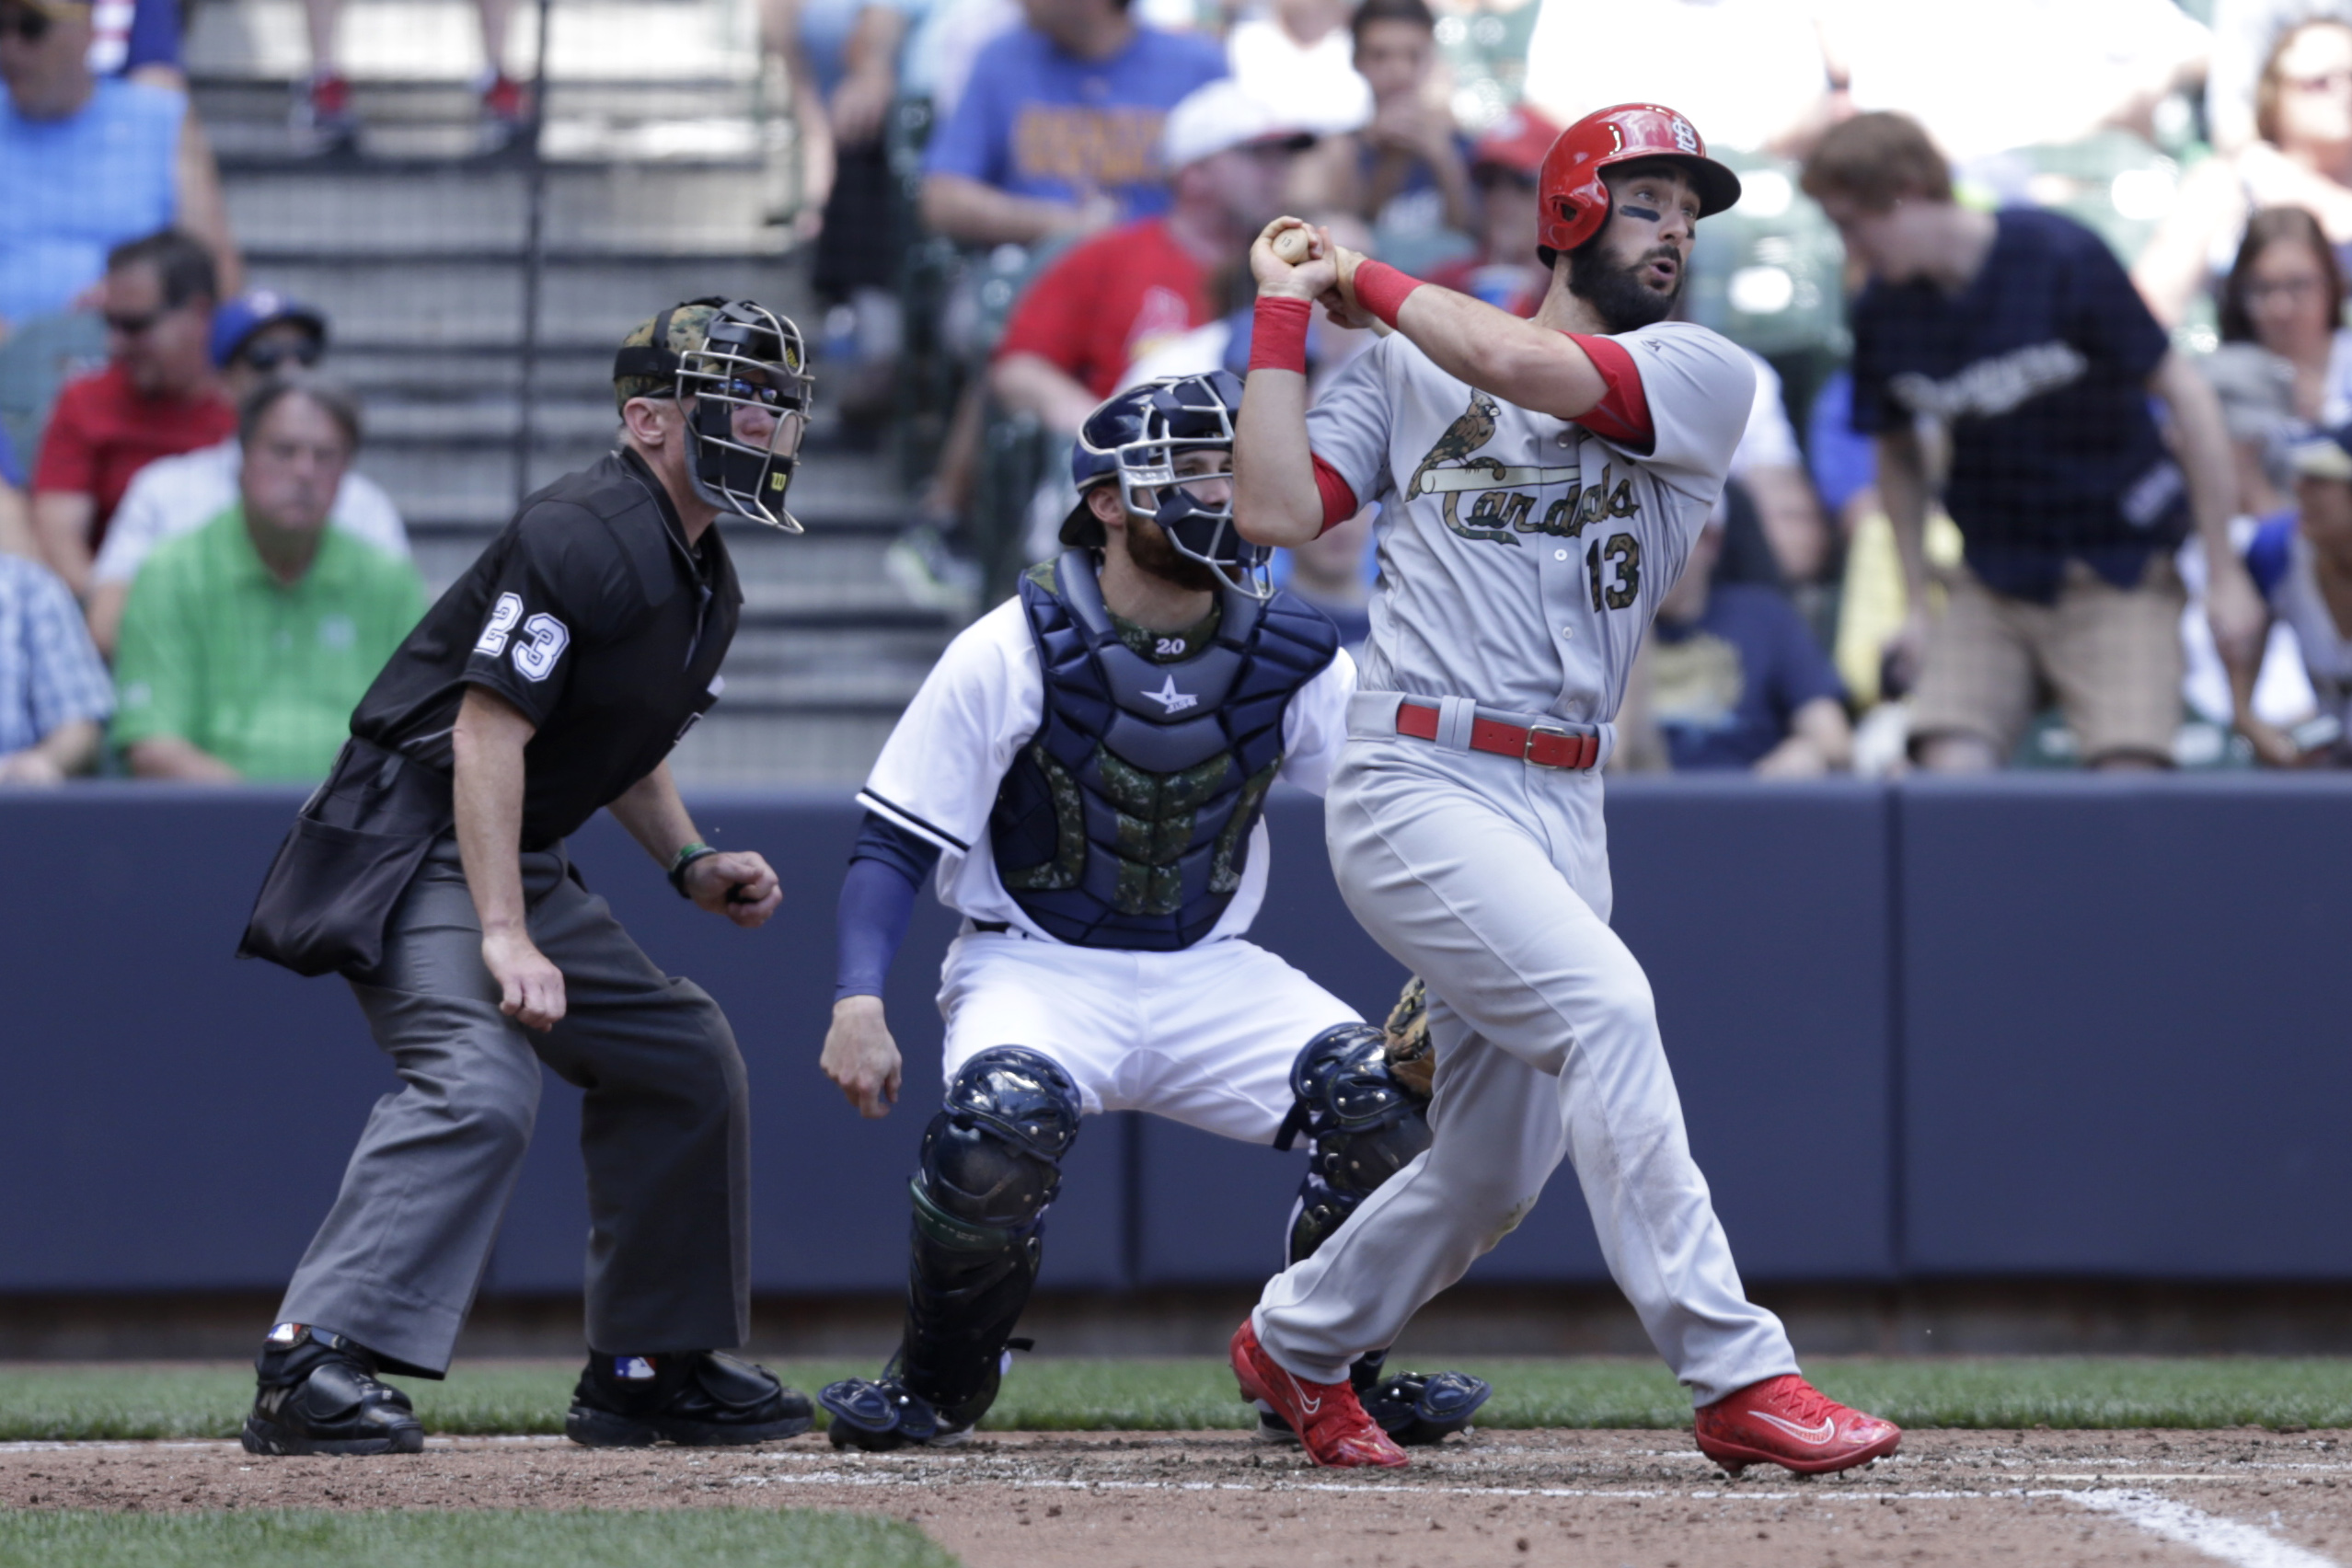
1. Matt Carpenter, St. Louis Cardinals
| PAs | Avg. | OBP | Slug% | ISO | Hard% | wRC+ |
|---|---|---|---|---|---|---|
| 511 | .276 | .386 | .527 | .251 | 43.5% | 142 |
(The numbers in each table display how a hitter performed in that particular lineup spot, but most of the statistics I’ll reference will talk about their overall performance.)
There were a couple things that stood out here about Matt Carpenter‘s overall 2016 performance: his hard-hit rate and O-Swing%.
After staying consistently between 33.1% and 34.2% over his first three years, Carpenter’s hard-hit rate jumped to 37% in ’15 before spiking even more to a career-high 41.9%. With a career OBP of .376, he also knows a thing or two about getting on base, and he did so last year despite a career-worst O-Swing%… of 22.6% (league average is about 30%).
2. Josh Donaldson, Toronto Blue Jays
| PAs | Avg. | OBP | Slug% | ISO | Hard% | wRC+ |
|---|---|---|---|---|---|---|
| 627 | .277 | .397 | .534 | .257 | 39.9% | 149 |
Josh Donaldson’s cumulative 40.4% hard-hit rate is also a career high, but he basically produced at the same clip in 2016 as he did in 2015. That’s pretty good considering he won the AL MVP in ’15 with an 8.7-fWAR performance.
He’s hit 78 home runs since joining the Blue Jays, yet has kept his combined strikeout rate under 18% over the past two years – an incredible accomplishment for a power hitter in today’s game.
3. Mike Trout, Los Angeles Angels
| PAs | Avg. | OBP | Slug% | ISO | Hard% | wRC+ |
|---|---|---|---|---|---|---|
| 533 | .304 | .424 | .535 | .230 | 41.2% | 162 |
Ho-hum, another “most dominant hitter” list and another appearance from Mike Trout. It’s like this guy is better than everyone else, or something.
As if he couldn’t get much better throughout his young career, I took note of five different advanced statistics from 2016 that show he’s actually improving.
4. David Ortiz, Boston Red Sox
| PAs | Avg. | OBP | Slug% | ISO | Hard% | wRC+ |
|---|---|---|---|---|---|---|
| 418 | .312 | .404 | .635 | .323 | 44.9% | 166 |
A week after his dominance in two different innings was displayed, David Ortiz gets another very prestigious honor. Retired life is treating him pretty well so far.
Ortiz’s .305 ISO in 2016 is the second-highest mark of his 20-year MLB career, but it was also the first time he reached that level since posting a .349 ISO in 2006 (which was his career high). In fact, that was part of a four-season stretch where he didn’t post an ISO below .300 (2003-06).
5. Mark Trumbo, Baltimore Orioles
| PAs | Avg. | OBP | Slug% | ISO | Hard% | wRC+ |
|---|---|---|---|---|---|---|
| 407 | .278 | .329 | .587 | .310 | 39.4% | 141 |
I hope Mark Trumbo points to this article in his ongoing negotiations with the Orioles. It can only help.
The slugger enjoyed a banner year in many respects, but this sums it up for me the best: he accumulated 907 plate appearances between the 2014-15 seasons and produced 36 homers and 125 RBI. In 667 plate appearances last season, he clobbered an MLB-leading 47 homers with a career-high 108 RBI.
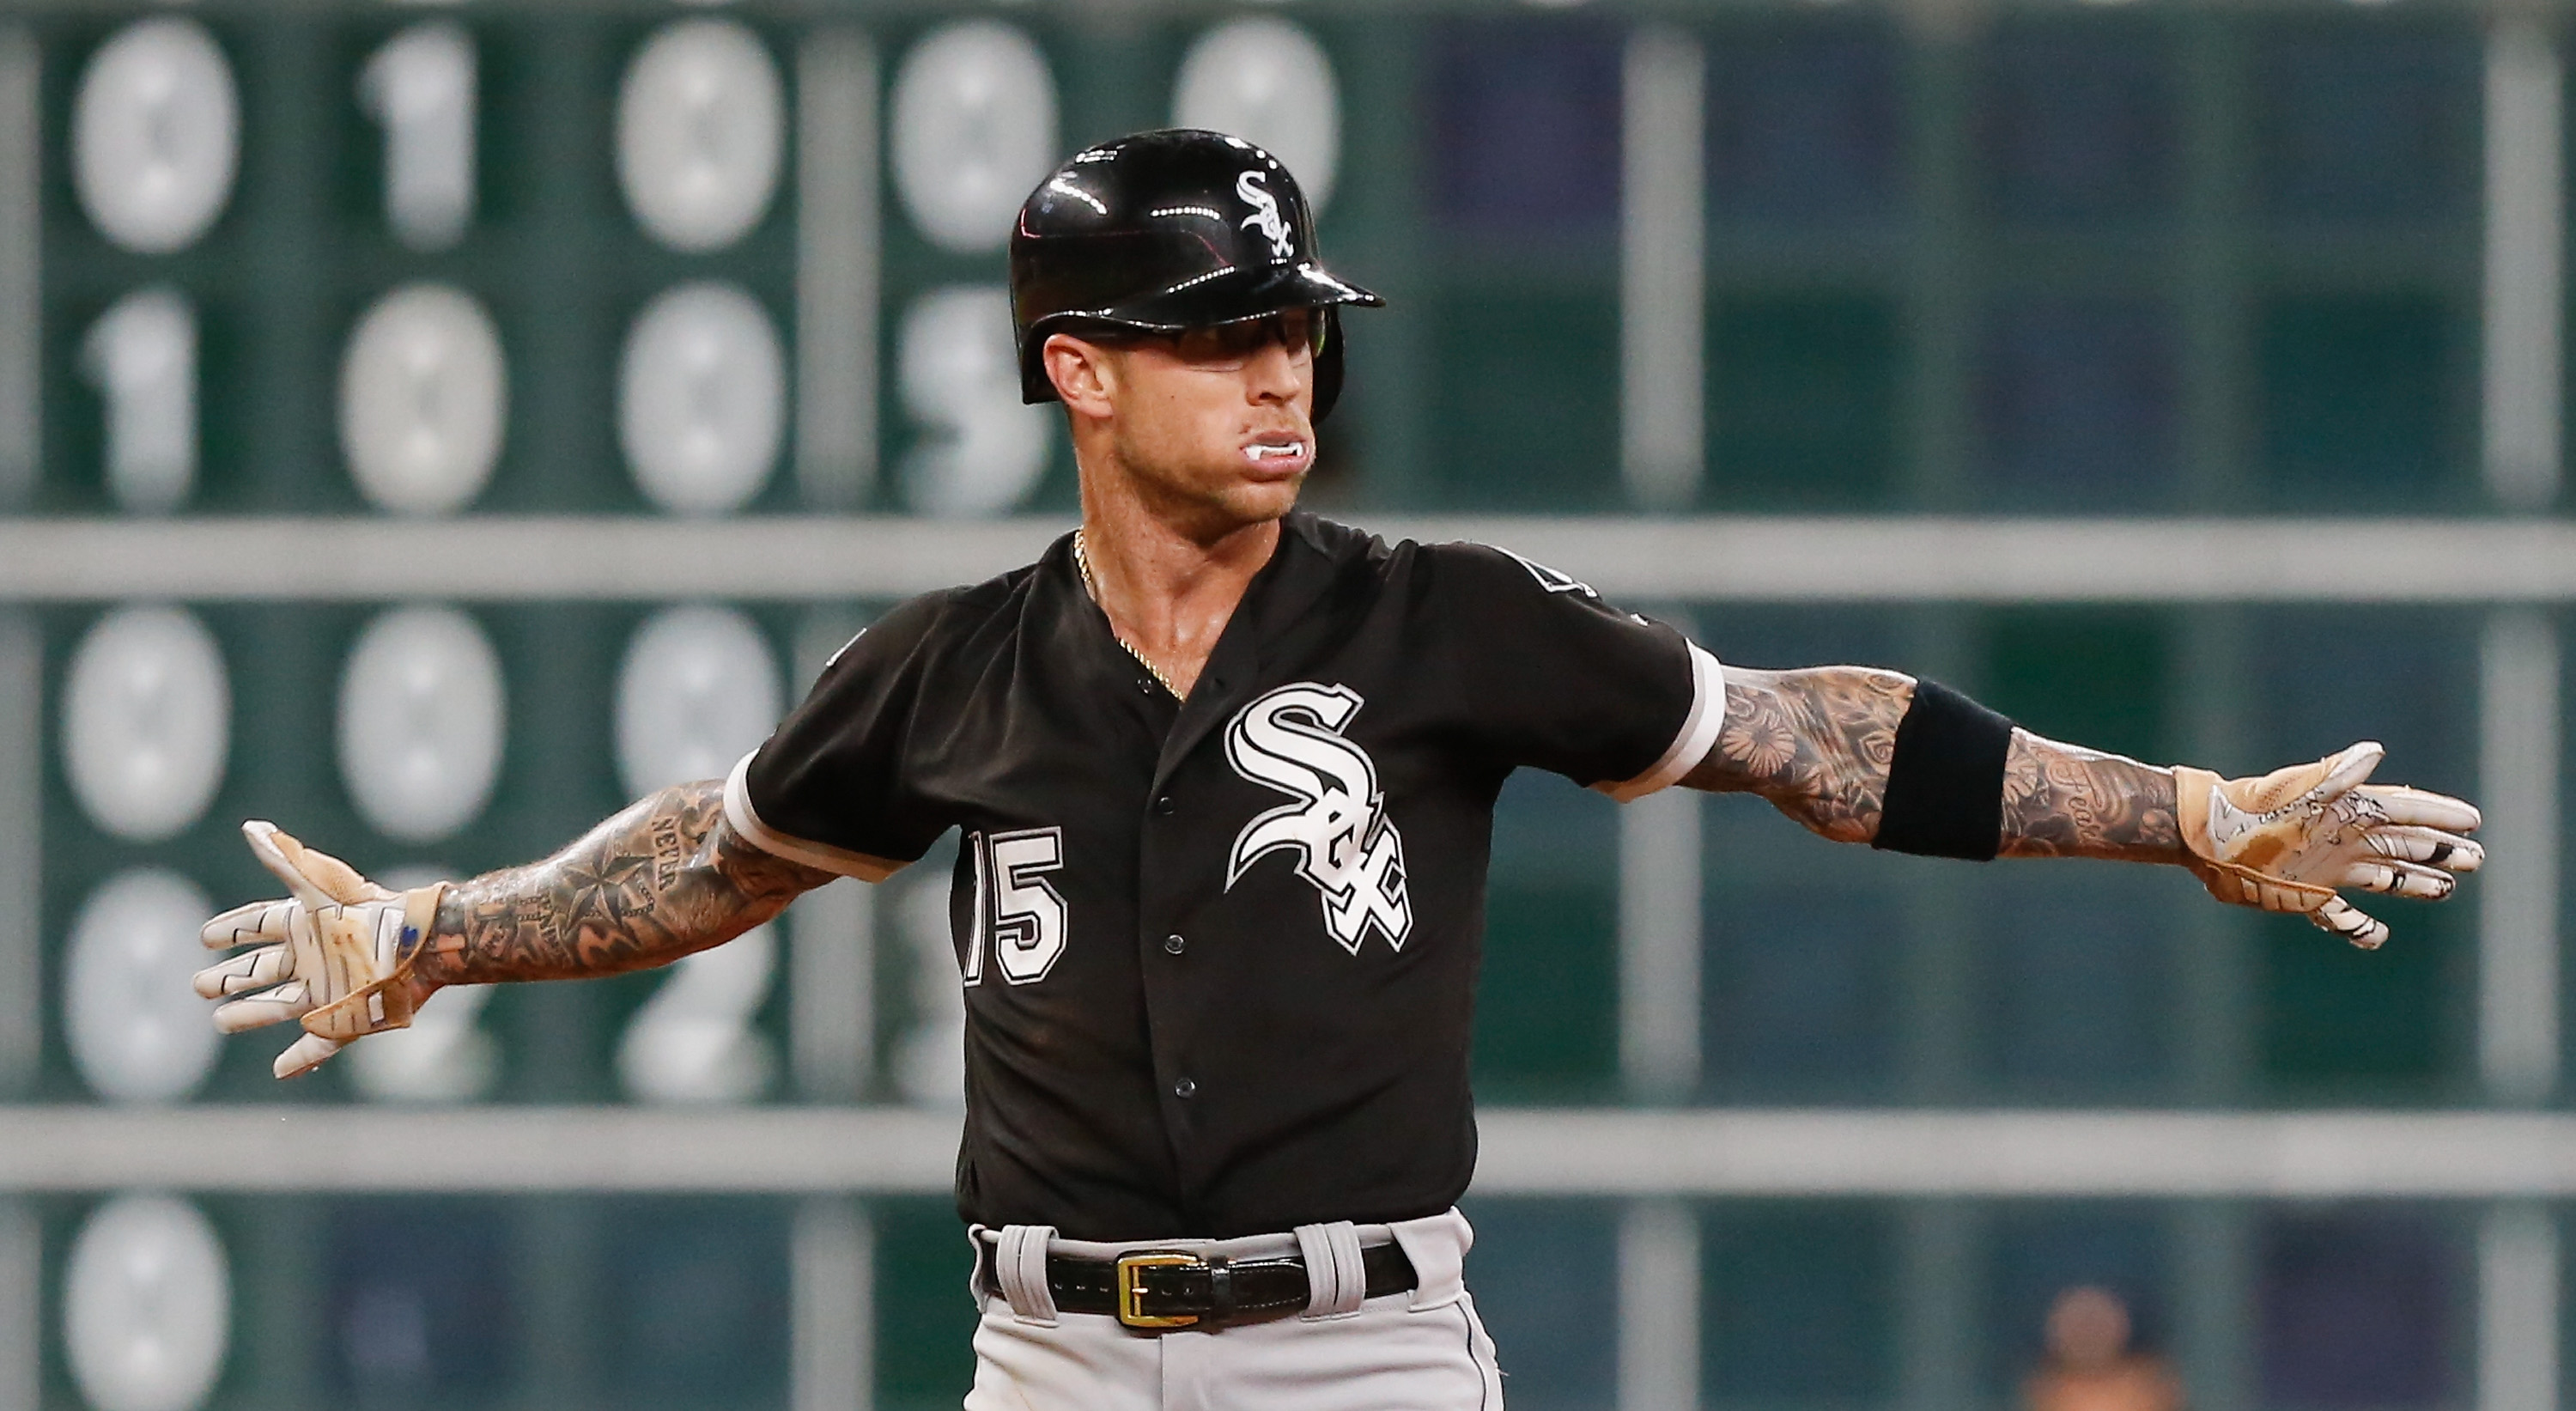
6. Brett Lawrie, Chicago White Sox
| PAs | Avg. | OBP | Slug% | ISO | Hard% | wRC+ |
|---|---|---|---|---|---|---|
| 284 | .275 | .345 | .459 | .184 | 32.4% | 115 |
As the sample size shrinks, so do the most impressive performances.
Brett Lawrie was limited to 364 plate appearances last year, but nearly doubled his walk rate from 4.7% with the Oakland Athletics in 2015 to 7.8% with Chicago. However, his strikeout rate also rose steadily, from 23.9% to 28.4%.
Since becoming an everyday player in 2012, Lawrie’s swing rate stayed between 46-48%, but his contact rate has decreased each year, from 83.6% in ’12 to 72.1% in ’16.
He’s had some injury-shortened seasons, but that can only say so much.
7. Avisail Garcia, Chicago White Sox
| PAs | Avg. | OBP | Slug% | ISO | Hard% | wRC+ |
|---|---|---|---|---|---|---|
| 236 | .286 | .347 | .484 | .197 | 38.0% | 123 |
The bottom half of this list is “ruled” by AL Central teams, but quotation marks are used since this sampling is basically a microcosm of each team’s season in ’16.
Avisail Garcia’s greatest attribute is his perceived ability in the batter’s box (and -23 Defensive Runs Saved and a -17.3 UZR for his career say plenty about his glove), so it’s unfortunate that he’s produced a sub-90 wRC+ to go along with a swinging strike rate north of 17% in each of the last two years.
8. Kurt Suzuki, Minnesota Twins
| PAs | Avg. | OBP | Slug% | ISO | Hard% | wRC+ |
|---|---|---|---|---|---|---|
| 275 | .290 | .336 | .452 | .163 | 29.7% | 110 |
By Kurt Suzuki’s standards, he had a pretty darn good 2016 at the plate. He doesn’t strikeout much (12.9% in ’16), but when a .704 OPS is your second-highest mark since 2010, it’s probably not the best thing.
However, his .145 ISO is the third-best of his career, and it’s the first time it’s been over .105 since 2011 with the Athletics. He actually nearly doubled his power output from the year before (.074 in ’15).
9. Byron Buxton, Minnesota Twins
| PAs | Avg. | OBP | Slug% | ISO | Hard% | wRC+ |
|---|---|---|---|---|---|---|
| 293 | .228 | .287 | .407 | .179 | 24.0% | 82 |
The Twins dominated the bottom of the batting order last season! It’s not much, but when a team piles up 103 losses, it’s the small things that matter. While Byron Buxton’s big-league struggles continued, he definitely wouldn’t be here if it wasn’t for a huge (and encouraging) September.
He entered the final full month of the regular season with a .193/.247/.315 line, one home run, 16 RBI, 13 walks and 80 strikeouts in 218 plate appearances. He then proceeded to hit .287/.357/.653 with 9 homers and 22 RBI over his final 113 plate appearances, giving Twins fans hope that he’s close to figuring things out.
Using wRC+ is a good way of figuring out which players were best on offense at each spot in the lineup last year, but does it change if we use different parameters? I chose two more kinds of stats to see if that was the case.
Best Hitters at Each Lineup Spot Using OPS
- Charlie Blackmon, Colorado Rockies: .935
- DJ LeMahieu, Colorado Rockies: .952
- Joey Votto, Cinncinati Reds: .992
- David Ortiz, Boston Red Sox: 1.039
- Mark Trumbo, Baltimore Orioles: .917
- Brett Lawrie, Chicago White Sox: .804
- Avisail Garcia, Chicago White Sox: .834
- Kurt Suzuki, Minnesota Twins: .788
- Byron Buxton, Minnesota Twins: .694
All of the changes in this instance happen at the very top of the order, with the same cast of characters manning the 4-9 spots. Blackmon and LeMahieu both enjoyed career seasons, so it’s not overly surprising to see them here.
As for Votto, he’s just a machine and can thank another huge second half in order to make this possible (.252/.386/.446 before the All-Star break, .408/.490/.668 after the All-Star break).
Best Hitters at Each Lineup Spot Using ISO
- Matt Carpenter, St. Louis Cardinals: .251
- Josh Donaldson, Toronto Blue Jays: .257
- Edwin Encarnacion, Toronto Blue Jays: .279
- David Ortiz, Boston Red Sox: .323
- Mark Trumbo, Baltimore Orioles: .310
- Justin Upton, Detroit Tigers: .250
- Avisail Garcia, Chicago White Sox: .197
- Danny Espinosa, Washington Nationals: .194
- Byron Buxton, Minnesota Twins: .179
There are still only three newcomers to this list when using ISO as the benchmark, but they’re spread throughout the lineup instead of being bunched at the top.
And don’t worry, Indians fans – Edwing produced a very similar triple slash as a cleanup hitter last year (.271/.352/.514 in 248 plate appearances) as he did in the three-hole (.258/.359/.538 in 454 plate appearances).
Conclusion
Exercises such as this one aren’t necessarily done to see guys like Donaldson, Trout and Ortiz. Sure, it’s fun to see exactly how dominant they are from a slightly different perspective, but what makes stuff like this super interesting are the appearances from players like Buxton, Lawrie, Garcia and Suzuki.
Even at the top of the order, wouldn’t have you expected Mookie Betts or Dexter Fowler to be there? I did, but that’s how baseball works sometimes. Spring Training is fast approaching, which means the quest toward dominating each lineup spot in 2017 will be here before you know it.
Statistics courtesy of Baseball-Reference. Advanced statistics courtesy of FanGraphs, unless otherwise noted.
Thanks for reading! If you’d like to jumpstart your sportswriting career and aren’t sure how, check out my eBook. Don’t forget to follow me on Twitter so we can chat about baseball: @mmusico8.
Add The Sports Daily to your Google News Feed!