Before suffering their first three-game losing streak of the season last week, the Penguins had been one of the most dominant teams in the NHL in 2016-17. Even with road losses at Washington, Ottawa and Detroit, Pittsburgh still remains well in the hunt for a playoff berth for what could be a franchise record-tying eleventh-straight season. The 4-1 loss at Ottawa came in their forty-first game, representing the exact half-way point of the regular season.
 The Penguins and several of their 1967 expansion cousins are celebrating 50 year anniversaries this season and Pittsburgh’s 26-10-5 record after 41 games is one of their best first-half starts in the half-century history of the club. In fact, the Penguins 57 points tied the 1995-96 club for third-most first-half points in a non-lockout schedule. So is this the third-best first half in team history?
Well…
As written before, comparing teams across different eras presents some challenges due to changes in the way teams earned points at different stages in NHL history. In the same way that Columbus’ recent 16-game winning streak needs to be considered differently than Pittsburgh’s official NHL record 17-game winning streak due to the current post-overtime shootout format that was unavailable to the 1993 Penguins, one needs to adjust win-loss-tie-overtime-shootout team records to make fair comparisons.
In recent years, it’s always bothered me a bit when at the conclusion of the regular season, fans, media and even the club itself, celebrate the achievement of a 101, 106 or 108 point season … supposedly making it one of the “top-five” years in franchise history based on raw points. One wonders how many more points the 1990s Penguins would have earned if Lemieux, Jagr, Kovalev, Straka & Co., had lined up for shootouts several times per season.
 While we will never know the answer to that fairly alluring question, we can however adjust in the reverse direction. That is, by normalizing all team records to control for the presence or absence of shootouts or consolation points for losing in overtime, we can come up with a level playing field of year-by-year, apples-to-apples Penguins first-half records and see where the 2016-17 club fits in the annals of black and gold hockey.
First, a word about those two annoying lockout-shortened 48-game schedules. Different people will treat them different ways, but the first 41 games of both the 1995 and 2013 seasons are presented here, even though that is clearly not the first “half”. The tables simply show the performance of all 49 Penguins clubs after 41 games, the first half of a modern season, based on the 82-game regular season schedule that has been in place for the past two decades.
The data is tabulated from most adjusted points to fewest adjusted points. Wins, worth two points, are credited only for winning in regulation or overtime. Losses, whether in regulation or overtime, are worth zero points. Any games that are tied after 65 minutes of play are worth one point; in other words, all shootout games – win or lose – are considered ties. This is exactly how standings points were calculated from the Penguins inception in 1967-68 until the 1998-99 season, and thus enables us to fairly compare that block of years with the very different “points for overtime and shootout losses” era we presently dwell in. “PTS – ADJ PTS” shows the number of points a team dropped when credit for shootout wins and overtime losses are eliminated.
[office src=”https://onedrive.live.com/embed?cid=2A728A26A493C6FE&resid=2A728A26A493C6FE%21144&authkey=AGRQ6q7rsx4qL98&em=2&ActiveCell=’Sheet1′!J2&wdHideHeaders=True&wdDownloadButton=True” width=”465″ height=”900″]From the data, the 2016-17 Penguins are tied with the 1988-89 and 2014-2015 squads with 51 adjusted points. To rank these three teams separately, let’s use regulation+overtime wins as the tiebreaker. This places the current group of Penguins fifth-best in franchise history in terms of performance after 41 games, in non-lockout seasons. Not a bad position.
What other seasons were remarkable?
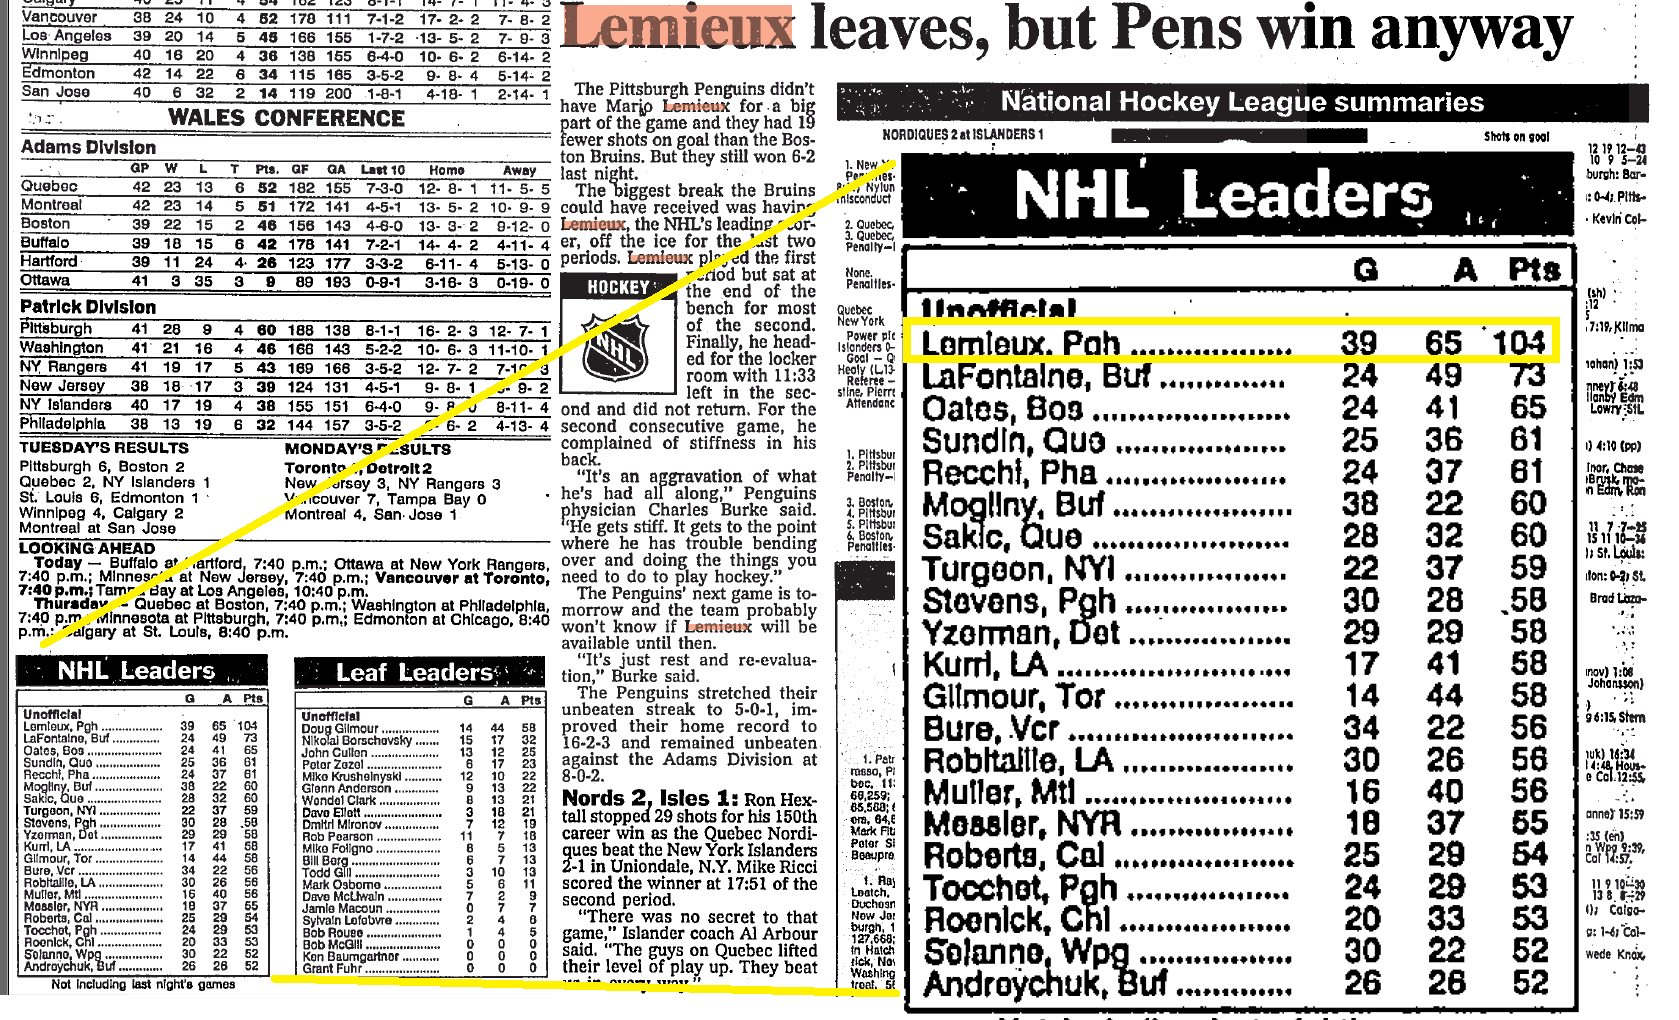
1992-93: First, the indisputably greatest season of all-time in club history began with the greatest first half in club history. With the NHL record 17-game winning streak still to come, Pittsburgh already had amassed 60 points from an astounding .732 winning percentage. We all know the cursory details: the two-time defending champs exploded out of the gate, undefeated in their first ten games (8-0-2). Lemieux exploded out of the gate too, scoring at least one goal in the first 12 games of the season. For a fun comparison, (yes, we know, different levels of scoring in different eras), Evgeni Malkin led the team in first half scoring with 45 points in 41 games; Mario was at 45 points after 16 games. Sidney Crosby scored 26 goals in 31 games; Mario hit 26 in 24 games. When Lemieux exited team game #41 early in what would be his last action until coming back from cancer treatment in March, he had 104 points already, 31 more than the next closest player!
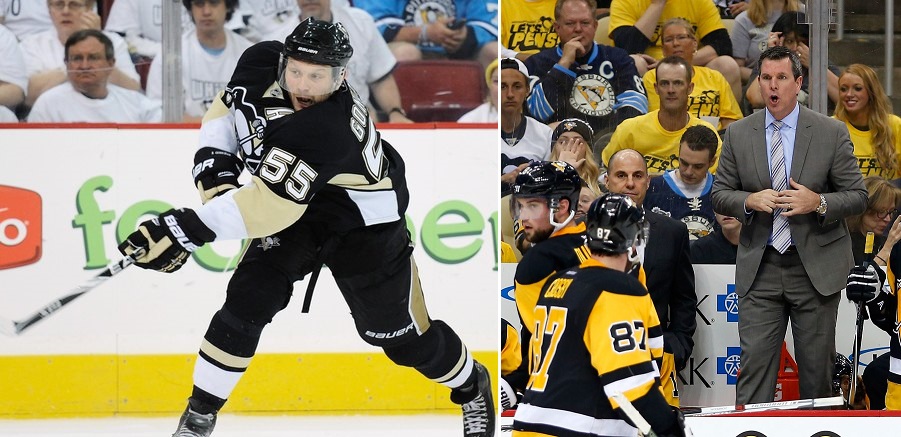
 1995 and 2013: The 48-game lockout-shortened seasons suggest the Penguins went full throttle after waiting through the entire autumn and early winter to play hockey. Those two 41-game starts represent the second- and fourth-highest adjusted point totals respectively, in club history. The 62 points in 2013 are actually the Penguins’ highest raw point total after 41 games, buttressed by the 15-game winning streak in March. In 1995, a 23-year old Jaromir Jagr scored 32 goals and 70 points to earn his first of five Art Ross Trophies, leading the Penguins to a 12-0-1 start.
2013-14 and 2014-15: These two seasons show how easily a good first half can be forgotten. Dan Bylsma’s final season behind the Penguins bench began with a first half that ranks third-highest in adjusted points in team history. Yet his legacy sadly will be the underachievement of his post-Cup win teams, especially the blown 3-1 second round playoff series lead against the Rangers later that spring. Similarly, Mike Johnston’s one and only full season as head coach in Pittsburgh began with the same number of adjusted points as this season’s club. We have the benefit of hindsight to say, “It’s not surprising the 2014-15 team under Johnston’s system had to battle to even finish eighth in the conference,” but the take-home message here is that the current group of Penguins – and their backers – shouldn’t think the playoffs are a given simply based on a strong first-half.
 2007-08, 2008-09 and 2015-16: Three teams that eventually won the Eastern Conference looked decidedly regular half way through the regular season schedule. In fact, the 2009 club was below the median 41-game performance. A coaching change had already occurred at this point one year ago. Meanwhile, the 2008 club’s first half performance was inflated by a franchise record six shootout wins. The rest is history. In 2008, Malkin carried the Penguins through Crosby’s absence due to a high ankle sprain while in 2009, Sergei Gonchar returned in February from injury while Bylsma replaced Michel Therrien. Last season, Mike Sullivan took over and preached discipline – “Just play” -, while getting the Penguins to skate their opponents into submission.
We’ll examine adjusted second half and adjusted overall regular season performance in April.
Add The Sports Daily to your Google News Feed!