
In any given 3 game stretch, it is pretty standard to not draw too many conclusions from data sets so small.
This is especially true in the playoffs, where nearly any one game can shift the entire dynamic of a series.
This is especially truer when the scorelines of those 3 games are 7-1, 5-1, and 5-1.
But, given that the Penguins and Flyers have a rare extra day off today heading into Wednesday’s pivotal Game 4 showdown in Philadelphia, let’s take a look at how these two teams have stacked up in this series so far.
Note: All stats herein are at even-strength via NaturalStatTrick.com or Corsica.hockey and should be viewed under the pretense that this is a very small sample size.
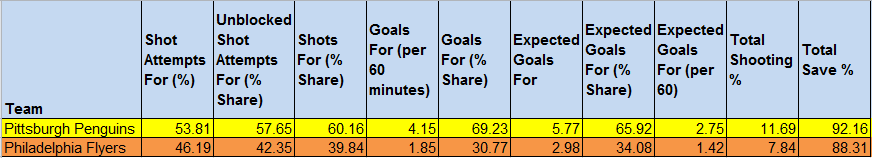
Sometimes, all it takes is a quick glance at the standardized stats to get a good idea as to what is going on. In 3 games, the pace of the series is unsurprisingly being set by back-to-back Conn Smythe Winner Sidney Crosby, whose 4G-3A-7P leads all skaters in the series, factoring in on a staggering 53.8% of the Pens scoring as a whole.
What’s more, the top two lines and D pairings of the Penguins have controlled the series from that standpoint (as well as the possession, shot generation, and chance generation): 7 Pens are clicking at a point per game pace. They include Crosby, Guentzel (1-4-5), Dumoulin (1-4-5), Malkin (2-1-3), Hornqvist (1-2-3), Schultz (1-2-3), and Letang (0-3-3). Comparatively, the Flyers have exactly one player, Sean Couturier, clicking at a point per game (1G-2A-3P).
Obviously, special teams have played a role in these points. So far, the Penguins have scored 4 times on 15 powerplay opportunities, including going 3/7 in Game 3, while the Flyers have gone 2/13, both of which came in the 5-1 Game 2. That’ll hurt anyone’s bottom line.
But, while the Penguins powerplay unit finally clicked in Game 3, that’s not where this story ends.
In fact, not only have the Penguins won the special teams duel, they have been owning the Flyers in practically every single even-strength data bucket we have available.
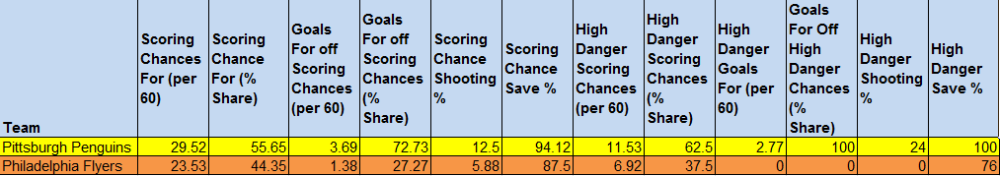
A few things really stand out here considering how this series has gone. First and foremost, while the Penguins are limiting the Flyers to just under 7 High Danger Scoring Chances per 60 minutes of game play, they have also given up exactly 0 (ZERO!!!!) high danger goals. Put another way: Matt Murray has not been beaten from the high danger area of the ice at even strength in this series.
Matt Murray continues to be the good hockey boy. pic.twitter.com/UzIsLvBKKr
— nerd king geoff (@geoffwithano) April 15, 2018
Reasonably, no one can expect that to stand up over the course of an entire series much the same as you cannot reasonably expect the Penguins to continue to shoot at 24% in the High Danger area, but obviously those conversion rates have been a big part of the success thus far.
And it’s not just the High Danger stats where the Penguins are exposing the Flyers. Across the board, the Penguins have, for all intents and purposes, controlled the play and puck at even-strength no matter how you slice and dice it. Whether it be accounting for 53.81% of the attempted shots, or 57.65% of the unblocked shot attempts, or 60.16% of the share of shots on goal, we can see the Penguins have been in control of this series more often than they haven’t.
What’s more is that the Pens have rewarded themselves with this play. It’s one thing to own the puck, but doing something with it and limiting your opposition is a whole different beast.
So, yes, the Penguins are still allowing shots, attempts, and chances of all varieties to one degree or another, they have done a remarkable job limiting the quality of those against, including the aforementioned High Danger chances, while also capitalizing on the chances they generate.
That is- the Pens have owned just a shade under 56% of the scoring chances (29.52 for, 23.53 against per 60 minutes of even strength game play), they have converted those scoring chances into goals 12.5% of the time, more than twice that of the Flyers (5.88%). That’s not inconsequential, considering the Penguins have scored 3.69 goals per 60 minutes from those same scoring chances generated compared to that of 1.38 for the Flyers. That’s a remarkable spread.
But the tale is even more telling when you factor quality into the fold (i.e. High Danger Scoring Chances and Expected Goals). One big “narrative” coming into this postseason was how the Penguins would fair defensively minus Ian Cole. Three games into the postseason, bearing in mind the sample size, we can justifiably say they’ve been good.
Through these 3 games, the Pens, less Ian Cole, have given up just 1.85 goals per 60 minutes of even strength ice time. Moreover, they’ve limited the Flyers Expected Goals per 60 minutes to just 1.42, meaning the Pens are defending well as a unit and limiting quality shots against. This is equally important as generating quality shots of your own, which is precisely what the Penguins have done, nearly doubling the Flyers up once against at 2.75 Expected Goals For per 60 minutes.
Finally, coming full circle, perhaps the most impressive thing the Penguins have done so far in this series has been not just Matt Murray and Co. saving every High Danger Chance again, but also limiting those from existing in the first place.
For perspective, among playoff teams, the Penguins rank 4th best in terms of creating High Danger Chances (per 60 minutes) and 6th best in preventing those HD chances against, giving them a 62.5% share of the High Danger Scoring Chances in this series.
Now, none of this is to say there will not be bumps in the road as both this series and postseason progress. But 3 games in, the defensive concerns have presumably begun to be answered by Kris Letang, Brian Dumoulin, and Matt Murray in shutting down the Flyers while Crosby and Malkin tilt the ice in the Penguins favor.
Great save from Elliott on Crosby, but man, Maatta's play to force that turnover was brilliant. pic.twitter.com/gw7Q0OXpBM
— nerd king geoff (@geoffwithano) April 14, 2018
There’s still 14 wins to be had, but damn it if this isn’t a great start. LGP.
Add The Sports Daily to your Google News Feed!