According to Earl Wilson, the game of baseball is simply a nervous breakdown divided into nine innings. Regardless of the team you root for, just about every fan can relate to that in some way.
While it takes a full nine innings – or, nine nervous breakdowns – for a game to be complete without sub-optimal weather sabotaging it, there are countless moments within each inning that can alter the eventual outcome, whether it’s in the top of the first or bottom of the ninth.
With that in mind, I was interested in finding out which hitters mashed the most in each inning throughout the course of 2016. Thanks to FanGraphs’ Splits Leaderboard, it was pretty easy to do.
Using the very arbitrary benchmark of 80-plus plate appearances for the first through sixth innings, 50-plus plate appearances for the seventh through ninth innings and 20-plus plate appearances for extras, below are the top three hitters from every inning in 2016, based off wRC+.
First Inning
| Player | PAs | Avg. | OBP | Slug% | ISO | wRC+ |
|---|---|---|---|---|---|---|
| David Ortiz | 109 | .398 | .477 | .763 | .366 | 223 |
| Dexter Fowler | 121 | .382 | .479 | .706 | .324 | 214 |
| Daniel Murphy | 95 | .398 | .442 | .675 | .277 | 189 |
What’s most interesting about this trio is the range of roles they played on their respective squads.
David Ortiz and Daniel Murphy were the main power bats, and acted like it by combining to hit 12 homers, 17 doubles and 60 RBI in 204 plate appearances. Dexter Fowler, on the other hand, was the table-setter. He scored 28 runs in the first inning, which doubled Murphy (14) and nearly doubled Ortiz (16).
No wonder the Chicago Cubs said, “You go, we go” to Fowler.
Second Inning
| Player | PAs | Avg. | OBP | Slug% | ISO | wRC+ |
|---|---|---|---|---|---|---|
| Evan Gattis | 86 | .321 | .384 | .692 | .372 | 189 |
| Kyle Seager | 105 | .308 | .400 | .582 | .275 | 166 |
| Starlin Castro | 95 | .352 | .379 | .593 | .242 | 162 |
There’s a pretty sizable gap in power when comparing Evan Gattis to Kyle Seager and Starlin Castro. This is also a testament to the old adage of “It’s not how you start, it’s how you finish.”
Castro enjoyed a nice April (.833 OPS, 123 wRC+), while Seager struggled mightily (.644 OPS, 77 wRC+), yet here they are, equally mashing in the second inning.
Third Inning
| Player | PAs | Avg. | OBP | Slug% | ISO | wRC+ |
|---|---|---|---|---|---|---|
| Charlie Blackmon | 94 | .460 | .489 | .770 | .310 | 218 |
| Josh Donaldson | 109 | .349 | .481 | .709 | .360 | 215 |
| Freddie Freeman | 101 | .374 | .436 | .714 | .341 | 202 |
This is another intriguing trio because although Josh Donaldson has been crushing for a while, Charlie Blackmon and Freddie Freeman both enjoyed career seasons – specifically in the power department.
That shouldn’t be shocking after looking at those third-inning ISOs.
Fourth Inning
| Player | PAs | Avg. | OBP | Slug% | ISO | wRC+ |
|---|---|---|---|---|---|---|
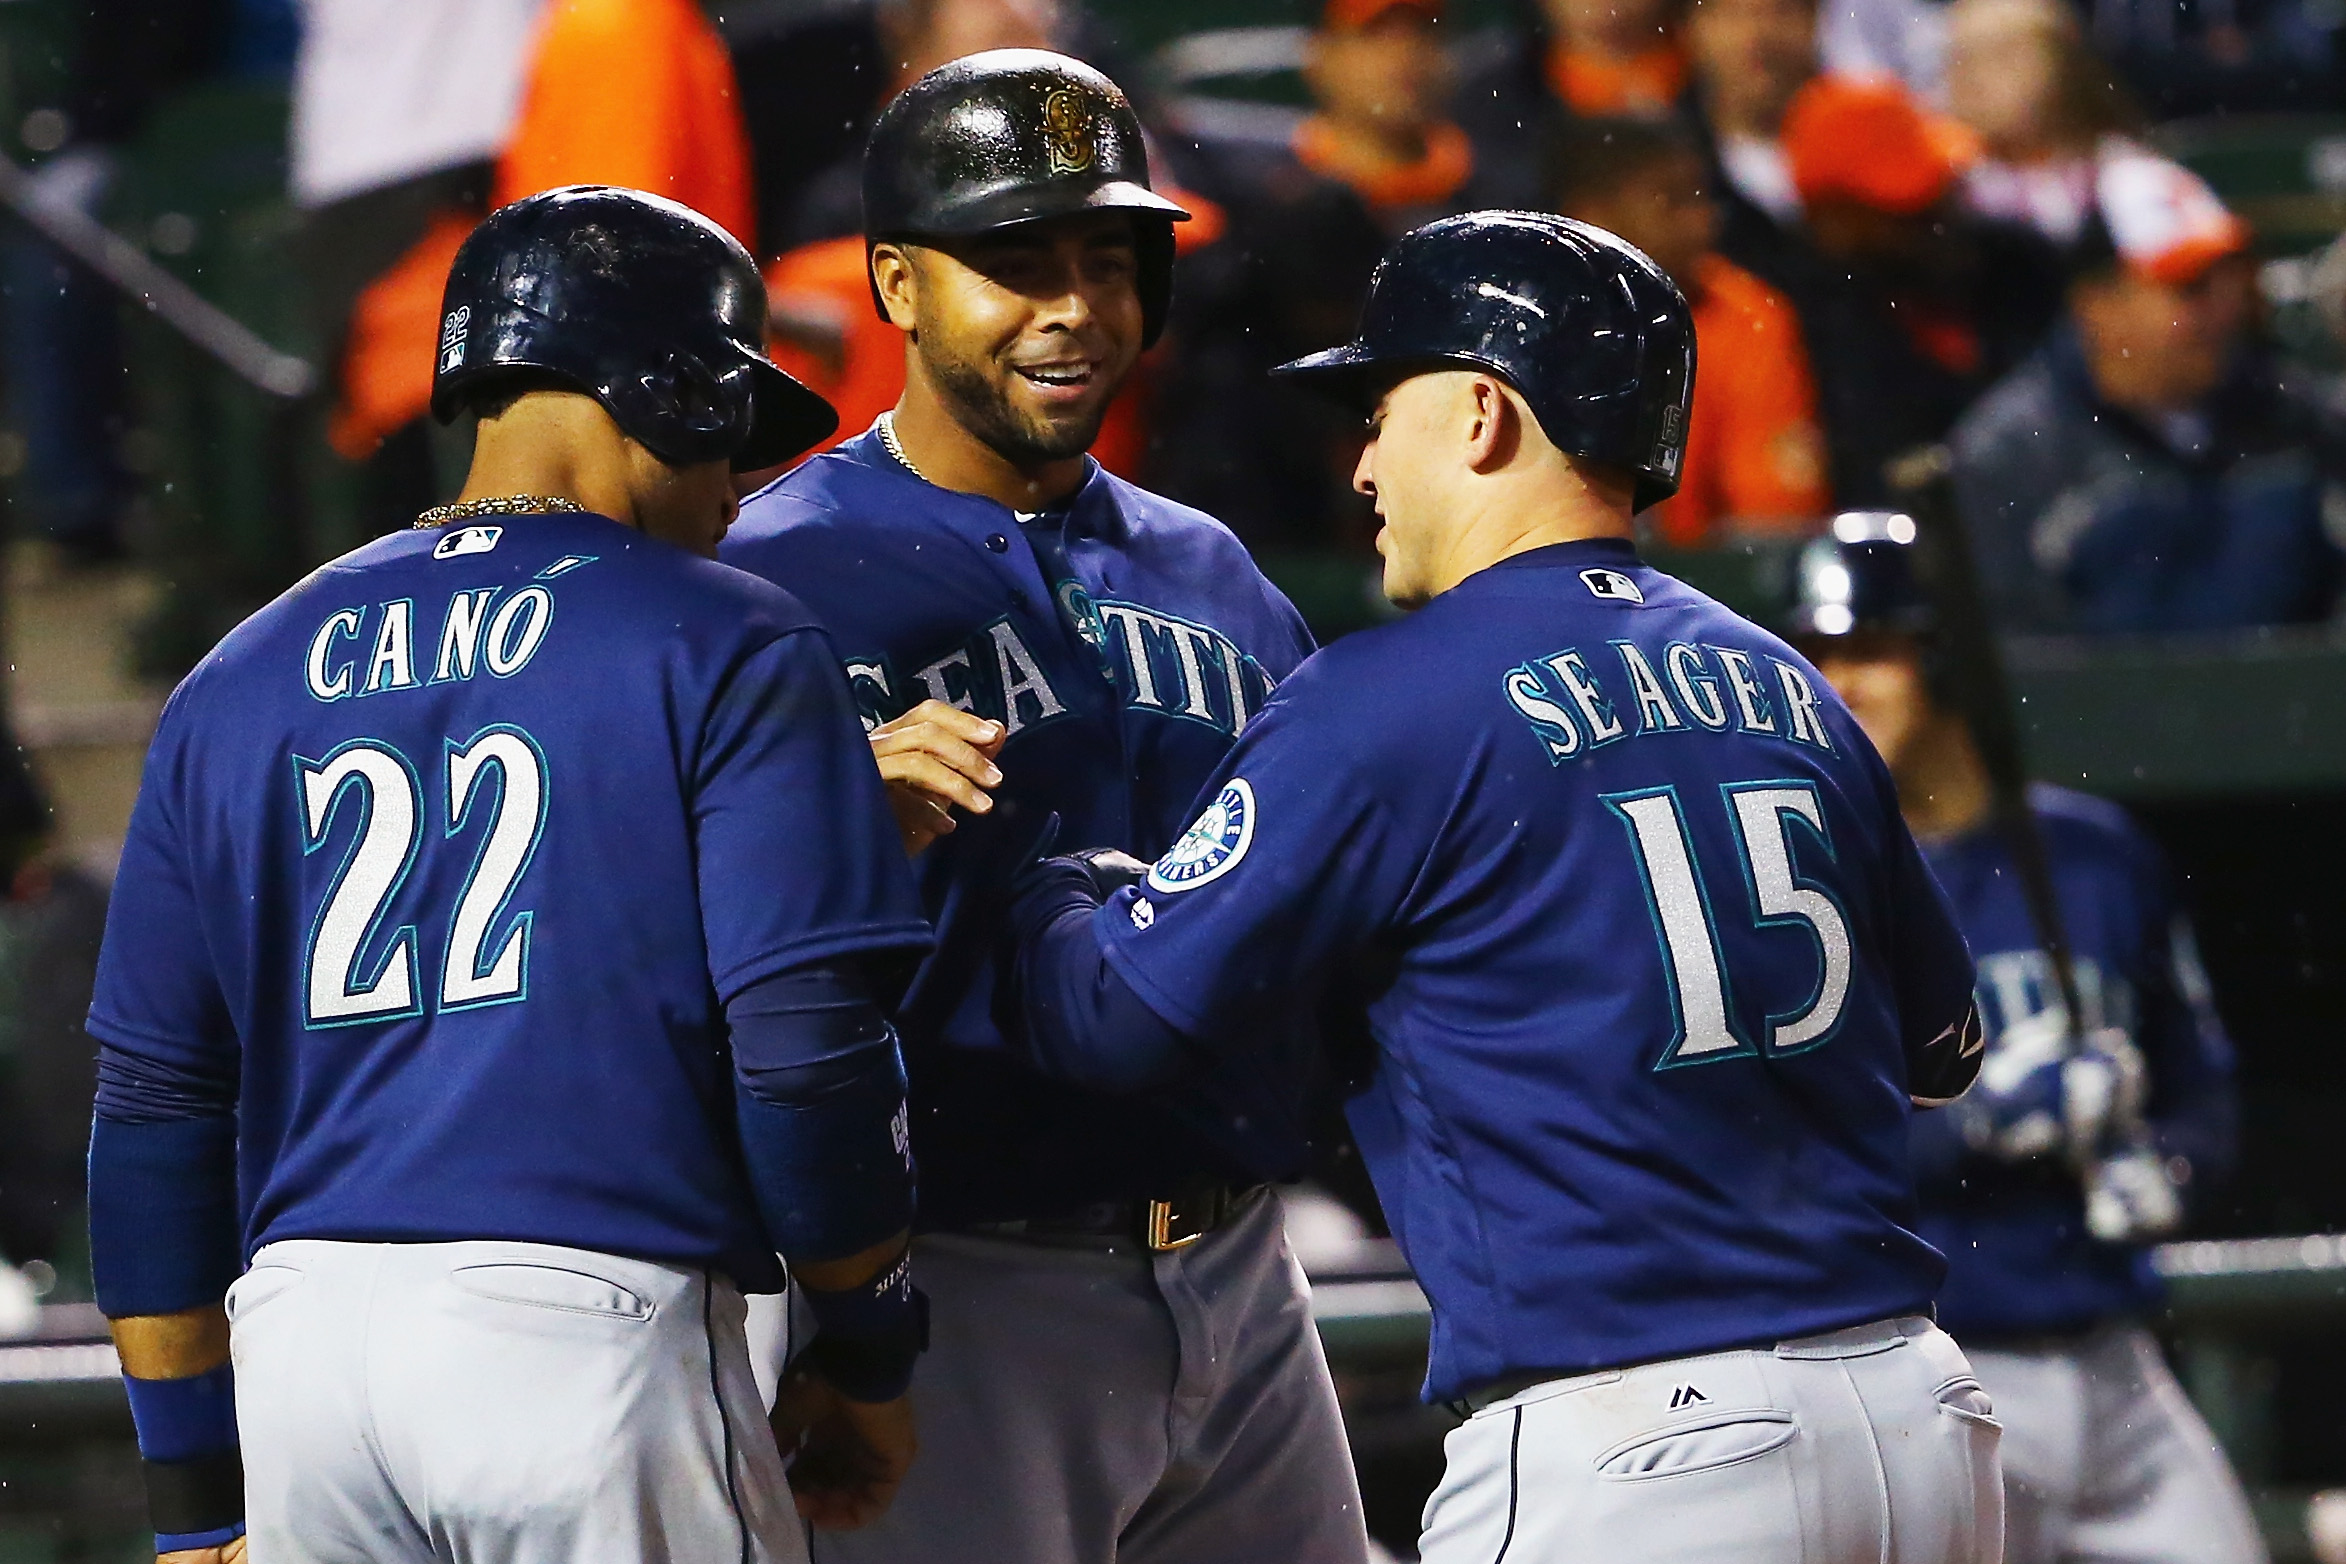
| Nelson Cruz | 89 | .380 | .449 | .785 | .405 | 233 |
| Yasmany Tomas | 81 | .373 | .420 | .760 | .387 | 206 |
| Robinson Cano | 86 | .354 | .407 | .608 | .253 | 178 |
Nelson Cruz and Robinson Cano hold a special distinction amongst the group of players uncovered in this exercise: they’re the only pair of teammates to appear in the same inning.
So, if it felt like one of them was doing something positive in the fourth inning just about every night, it’s because that’s exactly what happened. And with Seager doing his thing in the second inning, they’re one of the best middle-of-the-order threats in baseball.
Fifth Inning
| Player | PAs | Avg. | OBP | Slug% | ISO | wRC+ |
|---|---|---|---|---|---|---|
| Martin Prado | 85 | .438 | .494 | .685 | .247 | 211 |
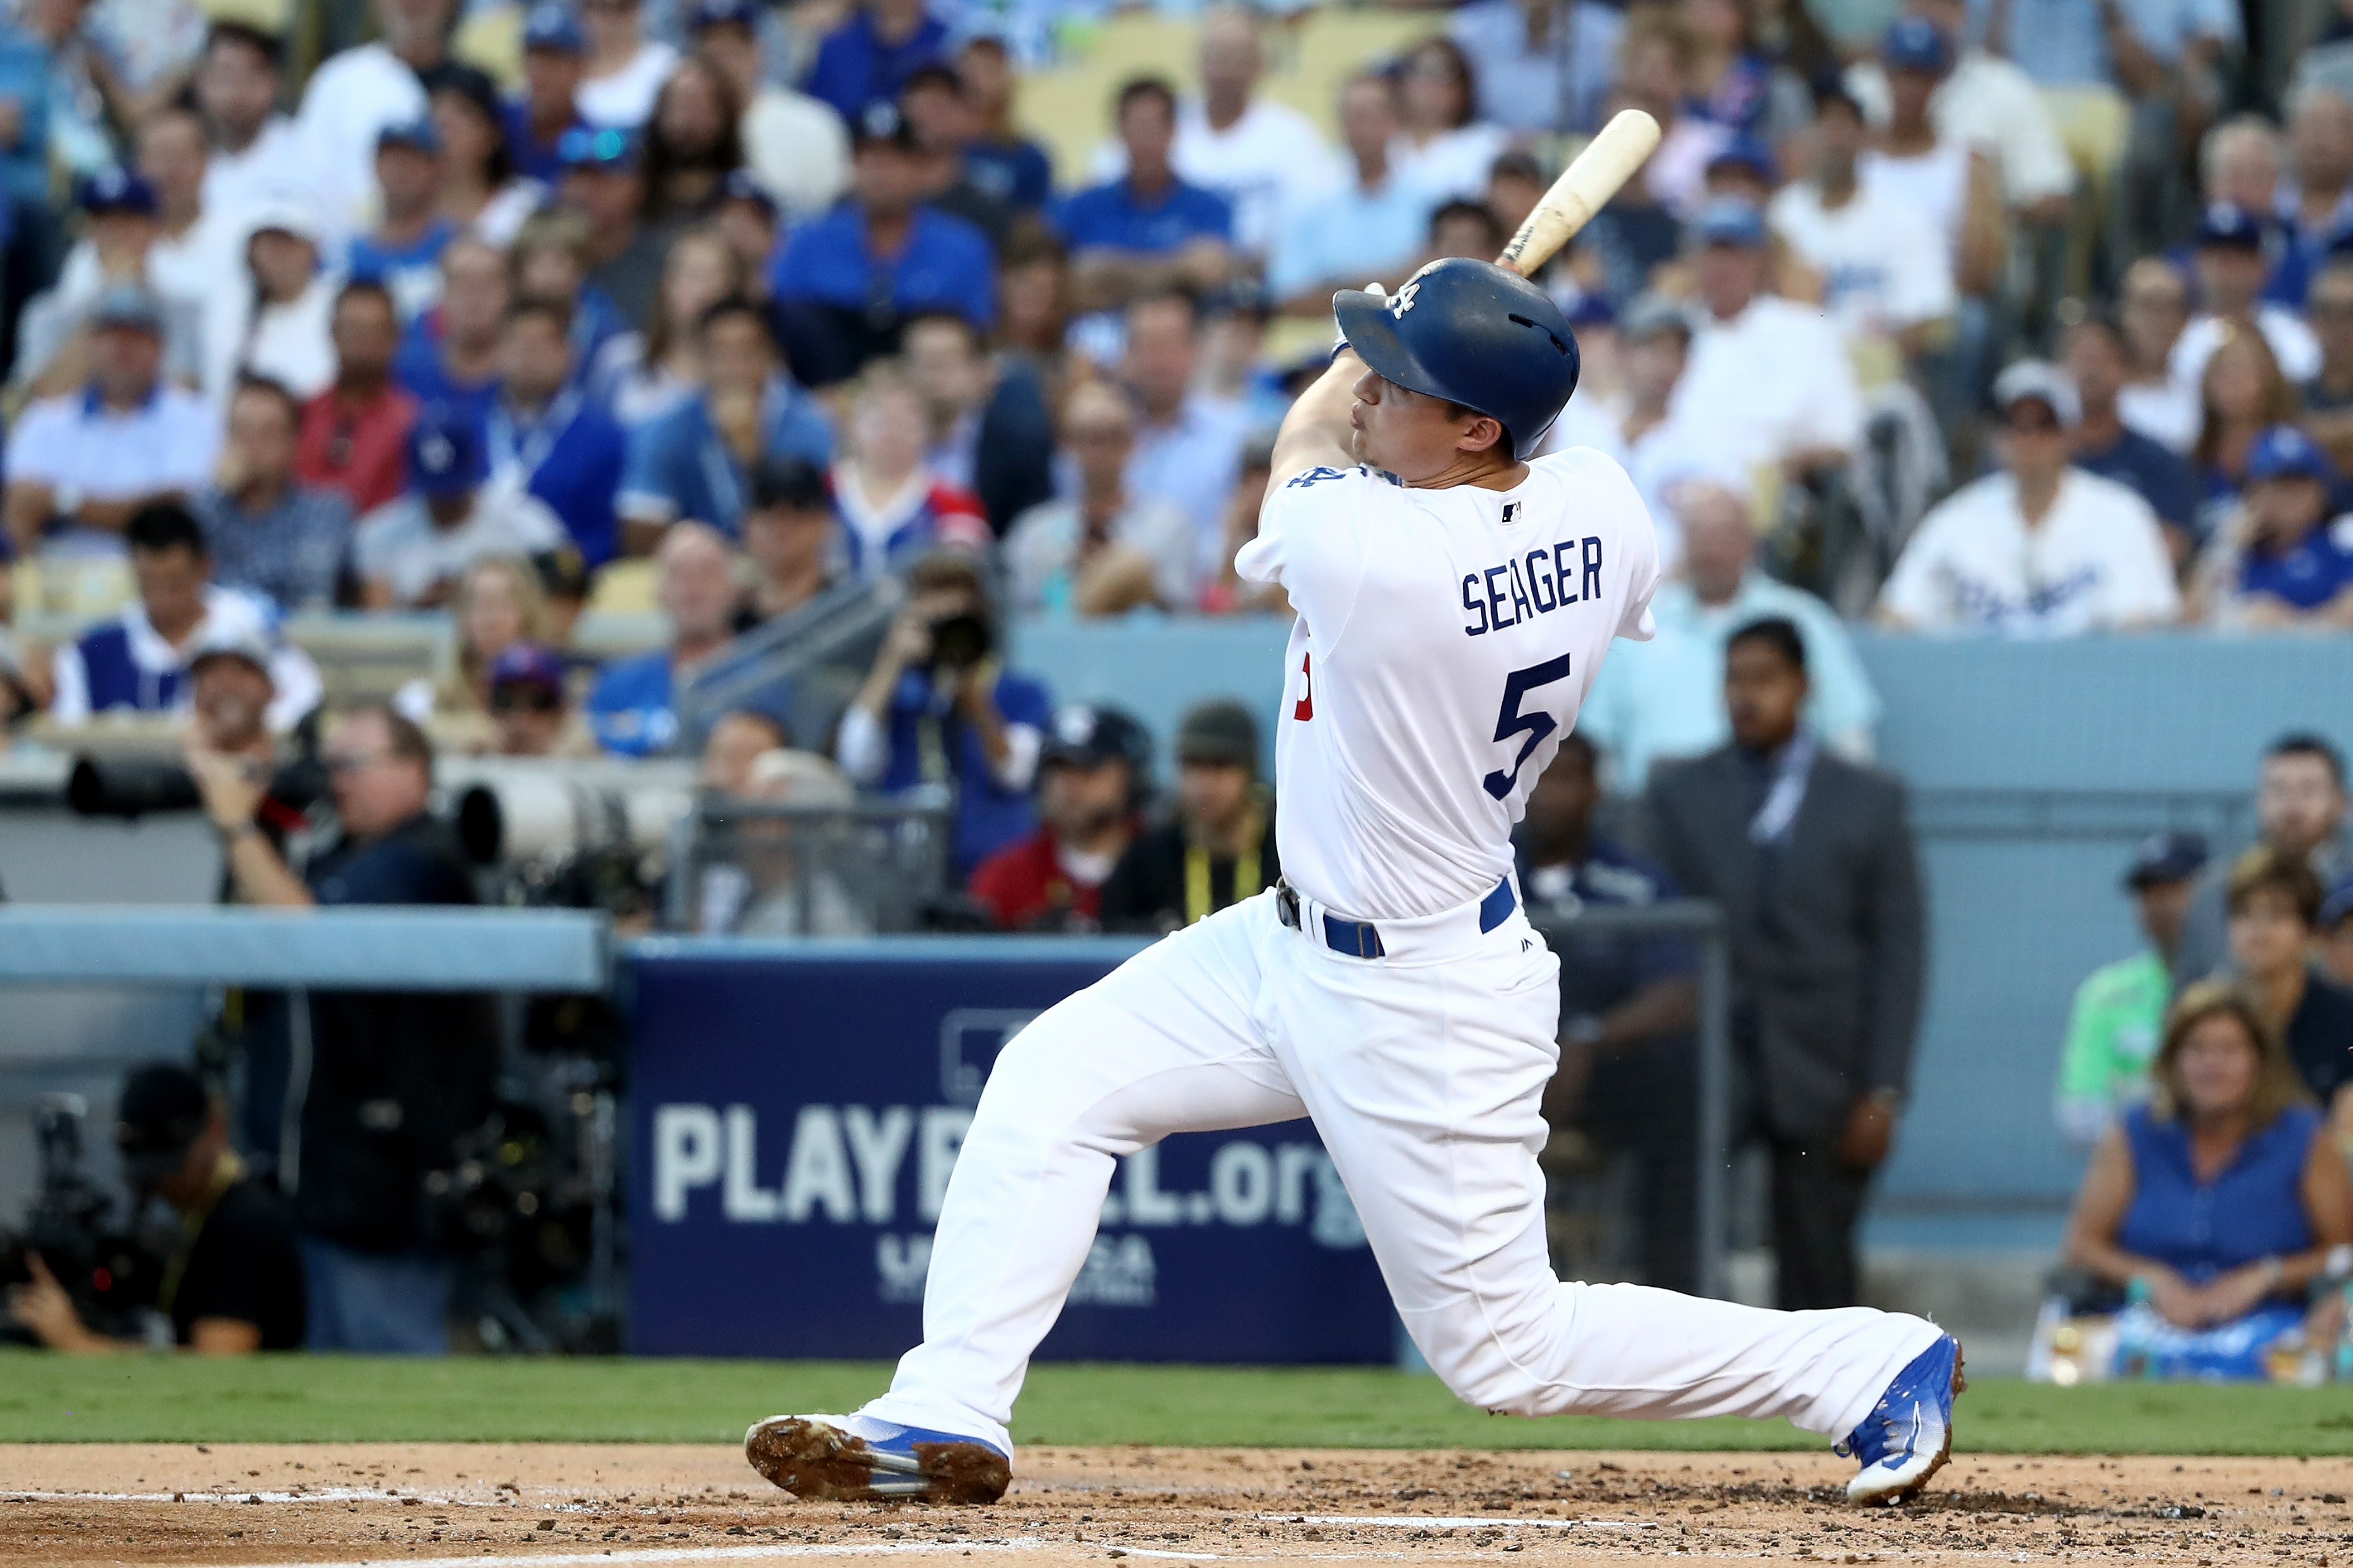
| Corey Seager | 82 | .373 | .427 | .627 | .253 | 187 |
| Jean Segura | 82 | .390 | .427 | .610 | .221 | 173 |
With regard to ISO, this was one of the two least powerful innings we looked at. The fifth and the ninth were the only frames where there wasn’t one hitter with an ISO of at least .300 in the top-three wRC+.
It’s not like they weren’t productive, though. Martin Prado, Corey Seager and Jean Segura combined to hit 10 homers, 20 doubles and 2 triples, but they all scored at least 11 runs and collected 11-plus RBI.
Sixth Inning
| Player | PAs | Avg. | OBP | Slug% | ISO | wRC+ |
|---|---|---|---|---|---|---|
| Manny Machado | 85 | .354 | .400 | .759 | .405 | 203 |
| Joey Votto | 85 | .380 | .482 | .676 | .296 | 201 |
| Jackie Bradley Jr. | 88 | .333 | .420 | .747 | .413 | 200 |
Now, here are some real mashers. To compare them directly against the fifth-inning group, Manny Machado, Joey Votto and Jackie Bradley Jr. combined to hit 22 homers, 14 doubles and 2 triples.
And anyway you slice it, Votto is just an on-base machine. The sixth inning proved to be especially fruitful, as he drew 13 walks in this particular frame.
Seventh Inning
| Player | PAs | Avg. | OBP | Slug% | ISO | wRC+ |
|---|---|---|---|---|---|---|
| Matt Joyce | 56 | .350 | .536 | .925 | .575 | 270 |
| Miguel Cabrera | 58 | .392 | .466 | .902 | .510 | 258 |
| Yoenis Cespedes | 62 | .415 | .484 | .849 | .434 | 243 |
It’s not shocking to see Miguel Cabrera and Yoenis Cespedes in this group, but I was surprised about Matt Joyce – mostly because he was a part-time player for the Pittsburgh Pirates.
Nearly 20% of his 293 plate appearances from last season came in the seventh inning. So, the recipe for success with the Oakland Athletics in 2017 is obviously looking at them right in the face.
With regard to Cespedes, his production tailed off significantly in the last three innings – his OPS went from 1.333 in the seventh, to .832 in the eighth before bottoming out at .583 in the ninth.
Eighth Inning
| Player | PAs | Avg. | OBP | Slug% | ISO | wRC+ |
|---|---|---|---|---|---|---|
| Wilson Ramos | 55 | .420 | .473 | .800 | .380 | 235 |
| David Ortiz | 59 | .388 | .458 | .735 | .347 | 200 |
| Michael Saunders | 64 | .345 | .406 | .707 | .362 | 196 |
As if demolishing opposing pitchers on a nightly basis wasn’t enough for Ortiz in his final MLB season, he gets the extra special honor of being just one of two hitters to show up twice on this list.
For a power hitter in his age-40 season, my favorite stat from Big Papi’s 2016 campaign was that he collected more extra-base hits (87) than strikeouts (86).
Ninth Inning
| Player | PAs | Avg. | OBP | Slug% | ISO | wRC+ |
|---|---|---|---|---|---|---|
| Wil Myers | 55 | .426 | .509 | .660 | .234 | 218 |
| Miguel Cabrera | 50 | .432 | .480 | .682 | .250 | 212 |
| Albert Pujols | 59 | .407 | .458 | .704 | .296 | 212 |
It’s a tie game with two outs in the ninth, who do you want coming to the plate? If we’re using wRC+, it’s these three guys. While Wil Myers is at the top, he probably felt way more comfortable in this situation at home (.954 OPS) than on the road (.633) last year.
Oh, and Miggy joins Papi as the only other player to show up in two separate innings. That shouldn’t surprise you because he’s a hitting machine.
Extra Innings
| Player | PAs | Avg. | OBP | Slug% | ISO | wRC+ |
|---|---|---|---|---|---|---|
| Paul Goldschmidt | 20 | .417 | .650 | .500 | .083 | 194 |
| Denard Span | 22 | .278 | .381 | .667 | .389 | 178 |
| Brandon Crawford | 20 | .368 | .400 | .632 | .263 | 178 |
Since not every game goes into extras, this group was understandably different from the rest.
How so? Well, Paul Goldschmidt was the only player with an ISO less than .221, yet he was the most productive of his trio from a wRC+ standpoint. That 1.150 OPS certainly helped.
Denard Span and Brandon Crawford are teammates and appear in the same group, but I can’t in good faith lump them in with Cruz and Cano since we know this section isn’t confined to just one inning. However, while Span’s BABIP in extras settled in at just .214, it was impressive that he still produced a 1.048 OPS. His was actually higher than Crawford’s (1.032) despite the shortstop having a much higher BABIP (.429).
Conclusion
Does this exercise tell us anything in particular? Maybe, maybe not — it’s not like opposing pitchers are going to intentionally walk Cespedes in the seventh inning strictly because he mashed during that frame in 2016. There are tons of variables that go into something like this, but it’s interesting to see which names pop up after 162 games.
Who will make their way onto these lists in 2017? Thankfully, we’re getting closer to finding out.
Statistics courtesy of Baseball-Reference. Advanced statistics courtesy of FanGraphs, unless otherwise noted.
Thanks for reading! If you’d like to jumpstart your sportswriting career and aren’t sure how, check out my eBook. Don’t forget to follow me on Twitter so we can chat about baseball: @mmusico8.
Add The Sports Daily to your Google News Feed!