Handing out a lucrative, multi-year contract to a player is always risky for an MLB organization, no matter how much of a no-brainer it appears to be. That risk factor goes through the roof when it’s a 10-year, $240 million deal, like the one Robinson Cano signed prior to the 2014 season.
In situations like this — when a player signs a long-term deal on the wrong side of 30 — one can only hope the eventual decline comes much later and is more gradual than expected. It wasn’t looking good early on for Cano, but he fought off Father Time in 2016 with a performance that was reminiscent of his best days in Yankee pinstripes.
Outside of a dip in power, his first season in Seattle was a success. He hit .314/.382/.454 with 14 home runs and 82 RBI, producing a wRC+ of 137 and a 5.2 fWAR – the fifth consecutive year he surpassed 5.0.
It was the first half of 2015 when people likely started to freak out, to a degree.
He limped into the All-Star break with a lackluster triple slash of .251/.290/.370, accompanied by just 6 home runs, 30 RBI and an wRC+ of 86. Providing power as a second baseman had always been one of his best attributes, but a .118 first-half ISO showed that the only thing his power was doing was continuing to deteriorate.
Cano did start to look like himself again following the midsummer classic — he hit .331/.387/.540 with 15 home runs, 40 RBI, a wRC+ of 157, and most importantly, his ISO jumped back up to .209.
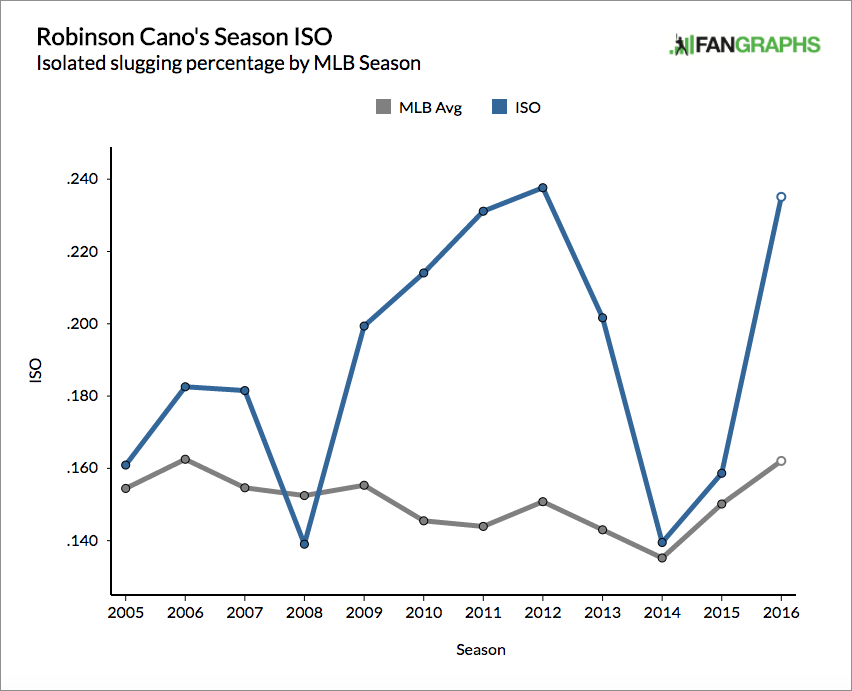
That second-half performance ended up being a sign of what was to come in 2016. In 715 plate appearances, Cano hit .298/.350/.533 with a career-high 39 homers, 103 RBI, 107 runs scored, a wRC+ of 138 and an fWAR of 6.0. His .235 ISO was the second-best mark of his career (.238 in 2012) and represented a huge spike compared to recent years (graph courtesy of FanGraphs).
Were there any similarities between 2016 and his prime years in the Bronx from 2010-12 when Cano’s ISO never dipped below .214 while posting a .311/.370/.539 line with a combined 90 homers and 321 RBI?
Yes, but there are also some interesting differences showing how his game has transformed over the years.
Plate Discipline
Cano debuted with the Yankees in 2005 as a 22-year-old. While he only struck out in 12.3% of his 551 plate appearances, his walk rate settled in at just 2.9%. Here’s what his plate discipline numbers looked like during his peak power years after going through some growing pains at the big-league level.
| Year | O-Swing% | O-Contact% | Z-Swing% | Z-Contact% | Swing% | Contact% | SwStr% |
|---|---|---|---|---|---|---|---|
| 2010 | 35.70% | 75.00% | 73.80% | 94.40% | 51.70% | 86.70% | 6.80% |
| 2011 | 40.50% | 76.20% | 75.40% | 94.60% | 54.70% | 86.50% | 7.30% |
| 2012 | 34.50% | 72.80% | 72.30% | 89.80% | 49.70% | 82.70% | 8.50% |
These numbers produced a walk rate that spanned between 5.6% and 8.8% and a strikeout rate that never rose above 14.1%.
Cano has historically been a little more aggressive at the plate than a league average hitter, but his power spike in 2016 coincided with producing the second-highest O-Swing% of his career.
| Year | O-Swing% | O-Contact% | Z-Swing% | Z-Contact% | Swing% | Contact% | SwStr% |
|---|---|---|---|---|---|---|---|
| 2013 | 33.90% | 77.00% | 71.70% | 93.30% | 49.20% | 86.70% | 6.40% |
| 2014 | 35.60% | 77.40% | 70.30% | 94.40% | 49.60% | 87.20% | 6.20% |
| 2015 | 32.40% | 69.10% | 73.20% | 90.40% | 50.10% | 82.60% | 8.70% |
| 2016 | 37.30% | 71.20% | 71.40% | 93.20% | 51.40% | 83.80% | 8.20% |
Swinging more often doesn’t work for everyone, but it’s sometimes the recipe for success (it was for Freddie Freeman last year, too).
As we can see, Cano didn’t make much more contact overall in 2016 than he did in 2015. However, his contact rate on pitches in the strike zone took a noticeable jump while actually swinging less compared to his power prime with the Yankees.
An overall swing rate hovering around 50% seems to be what works best for Cano, and while he’s doing his fair share of chasing pitches, he also appears to be zeroing in more on those he can do the most damage with. What’s also important is what he’s actually doing to those pitches he’s putting in play.
Batted Ball Profile
During Cano’s peak power years, he watched his line-drive rate increase steadily, along with a decreasing fly-ball rate and a rather steady BABIP.
| Year | Hard% | LD% | GB% | FB% | HR/FB% | BABIP |
|---|---|---|---|---|---|---|
| 2010 | 35.40% | 19.30% | 44.20% | 36.50% | 14.40% | .326 |
| 2011 | 30.70% | 22.30% | 46.70% | 31.00% | 17.00% | .316 |
| 2012 | 38.10% | 25.60% | 48.70% | 25.80% | 24.10% | .326 |
The fly-ball trend continued between 2013-15 while his line-drive rate hovered around the same general number…until 2016.
| Year | Hard% | LD% | GB% | FB% | HR/FB% | BABIP |
|---|---|---|---|---|---|---|
| 2013 | 38.50% | 26.00% | 44.30% | 29.80% | 17.30% | .327 |
| 2014 | 28.50% | 22.60% | 52.60% | 24.70% | 10.70% | .335 |
| 2015 | 32.40% | 24.20% | 50.50% | 25.30% | 15.90% | .316 |
| 2016 | 35.50% | 18.00% | 45.90% | 36.10% | 19.30% | .299 |
This could be a product of where he plays his home games now. Hitting at Yankee Stadium – especially for a left-handed power hitter – is much different than at Safeco Field, even though ESPN’s Park factors from last season show they’re not too far apart with regard to homers.
This trend also explains why he finished with a .299 BABIP, which was the second lowest of his career (.283 in 2008).
Baserunning and Fielding
What do baserunning and fielding have to do with Cano’s ISO? Well, there may or may not be a link, but he’s been at his best in these areas when at the top of his game from a power perspective.
He hasn’t exactly been an asset on the bases throughout his career (a -28.7 BsR makes that pretty clear), but he also wasn’t egregiously bad during that 2010-12 time period.
| Year | BsR |
|---|---|
| 2010 | 0.8 |
| 2011 | 0.8 |
| 2012 | -3.3 |
He has produced one positive BsR rating since then, but it also came with two of his worst before being close to average again last year.
| Year | BsR |
|---|---|
| 2013 | -4.3 |
| 2014 | 1.3 |
| 2015 | -8.5 |
| 2016 | -1.8 |
Much more manageable last year than what the numbers settled in at in ’13 and ’15, I’d say.
Cano has made his fair share of slick plays on defense, but it’s been a very inconsistent part of his game. His best three-year stretch came when he was mashing the ball, though.
| Year | DRS | UZR |
|---|---|---|
| 2010 | 18 | -0.5 |
| 2011 | 2 | -2.6 |
| 2012 | 15 | 11.2 |
After that solid 2012 season, his glove consistently deteriorated…until turning back the clock in ’16.
| Year | DRS | UZR |
|---|---|---|
| 2013 | 6 | 0.8 |
| 2014 | 0 | -3.8 |
| 2015 | -9 | -7.9 |
| 2016 | 11 | 1.5 |
His increased production on defense is a big reason why Cano reached the 6.0-fWAR mark for the third time in his career, and the first time since – well, you can probably guess by now – 2012 (7.6).
Is it Sustainable for 2017?
The best thing Cano has going from him from an offensive standpoint in 2017 is his lineup protection. Outside of newcomers at the top of the lineup in Jarrod Dyson and Jean Segura, he has Nelson Cruz hitting behind him in the cleanup spot, followed by Kyle Seager in the five-hole.
As we discussed recently, the Cano-Cruz-Seager middle-of-the-order is one of the best trios in the league, combining to hit 112 home runs and collect 307 RBI in 2016.
Cruz is especially important to the equation, because if he keeps hitting 40-plus homers a year (as he’s done in each of the last three seasons), opposing hurlers will have to think twice about pitching around Cano. However, the second baseman’s batted ball trends are the most concerning when trying to figure out if he can repeat what he just did.
The increased home-run rate is a nice byproduct of hitting more fly balls, but it’ll start getting harder to maintain that kind of production as he reaches his mid- to late-30s. Expecting another season of nearly 40 homers from Cano wouldn’t be realistic given the point he’s at in his career and the fact that he’s only had two 30-plus homer campaigns since debuting in 2005. Somewhere around the 20-25 range is a reasonable expectation.
Cano’s 2016 season was a flashback to his best years with New York, but at this point in his baseball life, Seattle will certainly take brief flashes of his peak power production. With the lineup general manager Jerry Dipoto has put around him, that’s all he really has to do, and anything more is a bonus.
Statistics courtesy of Baseball-Reference. Advanced statistics courtesy of FanGraphs, unless otherwise noted.
Thanks for reading! If you’d like to jumpstart your sportswriting career and aren’t sure how, check out my eBook. Don’t forget to follow me on Twitter so we can chat about baseball: @mmusico8.
Add The Sports Daily to your Google News Feed!