An MLB hitter posting a season with at least 40 home runs is never not impressive, but is there a time when it’s not as impressive as it should be?
The answer to that question is yes.
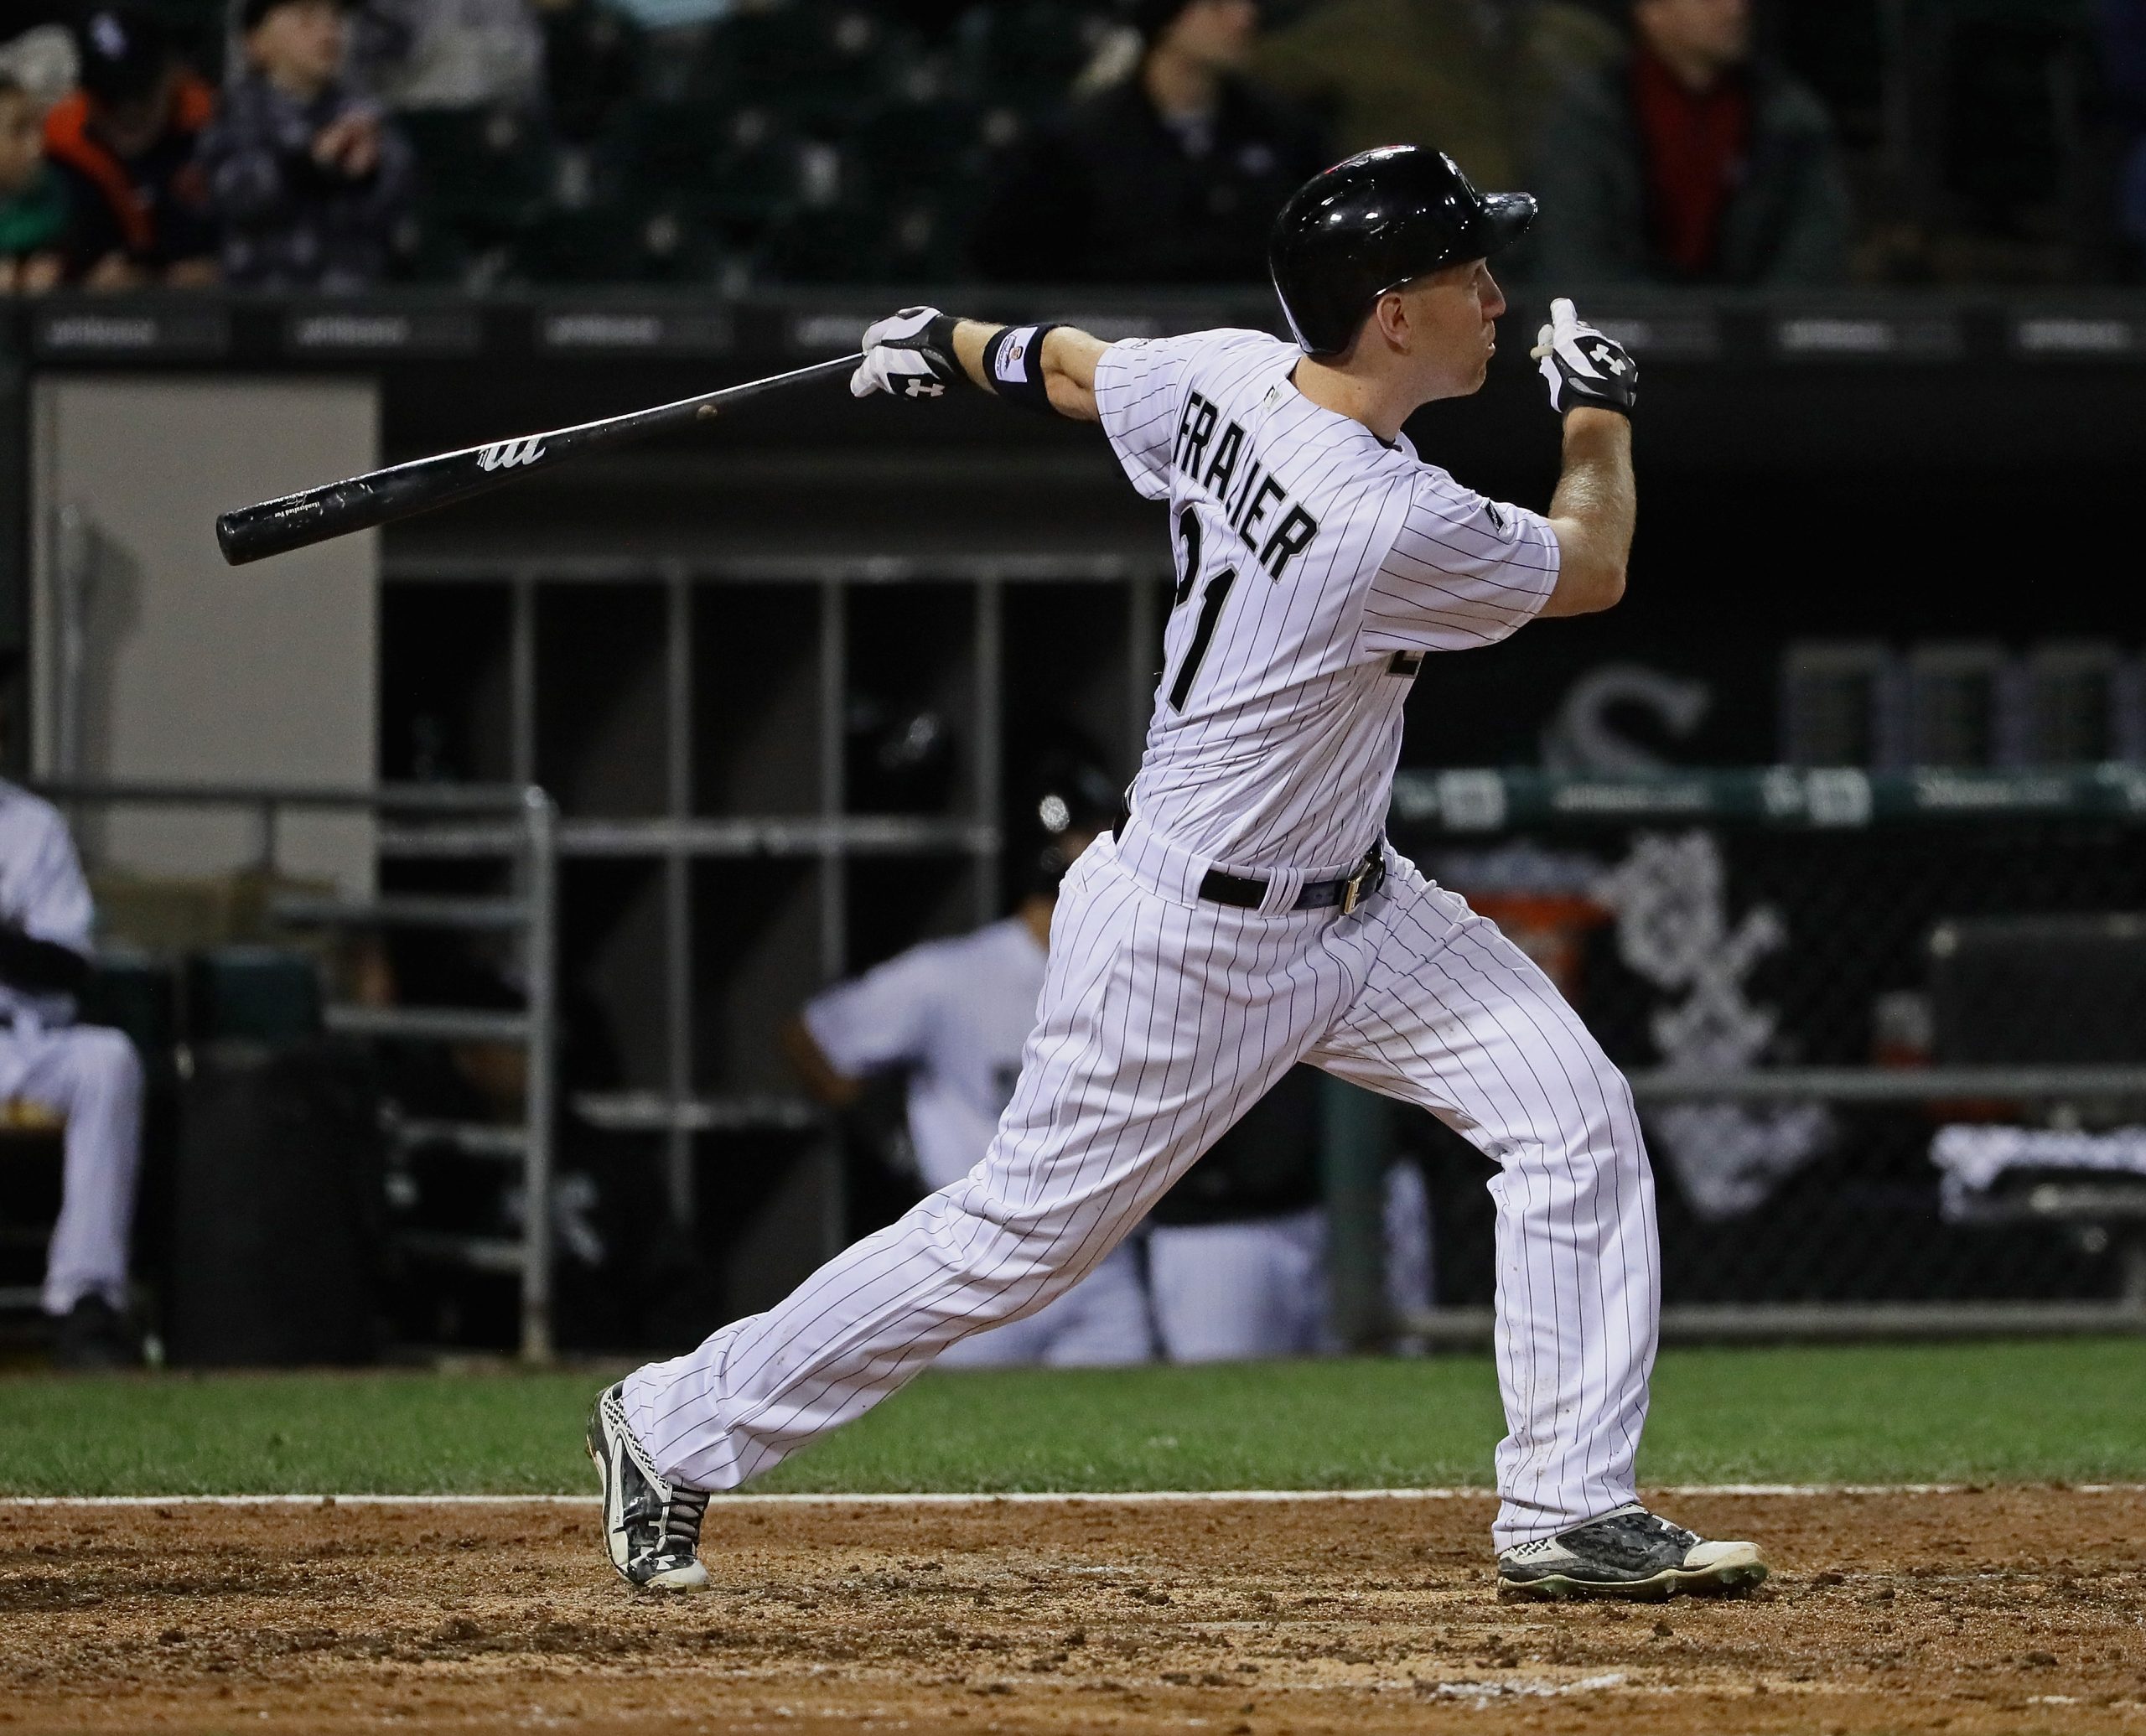
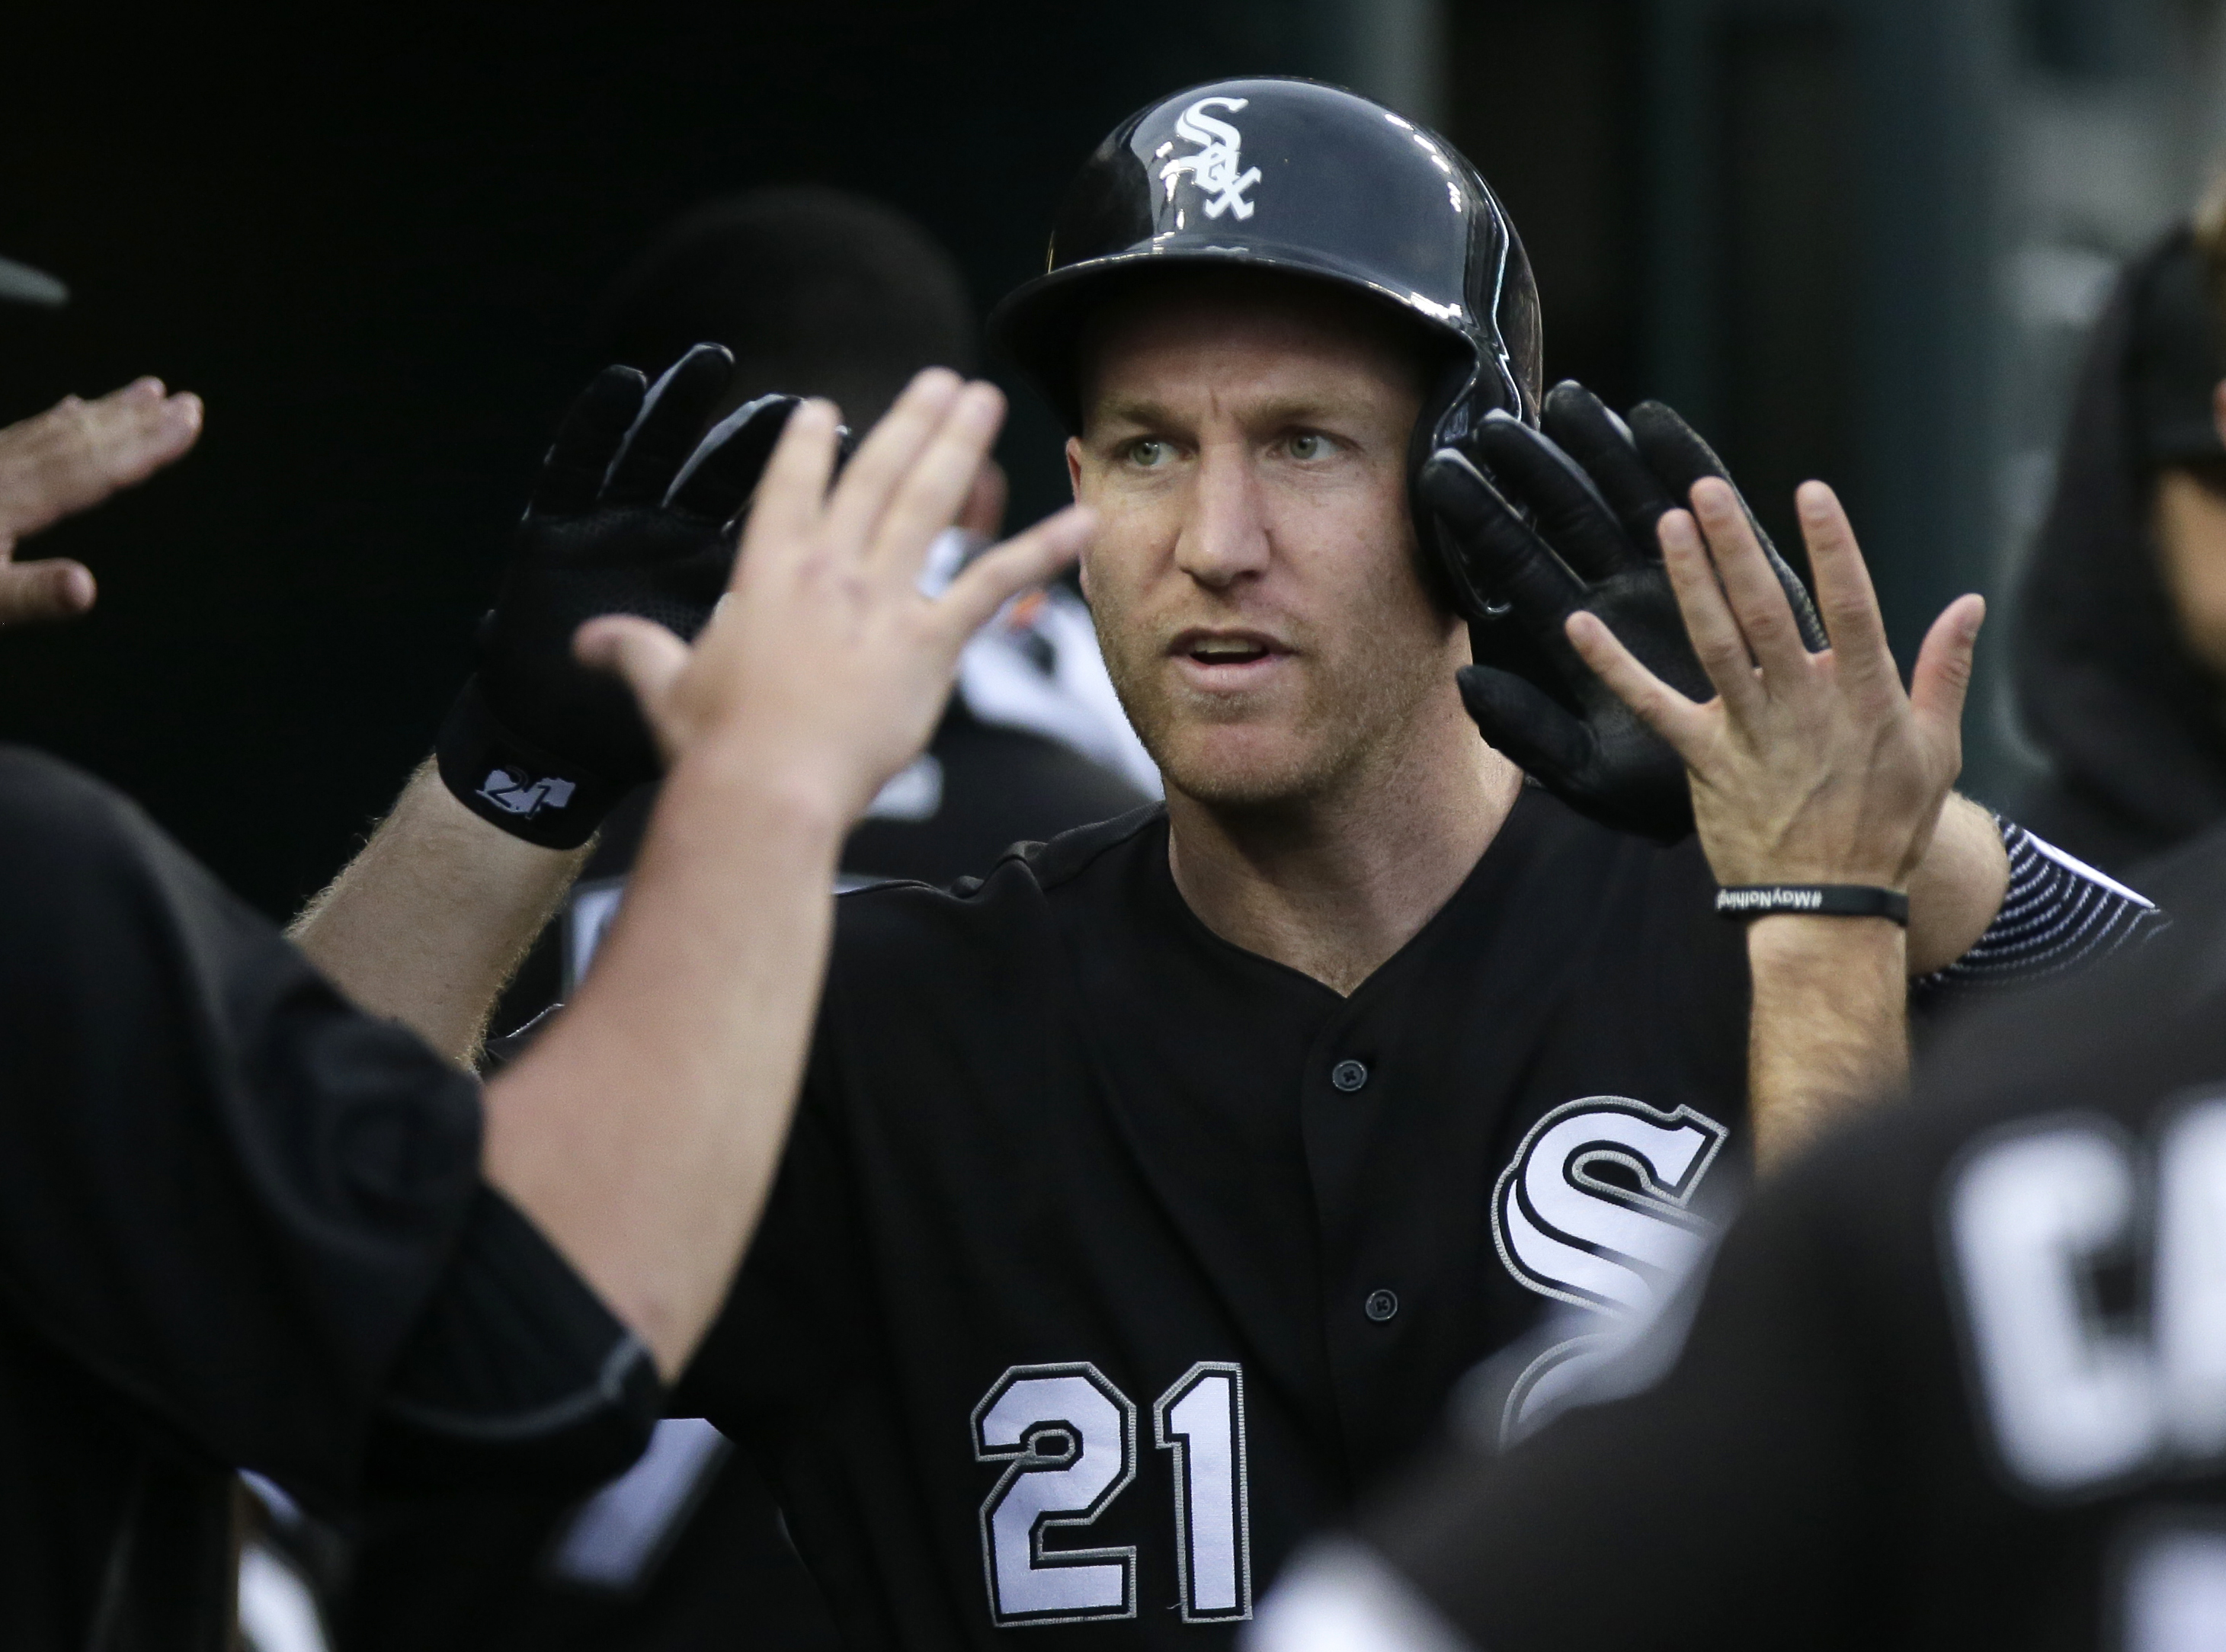
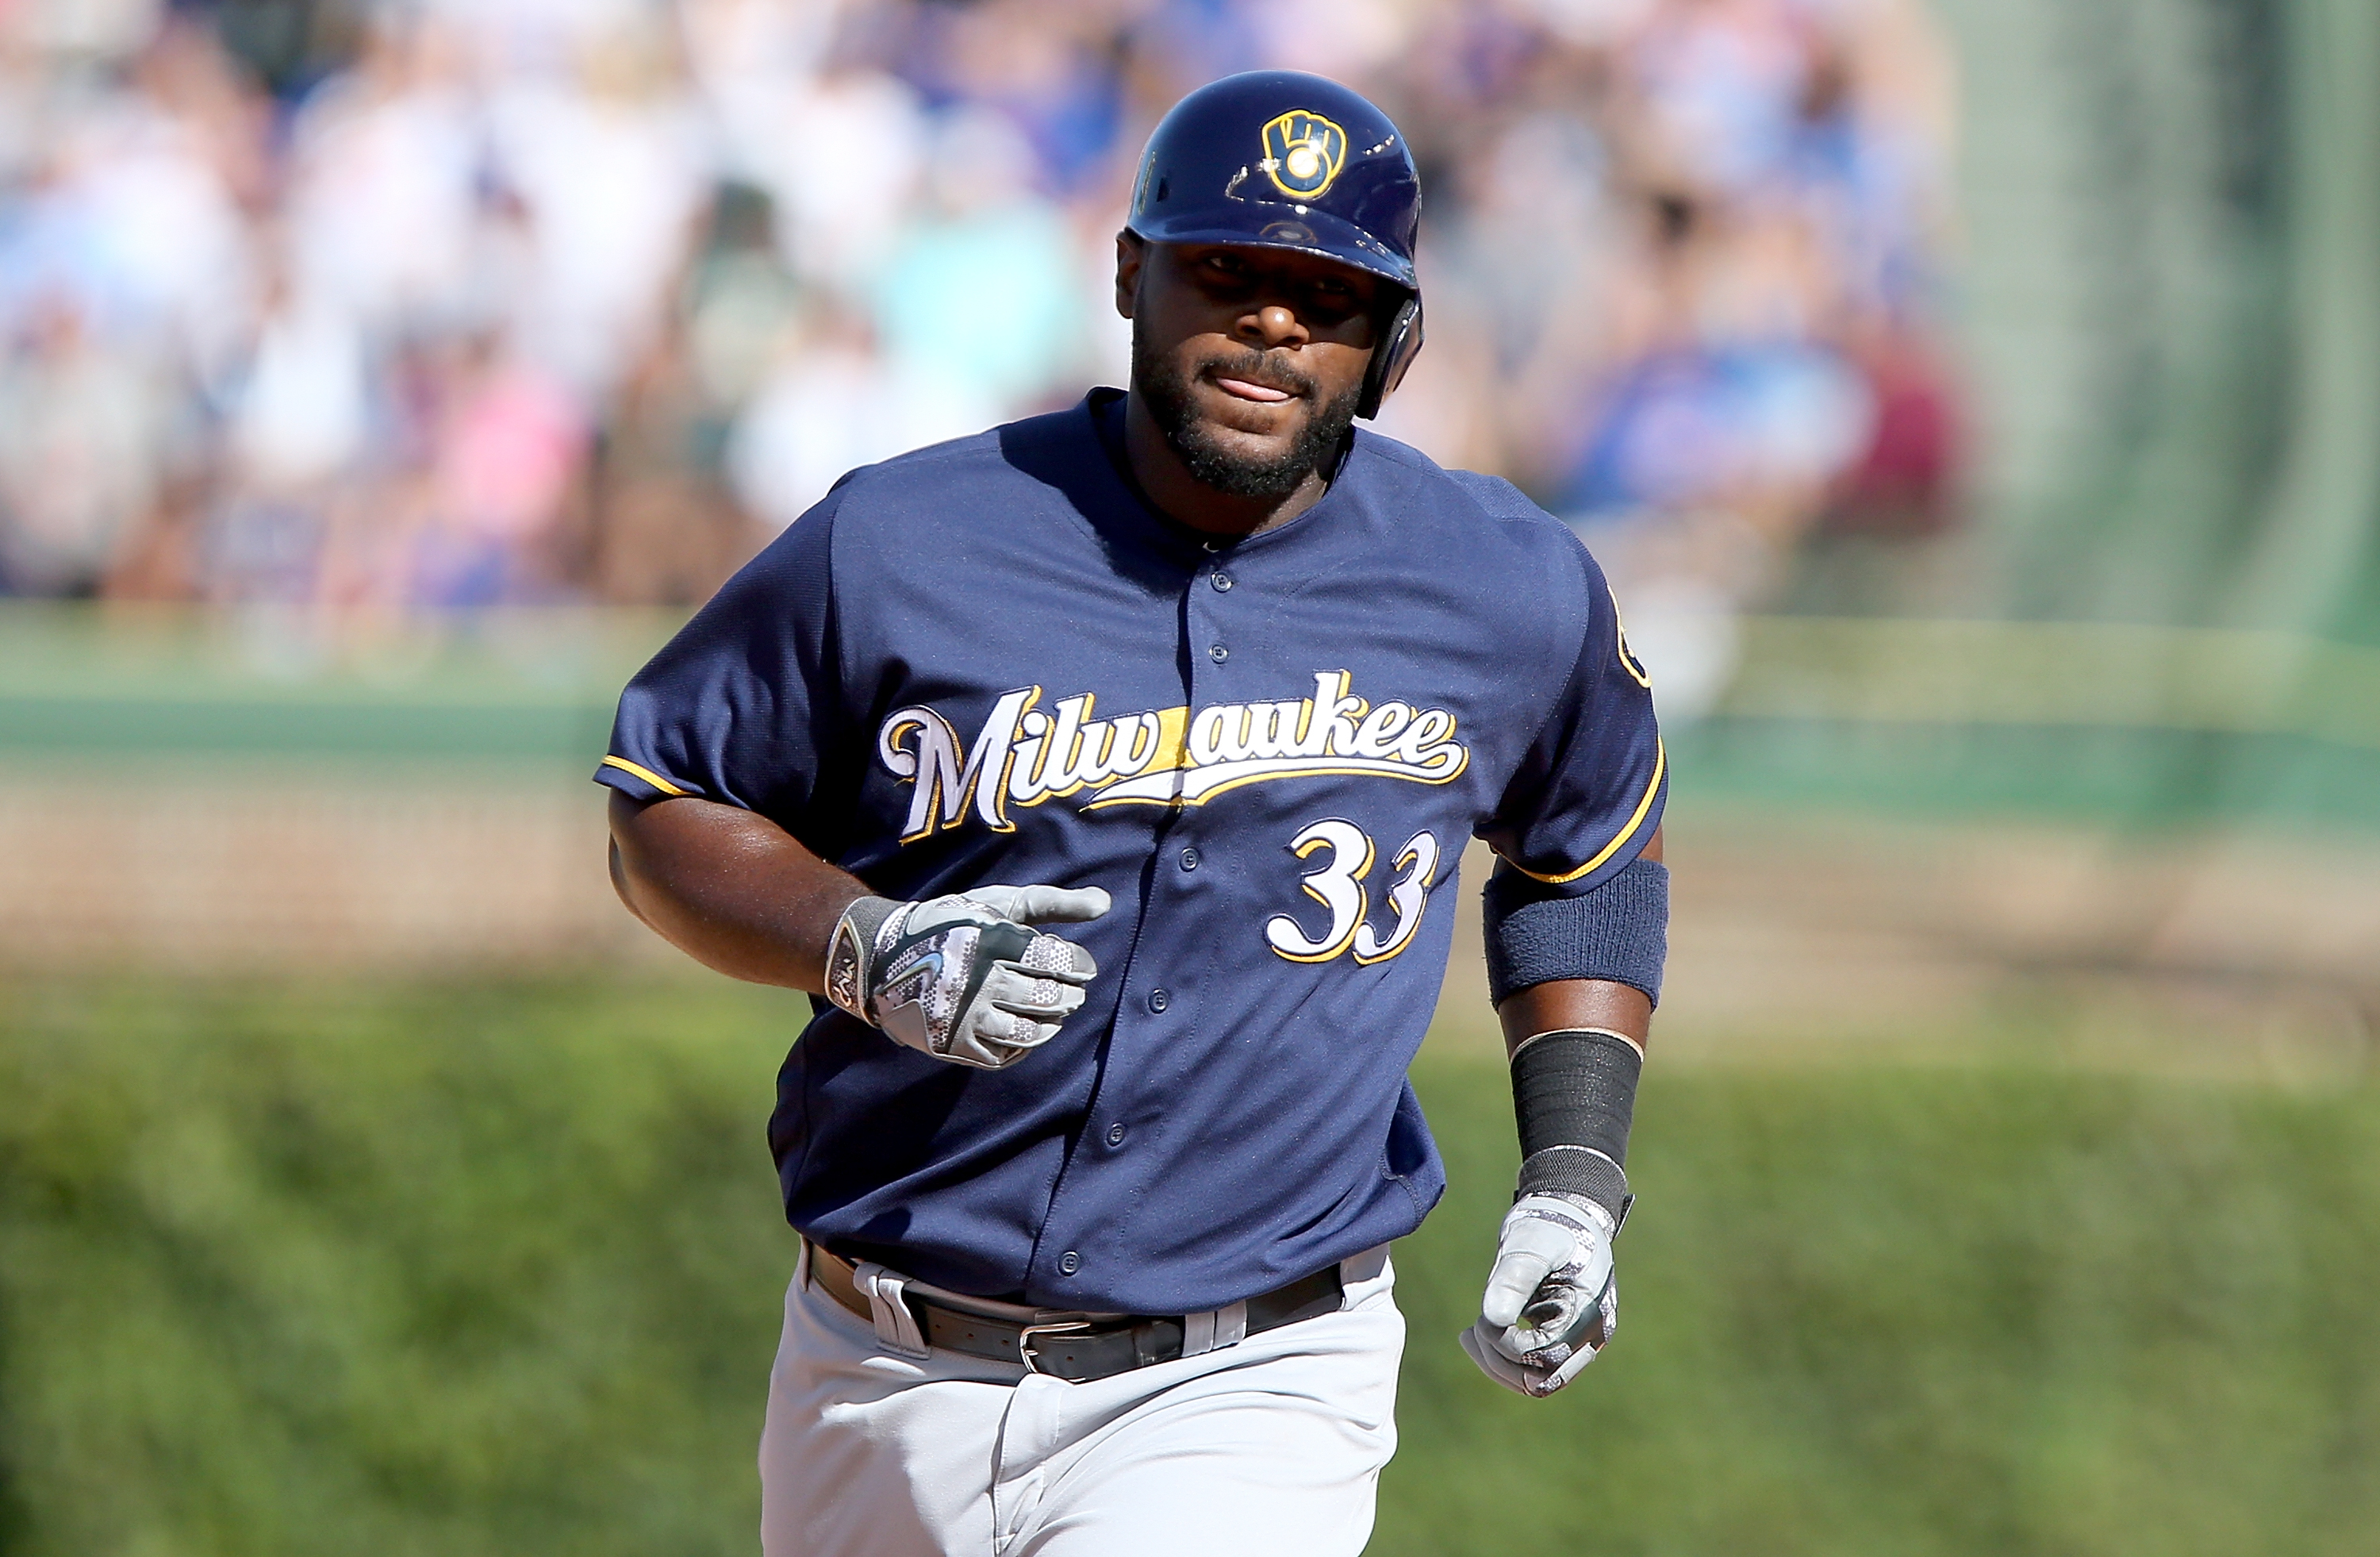
Upon seeing players at the top of home run leaderboards for any given year, there could be a tendency to automatically think they’re some of baseball’s best. With regard to 2016, only eight sluggers surpassed 40 homers, but there are four that stand out: Mark Trumbo, Khris Davis, Chris Carter and Todd Frazier.
Despite mashing taters with the best of them this past season, their overall numbers – we’re talking about fWAR, in particular – don’t follow suit. Davis’ 2.5 fWAR is the highest, which just barely squeaks into the top-75 in 2016.
Obviously, this metric brings defense into the equation, but it intrigued me enough to investigate how their homer-rich performances rank against others in recent memory.
Using FanGraphs’ new splits leaderboard, I went all the way back to 2002 to see how the 40-homer seasons from these four stacked up, and it didn’t paint a pretty picture for a couple of sluggers.
Tale of the Tape
To keep this comparison strictly about offense, we’re going to use wRC+ and Off from FanGraphs. For frame of reference, here’s what the numbers for these metrics mean:
| Rating | wRC+ | Off |
|---|---|---|
| Excellent | 160 | 45 |
| Great | 140 | 30 |
| Above Average | 115 | 15 |
| Average | 100 | 0 |
| Below Average | 80 | -5 |
| Poor | 75 | -15 |
| Awful | 60 | -25 |
Considering this, it’s entirely possible to assume a hitter at the top of the homer leaderboard is at least in the “above average” category here.
That’s not the case. You know what happens when you assume, guys.
There have been 88 different 40-plus homer performances since 2002, and the four hitters we’ve been talking about are among the most average of them all.
Trumbo and Davis squeak into the “above average” category with regard to wRC+, but Frazier and Carter weren’t as fortunate:
| Player | Season | Team | PA | HR | ISO | wRC+ |
|---|---|---|---|---|---|---|
| Todd Frazier | 2016 | White Sox | 666 | 40 | .239 | 102 |
| Chris Carter | 2016 | Brewers | 644 | 41 | .277 | 112 |
| Carlos Gonzalez | 2015 | Rockies | 608 | 40 | .269 | 114 |
| Adam Dunn | 2012 | White Sox | 649 | 41 | .263 | 115 |
| Albert Pujols | 2015 | Angels | 661 | 40 | .236 | 115 |
| Adam Dunn | 2006 | Reds | 683 | 40 | .257 | 115 |
| Curtis Granderson | 2012 | Yankees | 684 | 43 | .260 | 116 |
| Nolan Arenado | 2015 | Rockies | 665 | 42 | .287 | 119 |
| Ryan Howard | 2008 | Phillies | 700 | 48 | .292 | 120 |
| Mark Trumbo | 2016 | Orioles | 667 | 47 | .277 | 123 |
| Khris Davis | 2016 | Athletics | 610 | 42 | .277 | 123 |
(The above 11 players posted the worst wRC+ in a 40-homer season since 2002)
With regard to Off, it’s the same story – Trumbo and Davis hover around the “above average” designation, while Frazier and Carter are trailing behind:
| Player | Season | Team | PA | HR | ISO | Off |
|---|---|---|---|---|---|---|
| Todd Frazier | 2016 | White Sox | 666 | 40 | .239 | 2.7 |
| Chris Carter | 2016 | Brewers | 644 | 41 | .277 | 5.1 |
| Albert Pujols | 2015 | Angels | 661 | 40 | .236 | 6.8 |
| Adam Dunn | 2012 | White Sox | 649 | 41 | .263 | 9.8 |
| Carlos Gonzalez | 2015 | Rockies | 608 | 40 | .269 | 11.3 |
| Nolan Arenado | 2015 | Rockies | 665 | 42 | .287 | 14 |
| Khris Davis | 2016 | Athletics | 610 | 42 | .277 | 14 |
| Paul Konerko | 2004 | White Sox | 643 | 41 | .258 | 14.5 |
| Adam Dunn | 2006 | Reds | 683 | 40 | .257 | 14.8 |
| Mark Trumbo | 2016 | Orioles | 667 | 47 | .277 | 16.7 |
(The above 10 players posted the worst Off rating in a 40-homer season since 2002)
While a 40-homer season is nothing to scoff at – once again, it’s only happened 88 times since 2002 – the peripherals for Frazier and Carter don’t measure up.
They’re both also in an interesting position this winter.
Frazier is on the Chicago White Sox, who have decided to rebuild after trading Chris Sale and Adam Eaton at the Winter Meetings. “No one is sacred” according to Jon Heyman of FanRag Sports, so it only makes sense to think Frazier – who will enter free agency following next season – is a logical trade candidate.
For Carter, the Milwaukee Brewers decided against tendering him a contract, which put him on the open market for the second consecutive winter.
Finding a new home could be a process because there are other power options still available (Edwin Encarnacion, Jose Bautista, J.D. Martinez, etc.). However, it’s also because advanced statistics show that their respective 40-homer seasons weren’t as impressive as one would think at first glance.
Todd Frazier
Heading into the 2016 All-Star break, Frazier was among the league leaders in home runs (25), but wasn’t doing much else. He posted a .476 slugging percentage, a .782 OPS and outside of those dingers, he collected just nine other extra-base hits (all doubles).
What makes it a little more concerning is this was basically a continuation of a tough second half from 2015. After posting a .922 OPS with 25 homers for the Cincinnati Reds before the midsummer classic, he went on to slash .220/.274/.390 with 10 bombs from then to the end of the year.
His .236 BABIP this past year was a career-low, but other stats don’t support this just being some bad luck:
- His strikeout rate rose to a career-high 24.5%.
- His line-drive rate dipped to a career-low 15.7%.
- His hard-hit rate dropped down to 31.3%, which was the lowest since he became an everyday player in 2012.
It’s not every day you see a player finish eighth in all of baseball with regard to homers, but 60th in slugging percentage (.464). For a one-year commitment, it’s not a bad gamble for a team to take, but don’t expect them to give up any kind of huge prospect package to acquire him.
Chris Carter
When looking at a number of stats, Carter enjoyed a career year with the Brewers — he set new personal bests in homers (41), doubles (27), hits (122), RBI (94) and runs scored (84).
Going to the National League and having to play the field every day did a number on his fWAR, though, which settled in at just 0.9.
But as we can see from his Off rating, it’s not as if his defense was what held back his overall advanced stats from shining. He led the NL in strikeouts with 206 and kept his streak alive of posting a K-rate north of 30% (he’s done it each year since 2012).
Carter’s offense did take a step forward after posting a disappointing .199/.307/.427 for the Houston Astros in 2015, but his baserunning continues to deteriorate (career-worst -4.1 in ’16) and the defense isn’t getting any better.
The assumption is he’d get a fair amount of interest because of his power, but it’s tough to have teams hot on your tail when there are others still available who excel in multiple facets of the game. Especially since Carter’s past track record hasn’t been the most consistent.
Conclusion
Homers are really cool. Finding a player who can hit them more often than anyone else is something many organizations pay top-dollar for.
It’s tough to justify a trade or meeting a player’s asking price in free agency when there’s not much more to their game, though. We’ve spent a lot of time recently dissecting just how powerful 20-plus homer hitters were in 2016, so we know a lot more goes into judging someone in that particular department than just how many balls cleared the fence.
When it comes to jogging around the bases, Frazier and Carter are among the elite last season. But when it comes to viewing how productive they were in comparison to other top power hitters, they aren’t close.
It’s weird calling a 40-homer campaign “average” because honestly, there’s nothing average about accomplishing such a feat. However, when looking at the numbers, what Frazier and Carter just did are two of the most average performances we’ve seen since nearly the turn of the century.
Statistics courtesy of Baseball-Reference. Advanced statistics courtesy of FanGraphs, unless otherwise noted.
Thanks for reading! If you’d like to jumpstart your sportswriting career and aren’t sure how, check out my eBook. Don’t forget to follow me on Twitter so we can chat about baseball: @mmusico8.
Add The Sports Daily to your Google News Feed!


