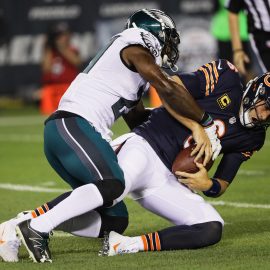
It seems most of us already know: the biggest factor in losing a football game is usually when your turnover-to-takeaway ratio is a big fat round number. Say, like 3-to-1.
Of course, this is as simplistic as saying the team with the most points at the end of the game wins. No big revelation here…
Still, our guest columnist Andrew Kulp of The 700 Level insists it is the key reason why the 49ers and the Giants are still playing today…and the Eagles are not.
Here’s Andrew Kulp’s take:

“ESPN reporter and former Philadelphia Inquirer scribe Ashley Fox published a telling piece on Friday about the only statistic that ultimately matters on the gridiron: turnover margin. “Since 2000, teams that have been plus-1 [or better] in turnover margin have won 92 of 128 postseason games (a winning percentage of .719). Teams that have lost the turnover battle have won just 14.8 percent of the time.”
Fox specifically details turnover margin during the playoffs, but the same holds true during the regular season as well. In 2011, teams that were plus-1 or better won 157 of 200 such games — a winning percentage of .785.
“No surprise, the Eagles were 3-0 when they won the turnover battle, and 3-6 when they lost. “
Here’s where Kulp and Fox lose me a little bit:
“While many would argue defense was this team’s biggest problem, we’ve maintained all along it was turnovers first and foremost. The Eagles had a 6-3 record and allowed 16.6 points per game when they gave the ball away two times or less, but were 2-5 and allowed 25.6 when coughing it up on three or more occasions. Still, plenty are not convinced the defense couldn’t have done more.
“To put those numbers in perspective, all 32 teams combined to win 17 out of 103 games when they committed three turnovers or more — a winning percentage of .159. In eight of the 17, or nearly half of them, the losing team was also on the hook for three-plus.
“Amazingly, the Eagles won two of the 17.
“As for the defense’s part in this, the league average was 29.4 points allowed. By comparison, it was 20.4 PPG when there were two giveaways or fewer. Interesting that the difference for both the Eagles and the entire NFL was exactly the same — nine points.”
However, the Eagles were actually superior to the rest of the league in overcoming turnovers. Whether they committed five turnovers or zero, Philly’s defense almost always allowed fewer points per game, and the club’s winning percentage was the same or better. See for yourself:
| TO | NFL | EAGLES |
| 5+ | 0-13 (.000), 34.4 PPG | 0-1 (.000), 31.0 PPG |
| 4 | 5-24 (.172), 32.2 PPG | 1-1 (.500), 25.0 PPG |
| 3 | 12-49 (.197), 27.0 PPG | 1-3 (.250), 24.5 PPG |
| 2 | 59-74 (.444), 22.6 PPG | 3-2 (.600), 16.8 PPG |
| 1 | 101-70 (.591), 20.1 PPG | 2-1 (.667), 20.3 PPG |
| 0 | 79-26 (.752), 18.0 PPG | 1-0 (1.000), 7.0 PPG |
| 3+ | 17-86 (.159), 29.4 PPG | 2-5 (.286), 25.6 PPG |
| 2- | 239-170 (.584), 20.4 PPG | 6-3 (.667), 16.6 PPG |
“There have been some accusations that we are cherry picking stats that support an agenda, but all we’re talking about here is points scored, and how it correlates with giveaways. Clearly the defense was fine when they weren’t being bludgeoned by turnovers, and in practically every instance, they were above average at keeping points off the board. This isn’t sorcery, folks, and there really is no disputing it.”
Okay, I get it… turnovers were a problem, but not the ultimate dagger relative to points allowed by the Eagles… and the Birds’ defense outperformed the rest of the league in general when it came to points allowed.
But the chart above doesn’t change the fact that everybody in this city saw this defense get rolled time and time again in the first 3 months of the season—whenever the Eagles needed a big-time stop, a big play or a big 4th-quarter performance, this defense rarely provided that.
Yes, in the Atlanta loss, the first three scores given up by the defense were set up by turnovers all starting on the Eagle side of midfield. In the loss to the Giants, the two second half NYG scores followed a failed 4th-and-1 and a Kafka INT. Both drives started around midfield. Both of these games also featured a redzone turnover by Vick.
But a better defense rises to those occasions more often than not. A better defense does not constantly crumble after its offense commits a turnover or gets stopped on a 4th-and-1 at midfield. Offensive turnovers and mistakes happen—but good defenses rise to the occasion.
I say they should have a stat equivalent to a turnover when your linebacker or safety is burned for big yardage by the opposition because they are exposed in a clueless position in a must-stop situation.
Such a stat would destroy any chart that correlates offensive turnovers with defensive failure. I would call this new stat a “burnover”… One defensive “burnover” would be equivalent to one offensive turnover… Each is as potent as the other for causing games to be lost in the NFL.
Add The Sports Daily to your Google News Feed!
