The Eagles’ ranked 16th in the NFL in points scored in 2016— 22.9 points per week. Maybe that’s the only offensive stat that really counts (although that number includes points scored by the defense, too).
Compare that number to the Final Four teams this year: Atlanta 33.9 PPG, Green Bay 28.0 PPG, New England 27.9 PPG, Pittsburgh 24.8 PPG.
To put it into simplistic analytic terms, the Eagles need to score at least 2 more points a game on average to be considered a contender.
The team stats below are just the tip of the iceberg. They don’t reveal the individual splits for offensive linemen, for instance. They don’t show blocks that were missed or passes dropped by receivers or blitz pressures that weren’t picked up by running backs. But what they do show is the overall production by the Eagles offense basically matched that of their opponents. In fact, we ran about 100 more plays than opponents during the course of the season, and we had almost 5 minutes of extra possession during each game. We even ended up with a plus turnover ratio. So what was missing to prevent us from getting at least two or three more wins—which may have had us in contention for a wild card?
Again, it’s an oversimplification— but if you traded just 7 of our 35 field goals for TD’s, you would be right there in the conversation of teams who scored at least 24 points per game. That’s just about where the Pittsburgh Steelers got to win their division. More pertinent, those extra points are just the extra cushion your defense needs to survive a close game—and we lost a couple of those.
| PHILADELPHIA EAGLES | OPPONENTS | |
|---|---|---|
| TOTAL FIRST DOWNS | 333 | 300 |
| FIRST DOWNS (RUSHING-PASSING-BY-PENALTY) | 114-192-27 | 89-177-34 |
| THIRD DOWN CONVERSIONS | 85/224 | 82/205 |
| FOURTH DOWN CONVERSIONS | 13/27 | 8/18 |
| TOTAL OFFENSIVE YARDS | 5,398 | 5,484 |
| OFFENSE (PLAYS-AVERAGE YARDS) | 1,076/5 | 973/5.6 |
| TOTAL RUSHING YARDS | 1,813 | 1,652 |
| RUSHING (PLAYS-AVERAGE YARDS) | 438-4.1 | 391-4.2 |
| TOTAL PASSING YARDS | 3,798 | 4,039 |
| PASSING (COMP-ATT-INT-AVG) | 380-609-14-6.2 | 333-553-16-7.3 |
| SACKS | 34.0 | 33.0 |
| FIELD GOALS | 35/41 | 28/33 |
| TOUCHDOWNS | 37 | 36 |
| TOUCHDOWNS (RUSHING-PASSING-RETURNS-DEFENSIVE) | 16-16-2-3 | 10-25-1-0 |
| TIME OF POSSESSION | 32:31 | 27:56 |
| TURNOVER RATIO | +6 | |
| PLAYER | ATT | COMP | YDS | COMP % | YDS/ATT | TD | TD% | INT | INT% | LONG | SCK | SACK/LOST | RATING |
|---|---|---|---|---|---|---|---|---|---|---|---|---|---|
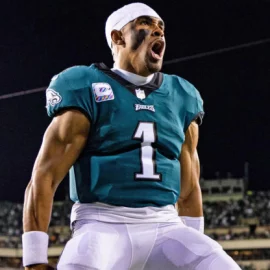
| Carson Wentz | 607 | 379 | 3,782 | 62.4 | 6.2 | 16 | 2.6 | 14 | 2.3 | 73 | 33 | 213 | 79.3 |
| Chase Daniel | 1 | 1 | 16 | 100 | 16 | 0 | — | 0 | — | 16 | 0 | 0 | 118.8 |
| Josh Huff | 1 | 0 | 0 | — | — | 0 | — | 0 | — | — | 0 | 0 | 39.6 |
| PLAYER | ATT | YDS | YDS/ATT | LONG | TD |
|---|---|---|---|---|---|
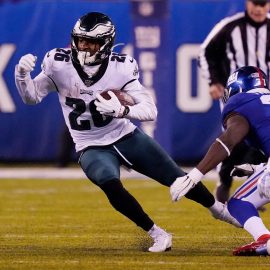
| Ryan Mathews | 155 | 661 | 4.3 | 30 | 8 |
| Darren Sproles | 94 | 438 | 4.7 | 25 | 2 |
| Wendell Smallwood | 77 | 312 | 4.1 | 19 | 1 |
| Carson Wentz | 46 | 150 | 3.3 | 17 | 2 |
| Kenjon Barner | 27 | 129 | 4.8 | 19 | 2 |
| Byron Marshall | 19 | 64 | 3.4 | 12 | 0 |
| Terrell Watson | 9 | 28 | 3.1 | 8 | 1 |
| Nelson Agholor | 5 | 14 | 2.8 | 5 | 0 |
| Josh Huff | 3 | 10 | 3.3 | 10 | 0 |
| Bryce Treggs | 2 | 7 | 3.5 | 4 | 0 |
| Donnie Jones | 1 | 0 | — | 0 | 0 |
| PLAYER | REC | YDS | YDS/REC | LONG | TD |
|---|---|---|---|---|---|
| Zach Ertz | 78 | 816 | 10.5 | 30 | 4 |
| Jordan Matthews | 73 | 804 | 11 | 54 | 3 |
| Darren Sproles | 52 | 427 | 8.2 | 73 | 2 |
| Trey Burton | 37 | 327 | 8.8 | 32 | 1 |
| Dorial Green-Beckham | 36 | 392 | 10.9 | 26 | 2 |
| Nelson Agholor | 36 | 365 | 10.1 | 40 | 2 |
| Brent Celek | 14 | 155 | 11.1 | 24 | 0 |
| Ryan Mathews | 13 | 115 | 8.8 | 27 | 1 |
| Josh Huff | 13 | 72 | 5.5 | 14 | 1 |
| Paul Turner | 9 | 126 | 14 | 41 | 0 |
| Wendell Smallwood | 6 | 55 | 9.2 | 18 | 0 |
| Kenjon Barner | 5 | 42 | 8.4 | 15 | 0 |
| Byron Marshall | 3 | 10 | 3.3 | 7 | 0 |
| Bryce Treggs | 3 | 80 | 26.7 | 58 | 0 |
| Carson Wentz | 1 | 7 | 7 | 7 | 0 |
| Terrell Watson | 1 | 5 | 5 | 5 | 0 |
| PLAYER | 1-19 A | 1-19 M | 20-29 A | 20-29 M | 30-39 A | 30-39 M | 40-49 A | 40-49 M | 50+ A | 50+ M |
|---|---|---|---|---|---|---|---|---|---|---|
| Caleb Sturgis | 0 | 0 | 12 | 12 | 12 | 12 | 11 | 7 | 6 | 4 |
| TOTAL | 0 | 0 | 12 | 12 | 12 | 12 | 11 | 7 | 6 | 4 |
| OPPONENTS TOTAL | 0 | 0 | 6 | 6 | 15 | 12 | 9 | 8 | 3 | 2 |
| PLAYER | PUNTS | AVG | TOUCHBACKS | IN 20 | LONG | BLK |
|---|---|---|---|---|---|---|
| Donnie Jones | 63 | 45.8 | 6 | 21 | 72 | 0 |
| TOTAL | 63 | 45.8 | 6 | 21 | 72 | 0 |
| OPPONENTS TOTAL | 61 | 46.3 | 4 | 18 | 66 | 1 |
| PLAYER | RETURNS | FC | YDS/RET | LONG | TD |
|---|---|---|---|---|---|
| Darren Sproles | 17 | 13 | 13.2 | 66 | 0 |
| Kenjon Barner | 2 | 0 | 11 | 22 | 0 |
| TOTAL | 19 | 13 | 12.9 | 66 | 0 |
| OPPONENTS TOTAL | 25 | 15 | 8.1 | 65 | 1 |
| PLAYER | RETURNS | YDS | YDS/RET | LONG | TD |
|---|---|---|---|---|---|
| Kenjon Barner | 9 | 277 | 30.8 | 61 | 0 |
| Wendell Smallwood | 9 | 261 | 29 | 86 | 1 |
| Josh Huff | 7 | 252 | 36 | 98 | 1 |
| Nelson Agholor | 5 | 92 | 18.4 | 27 | 0 |
| Byron Marshall | 2 | 36 | 18 | 23 | 0 |
| Darren Sproles | 1 | 19 | 19 | 19 | 0 |
| Paul Turner | 1 | 11 | 11 | 11 | 0 |
| Zach Ertz | 1 | 8 | 8 | 8 | 0 |
| TOTAL | 35 | 956 | 27.3 | 98 | 2 |
| OPPONENTS TOTAL | 38 | 712 | 18.7 | 34 | 0 |
The individual numbers reveal an offense that never really established a consistent go-to guy for TD pay dirt. The biggest mystery of all was the under-utilization of veteran TE Brent Celek—only 14 catches all year, and no touchdowns.
Finally today, this tidbit from Dave Spadaro at PE.com—-visions of Villanueva dancing in your head??—-
“A fifth-round draft pick in 2014 from Oregon, Taylor Hart has not distinguished himself much at all in three NFL seasons as a defensive tackle, playing in a total of 15 games, 14 of them in 2015, with the Eagles and San Francisco. When Hart comes back to the NovaCare Complex in the spring, he will try to make a name for himself as – an offensive tackle. The Eagles gave Hart some work late in the season on the scout team at offensive tackle and liked what they saw, enough that they’re going to see what he’s got in 2017 on that side of the football. Hart has length at 6-6, he’s a very good athlete and he’s got long arms. He was a first-team all-state offensive tackle in high school. Add Hart to the “project” department that includes Dillon Gordon, a converted tight end from LSU, working with line coach Jeff Stoutland.”
Add The Sports Daily to your Google News Feed!