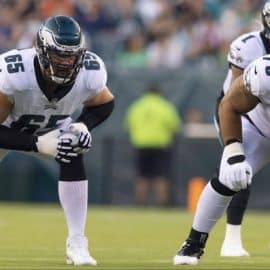
The official NFL stats rank the Eagles offensive line 14th overall in total effectiveness in 2016, which is far from horrible. But that ranking is a little deceptive because in effect the Eagles fielded two very unique lines this past season—-one with Lane Johnson at RT for 6 games, and one without Lane Johnson for 10 games.
Most of the offensive line problems that cropped up in 2016 were concentrated in the 8 games the Eagles lost when Lane Johnson was off the team. They were 5-1 when Johnson played.
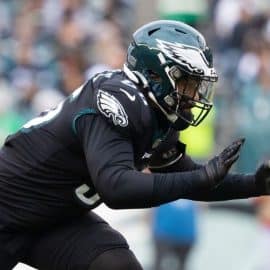
Alignment, assignment, count and technique—sporadic breakdowns in these fundamentals of line play too often buried the Birds in holes they could not dig out of.
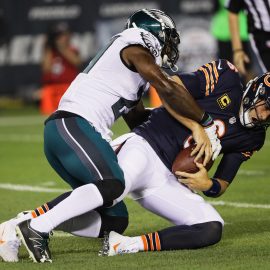
For example, the Eagles gave up 33 sacks and a whopping total of 98 QB hits. Compare that to the league-leading numbers of 18 sacks and 41 hits allowed by the massively talented Oakland Raiders line. (Maybe we should have signed Kelechi Osemele when we had the chance?)
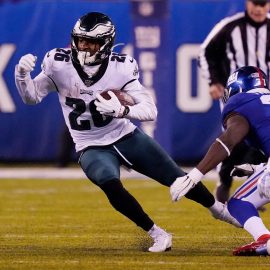
We were also too high in negative rushes, or running plays where yardage was actually lost. We had 26 negative rushes to the left side of the line; 9 negative rushes to the center of the line; and 17 negative rushes to the right side of the line. Again, comparing to the Oakland Raiders, their negative numbers were a mere 14 to the left, 11 to the center and 6 to the right.
The Dallas line (ranked 9th overall) put up numbers which are better than the Eagles line but not by the quantum leap factor the national media would have us believe. In fact, the Dallas line gave up 28 sacks and 69 QB hits—better than the Eagles but still pretty sloppy. Where Dallas set the standard was in their average of 4.8 yards per running play. Ours was 4.1, which again is not horrible but about a yard short of where we need to be if we are to claim our line is a superior bunch.
So there’s an overall picture of where our offensive line stands as a group heading into 2017. For now I will save the individual lineman stat breakouts for another day, or until I can find another analytic resource to compare to Pro Football Focus. PFF seems to hold a monopoly on individual lineman ratings, and I sometimes question their scientific method. For example, they have Baltimore’s Rick Wagner as one of the highest-rated right tackles in the league. Really?—I saw all his games in 2016, and when Marshal Yanda wasn’t next to him at RG, it was not always a pretty picture.
| Rush Total | Rush Left | Rush Center | Rush Right | |||||||||||||||||
|---|---|---|---|---|---|---|---|---|---|---|---|---|---|---|---|---|---|---|---|---|
| Rk | Team | Exp | Att | Yds | Avg | TDs | 1st | Neg | +10Y | Pwr | 1st | Neg | +10Y | Pwr | 1st | Neg | +10Y | Pwr | Sacks | QB Hits |
| 1 | Oakland Raiders | 402 | 434 | 1,922 | 4.4 | 17 | 35 | 14 | 21 | 73 | 45 | 11 | 16 | 52 | 17 | 6 | 6 | 60 | 18 | 41 |
| 2 | Pittsburgh Steelers | 345 | 409 | 1,760 | 4.3 | 13 | 39 | 9 | 20 | 100 | 22 | 6 | 4 | 71 | 36 | 11 | 27 | 56 | 21 | 56 |
| 3 | New York Giants | 231 | 398 | 1,412 | 3.5 | 6 | 33 | 11 | 11 | 75 | 17 | 12 | 9 | 67 | 23 | 11 | 10 | 44 | 22 | 64 |
| 4 | Washington Redskins | 262 | 379 | 1,696 | 4.5 | 17 | 37 | 12 | 21 | 78 | 14 | 8 | 6 | 56 | 37 | 12 | 17 | 81 | 23 | 80 |
| 5 | New England Patriots | 181 | 482 | 1,872 | 3.9 | 19 | 32 | 20 | 19 | 62 | 37 | 11 | 11 | 63 | 40 | 10 | 13 | 61 | 24 | 73 |
| 6 | New Orleans Saints | 405 | 404 | 1,742 | 4.3 | 17 | 35 | 12 | 14 | 50 | 21 | 3 | 4 | 82 | 49 | 9 | 19 | 81 | 27 | 70 |
| 7 | Chicago Bears | 296 | 380 | 1,735 | 4.6 | 10 | 53 | 16 | 28 | 71 | 12 | 1 | 7 | 100 | 28 | 15 | 17 | 86 | 28 | 73 |
| 8 | Tennessee Titans | 163 | 476 | 2,187 | 4.6 | 16 | 54 | 15 | 30 | 75 | 28 | 14 | 11 | 59 | 31 | 14 | 18 | 83 | 28 | 51 |
| 9 | Dallas Cowboys | 365 | 499 | 2,396 | 4.8 | 24 | 54 | 16 | 35 | 56 | 32 | 11 | 13 | 91 | 56 | 11 | 24 | 87 | 28 | 69 |
| 10 | Miami Dolphins | 290 | 405 | 1,824 | 4.5 | 14 | 38 | 17 | 22 | 67 | 14 | 7 | 6 | 30 | 38 | 27 | 28 | 83 | 30 | 93 |
| 11 | Houston Texans | 268 | 456 | 1,859 | 4.1 | 8 | 27 | 8 | 16 | 64 | 45 | 11 | 17 | 72 | 30 | 16 | 16 | 33 | 32 | 97 |
| 12 | Kansas City Chiefs | 231 | 412 | 1,748 | 4.2 | 15 | 35 | 19 | 18 | 57 | 33 | 11 | 13 | 61 | 18 | 14 | 11 | 63 | 32 | 68 |
| 13 | Baltimore Ravens | 339 | 367 | 1,463 | 4.0 | 10 | 28 | 20 | 16 | 62 | 18 | 6 | 8 | 86 | 33 | 12 | 17 | 70 | 33 | 77 |
| 14 | Philadelphia Eagles | 381 | 438 | 1,813 | 4.1 | 16 | 52 | 26 | 26 | 56 | 23 | 9 | 14 | 67 | 39 | 17 | 18 | 50 | 33 | 98 |
| 15 | Jacksonville Jaguars | 185 | 392 | 1,631 | 4.2 | 8 | 28 | 12 | 22 | 50 | 20 | 12 | 9 | 44 | 27 | 19 | 10 | 75 | 34 | 85 |
| 16 | Green Bay Packers | 288 | 374 | 1,701 | 4.5 | 11 | 36 | 14 | 21 | 36 | 14 | 5 | 6 | 50 | 40 | 18 | 22 | 62 | 35 | 76 |
| 17 | New York Jets | 204 | 418 | 1,802 | 4.3 | 10 | 35 | 14 | 20 | 69 | 36 | 10 | 15 | 73 | 25 | 15 | 14 | 83 | 35 | 95 |
| 18 | Tampa Bay Buccaneers | 196 | 453 | 1,616 | 3.6 | 8 | 30 | 17 | 15 | 60 | 23 | 24 | 12 | 38 | 27 | 14 | 8 | 50 | 35 | 109 |
| 19 | San Diego Chargers | 376 | 398 | 1,510 | 3.8 | 10 | 19 | 22 | 9 | 29 | 50 | 17 | 15 | 72 | 21 | 10 | 12 | 80 | 36 | 98 |
| 20 | Carolina Panthers | 251 | 453 | 1,814 | 4.0 | 16 | 34 | 7 | 21 | 45 | 32 | 14 | 10 | 76 | 33 | 17 | 16 | 88 | 36 | 93 |
| 21 | Detroit Lions | 197 | 350 | 1,310 | 3.7 | 9 | 17 | 20 | 9 | 67 | 27 | 9 | 13 | 67 | 32 | 19 | 13 | 47 | 37 | 79 |
| 22 | Atlanta Falcons | 481 | 421 | 1,928 | 4.6 | 20 | 38 | 16 | 18 | 47 | 14 | 7 | 6 | 50 | 56 | 26 | 27 | 79 | 37 | 106 |
| 23 | Minnesota Vikings | 246 | 380 | 1,205 | 3.2 | 9 | 23 | 17 | 10 | 44 | 25 | 15 | 7 | 47 | 18 | 13 | 7 | 50 | 38 | 104 |
| 24 | Denver Broncos | 203 | 410 | 1,484 | 3.6 | 11 | 23 | 9 | 14 | 50 | 31 | 11 | 13 | 50 | 22 | 22 | 15 | 56 | 40 | 100 |
| 25 | Cincinnati Bengals | 372 | 446 | 1,769 | 4.0 | 17 | 44 | 18 | 19 | 61 | 14 | 3 | 7 | 40 | 42 | 15 | 12 | 68 | 41 | 70 |
| 26 | Arizona Cardinals | 254 | 399 | 1,732 | 4.3 | 20 | 27 | 14 | 18 | 75 | 44 | 14 | 15 | 75 | 26 | 12 | 15 | 50 | 41 | 127 |
| 27 | Seattle Seahawks | 117 | 403 | 1,591 | 3.9 | 13 | 29 | 18 | 11 | 43 | 21 | 14 | 7 | 54 | 35 | 14 | 22 | 58 | 42 | 111 |
| 28 | Indianapolis Colts | 173 | 409 | 1,628 | 4.0 | 13 | 27 | 6 | 9 | 73 | 34 | 3 | 15 | 67 | 32 | 13 | 14 | 44 | 44 | 128 |
| 29 | Buffalo Bills | 388 | 492 | 2,630 | 5.3 | 29 | 51 | 22 | 31 | 56 | 35 | 10 | 14 | 62 | 59 | 24 | 31 | 60 | 46 | 85 |
| 30 | San Francisco 49ers | 305 | 458 | 2,019 | 4.4 | 15 | 39 | 18 | 23 | 73 | 33 | 17 | 13 | 69 | 44 | 17 | 24 | 67 | 47 | 82 |
| 31 | Los Angeles Rams | 204 | 375 | 1,252 | 3.3 | 9 | 19 | 14 | 8 | 40 | 28 | 18 | 12 | 58 | 21 | 13 | 6 | 73 | 49 | 95 |
| 32 | Cleveland Browns | 299 | 350 | 1,712 | 4.9 | 13 | 29 | 15 | 18 | 75 | 21 | 3 | 12 | 100 | 33 | 28 | 24 | 57 | 66 | 140 |
- Exp = Combined career starts for the two guards, two tackles and center on team with the most starts in the current season.
- Rush 1st = Rushing first downs.
- Rush Neg = Rushes for negative yards.
- Rush +10Y = Rushes for 10 or more yards.
- Rush Pwr = Percentage of rushes on 3rd or 4th down with 2 or fewer yards to go that achieved a first down or TD. Also includes rushes on 1st-and-goal and 2nd-and-goal from the opponent’s 2-yard line or closer.
Add The Sports Daily to your Google News Feed!