The more we learn about controlled offensive zone entries, the more we realize that they’re a massive driver towards shot-attempts.
This stands to reason even via the eye test. When teams dump the puck into the zone, they’re conceding possession and giving the other teams defense an opportunity to regain possession of the puck.
Conversely, when teams carry the puck across the offensive blueline, they can create scoring plays that wouldn’t have previously existed had they run a dump-and-chase strategy in the neutral zone.
If you want to see how the data correlates between controlled zone entries and shot-attempts, take a look at the article I linked above by Jen Lute Costella – you’ll see a crazy correlation between these two elements of the game.
I wanted to do a post about the Penguins zone entries to show what the data says about the Penguins system and how it looks on paper and in video. My initial idea for this came courtesy of one of the most hard-working individuals in the Microstats community, Corey Sznajder.
Corey has undertaken a massive stats-based task in his All Three Zones project. As a part of his work, Corey has been tracking zone entries game by game (and series by series for the playoffs) and has given the hockey community tons of insight into what’s going on in the world of zone entries. This data, without the work of people like Corey and his colleagues (link dump at the end of this post), wouldn’t be accessible for the rest of us.
When I told Corey my idea for this post, he was willing to go back and track the Penguins results through the early part of the season. For that, I cannot thank him enough. This post would lack a lot of substance if it wasn’t for his willingness to partake in it.
The Premise for this analysis.
As I mentioned above, it was Corey’s work with zone entry data in the playoffs that initially got me interested in the Penguins on-ice structure in terms of gaining the offensive blueline.
One thing that stood out to me looking back at the Cup run was the Penguins ability to consistently gain the zone with a higher level of regularity than their opponents. In addition to that element, the Penguins also seemed to generate more shots per entry than their opposition did as well. I wanted to look at what element of the Penguins structure was responsible for that data.
This post starts by going back and looking at the data from the playoffs that initially intrigued me in the first place. Let’s start with the breakdown of the Penguins six game victory against the Washington Capitals.
Corey’s tracking found that the Penguins were able to carry the puck in more than the Capitals did and, in addition to that, they were able to generate more shot-attempts off their carry-in’s than the Capitals were. Here’s a summation of his data from the above post, which I highly recommend you read as a compliment to this article:
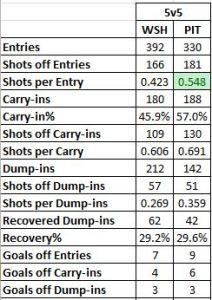
As you can see above, while the Capitals might have boasted more overall entries into the offensive zone (which aligns with the overall shot-attempt data in the series), the Penguins were able to carry the puck in more than the Capitals and generate more shot-attempts off their carry-in’s as a whole.
This data wasn’t just congruent with the Washington series, however. It also carried over to the Tampa Bay conference final as well.
Corey’s breakdown noted that the Penguins “carved up” the Lightning even moreso than they did the Capitals. Read his breakdown of that series here.
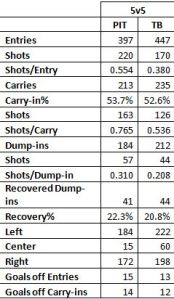
Again, as you can see, the Penguins are taking their controlled zone entries and turning them into shot-attempts at a superior rate.
I think it’s important to mention here that goals are the result of a lot of noise and randomness. Players cannot control their own shooting percentage and it fluctuates throughout the year. If you can’t control your shooting percentage, the best way to control the game and push towards scoring goals is to A: limit your opponent’s opportunities and B: shoot the puck as much as possible.
It became clear to me that the Penguins were doing something systematically that was enabling them to control the neutral-zone and generate a high amount of chances once they gained the offensive blueline. Using video from this year’s games, we’re going to establish what that element of their play is and why they’ve found so much success in not only carrying the puck into the zone, but generating shot attempts off the rush.
Structure
Mike Sullivan and Dan Bylsma both had the same mantra in regards to attacking defenses: “get north.” While they both shared in the same goal, the way they go about accomplishing it could not be more different. The Bylsma version of the Penguins relied on the stretch pass to get the puck up ice as quickly as possible. In the Sullivan era, this goal is accomplished via two avenues: 1. Speed and 2. Puck Support.
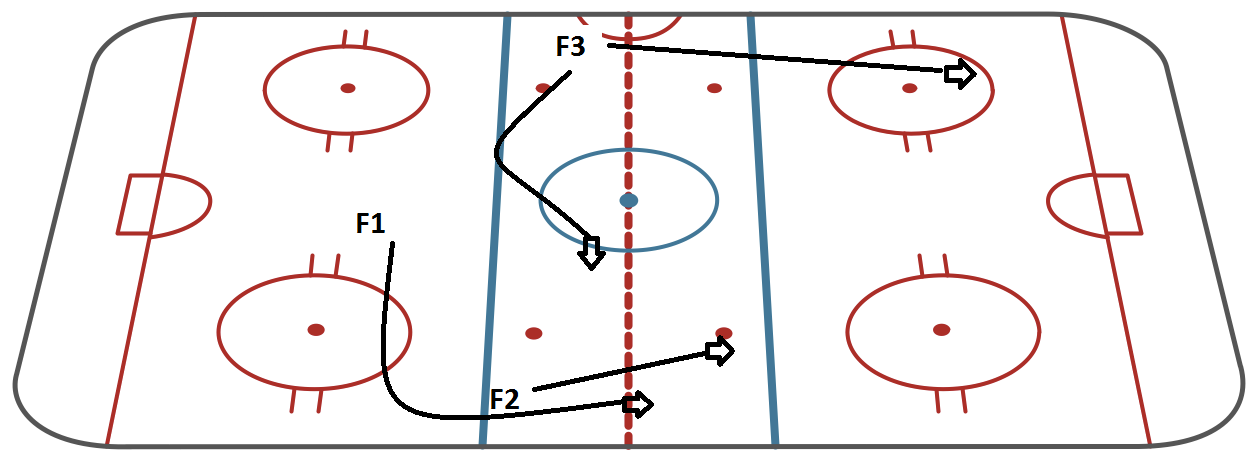
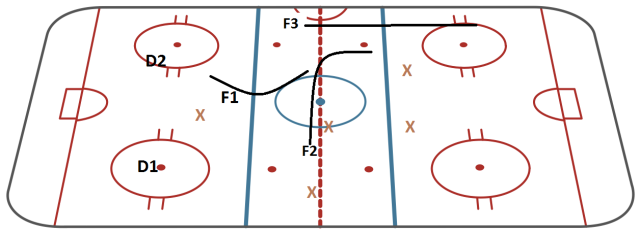
Let’s take a look at this structure on paper:
Let’s take a look at the defined roles within this structure and what the goal of this alignment is.
For starters, the Penguins run this breakout “by committee” – what I mean by that is that the roles of the F1, F2, and F3 can be filled by any player at any given time. If a defenseman has the opportunity to jump into the play, he can fulfill any role in this structure. The Penguins are an extremely fluid hockey team. When the breakout starts, players run this system regardless of where they’re supposed to be located by position.
Let’s start with the F1 in the diagram above. This is the player that leads the charge offensively. The F1 is, more often than not, the player that ends up with the puck heading across the blueline. This player starts a deep swing from within the offensive zone to gain speed as the breakout progresses towards the offensive blue line.
The F2 in these scenarios is the puck-support part of the equation. Often times, this player receives the outlet pass from the defenseman ahead of the play, and uses wall-passes and touch-passes to get the puck to the streaking F1.
The F3 is the late man into the play. The F3 is often positioned alone, ahead of the play, in an extremely wide position. This accomplishes several goals of the breakout. It keeps the defense honest and backed up. It prevents the defense from collapsing along the wall and smothering F1 and F2. It also provides a support option. As you see from the diagram above, the F3 will either drive wide and spread the defense out, or he’ll quickly converge on the zone entry and provide a quick passing option for a shot on entry.
Video Breakdown
One theme I think you’ll see in here throughout these video breakdowns is the following elements:
- Puck Support
- Creating space via driving to the net
- Deception via trailers and drop passes
Let’s take a look at how this manifests itself in video:

As I mentioned above, The F1/F2 in these sequences often play touch-and-go through the neutral zone to create a large gap of operation between themselves and the opposing defense.
Compare this video to the diagram at the top. The breakout pass is made to Scott Wilson, the F2, aligned at a stop along the wall. Crosby, who came through the neutral zone from a deep swing in his own end, takes a quick touch-pass from Wilson to gain speed and cross the offensive blue-line. The F3, Patric Hornqvist, drives the net and backs the defense up.
The Penguins gain a shot-attempt and create chaos in this instance by getting Crosby to gain the line with speed. That enables Scott Wilson, who fulfilled his touch-pass duty in the offensive zone, to sneak late into the play and get a shot-attempt with traffic in front.
It’s worth mentioning here that one of the reasons the Florida defense is so backed up in this instance is a result of Patric Hornqvist sitting up ice waiting to join this play and drive them back. The Florida defense has to recognize Hornqvist as a threat via breakout pass even if this play isn’t intended to drive through him specifically.
Here’s another great example of the Penguins top line finding space:

Again, the Penguins head up ice in tandem with the F3 wide of the play.
Wilson makes the same touch-pass to Crosby as he did in the first example, however, this time Florida has Crosby’s lane to the offensive zone cut-off. Scott Wilson breaks off from Crosby, and now you have two separate touch-passes creating space and allowing Wilson to drive wide into the zone with speed.
A critical element to this zone entry is, once again, the presence of Patric Hornqvist. His push up ice, wide of the play, backs up the Florida defense and creates the space that eventually allows Scott Wilson to enter the zone.
This entry isn’t the textbook layout that we illustrated above, but the puck support we talked about earlier is what creates this clean zone entry and shot-attempt. Quick recognition of a disadvantageous situation by Sidney Crosby enables Scott Wilson to gain the zone because of his puck-support role in this breakout.
In the next clip, we get a great sense of how adaptability works in the neutral zone. The following clip is taken from the Penguins recent Cup Final rematch against the San Jose Sharks.
The Sharks are obviously painfully familiar with this structure courtesy of a six game series this spring. They look to take away the Penguins F2 in this sequence. The Sharks put the middle portion of their 1-2-2 right on top of Chris Kunitz, who would normally be filling the same role that Scott Wilson filled in the above examples.
Kunitz’ role here is to provide the neutral-zone touch pass that should spring Evgeni Malkin into action across the blueline. Bryan Rust is situated as the F3, at the top of the blueline away from the play.
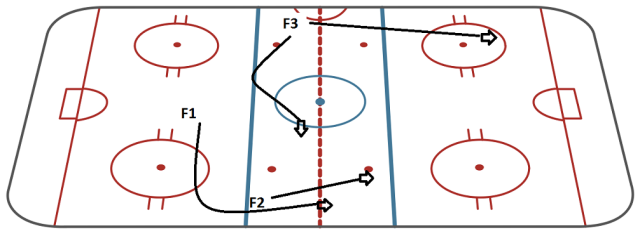
Because the Sharks stack up on Kunitz, Malkin calls an audible and completely switches this play from one side of the ice to the other. Here’s how it looks on paper:
You’ll see in the below clip that Malkin starts this breakout by swinging through the neutral-zone to gain speed. But as soon as the defense realizes that Kunitz isn’t available in his normal position, the puck immediately goes to Malkin and he switches this breakout from one side of the ice to the other.

The Penguins still walk away with a zone entry and a shot-attempt because of a quick audible called by the defense.
We could go on with the video for hours, but I hope you get the general premise here. We’ve established the following about the Penguins breakout:
- A deep option (a decoy, if you will) exists to push back the opposing team’s defense and create space.
- Puck support in the neutral zone is paramount. Touch passes allow puck carriers to enter the zone with a considerable amount of speed.
- The Penguins excel at bringing late trailers into the play that often generate the shot-attempt.
- Adaptability allows the Penguins to shift this structure in the middle of the neutral zone and still achieve the same result.
In looking at Corey’s data through the early part of this season, we can see that the Penguins still out-entry and out-attempt their opponents even in games that they lose or are perceived to have not played well in. In their 4-0 loss to Montreal this year, the Penguins were still able to out-gain the Canadiens in regards to zone entries.
In their overtime loss to Colorado, the story was the same.
The Penguins certainly have the personnel to pull this type of approach off seamlessly. I hope that this post will enable all of you to not only understand the structure behind the Penguins approach, but to also be able to enjoy it live as you watch games from your home or the arena.
Shoutout to the following people for their work in this area:
Sean Tierney – who did a ton of work on zone entries for the Penguins
Corey Sznajder – for his work in the All Three Zones project
Ryan Stimson – for his work on the forechecking and passing projects
Jen LC – for her awesome work over the years
Gus Katsaros – for all his systematic breakdowns
Add The Sports Daily to your Google News Feed!