The Columbus Blue Jackets benefited from many excellent offensive performances in 2016/17.
Cam Atkinson was one of the top scorers in the league, lighting the lamp 35 times. Josh Anderson put up 16 goals at 5v5 while mostly playing on the third line. Nick Foligno bounced back from his disastrous 2015/16 campaign with 26 goals. Sam Gagner notched a career high in points as a fourth liner and powerplay specialist. Let’s not forget the emergence of Zach Werenski on the back-end, flirting with franchise highs in points from the blueline in his age 19 season. And hey, the team made the play-offs!
Perhaps rightfully, many are suggesting that the team was not as good as their 2016/17 season won/loss record indicated, and are picking the Jackets as leading candidates for regression in 2017/18. But at the other end of the spectrum, players like Brandon Dubinsky, Boone Jenner, and Matt Calvert all greatly under-performed expectations. So, while the talk of regression has definite merit, if these latter players can return to career norms, maybe the offensive damage can be somewhat minimized.
Then again, the departures of Brandon Saad, Gagner, William Karlsson, and Scott Hartnell mean that 28% of the team’s 168 5v5 goals in 2016/17 are no longer around. That is a significant chunk! Of the many questions to be asked of the 2017/18 iteration of the Jackets, one sprung to mind immediately: where are these lost goals going to be made up?
LOST GOALS
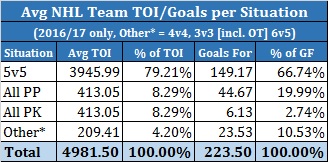
In 2016/17, five-on-five goals made up an average of 66.7% of a team’s over-all scoring for the entire season, and the average team played 79.2% of their total hockey at 5v5. Therefore, 5v5 scoring is going to be our main focus.
In the aggregate, the Blue Jackets have lost 21 5v5 goals from their 2016/17 team, with 47 goals leaving, being replaced by 26. That may not seem like a lot over the course of a season, but a net loss of 21 goals would have moved the Blue Jackets from 6th in the NHL, with 168 5v5 goals, to 16th, with 147 – just ahead of Anaheim. Those 21 goals lost can be looked at as costing the team four to five wins over the course of a season, which puts them into a battle for a lesser play-off spot, depending on who those additional losses come at the hands of.
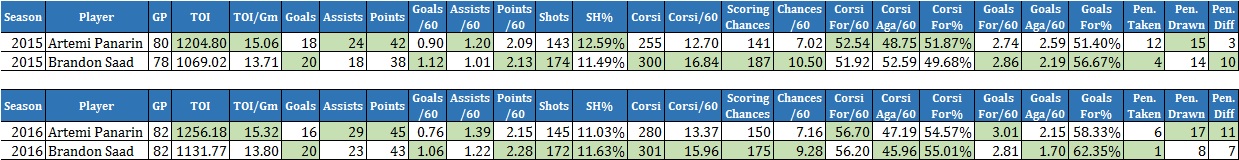
The team has high hopes for Artemi Panarin to make up the majority of the lost goals. Panarin is an adept five-on-five scorer and a dangerous powerplay weapon, but does not bring as much raw 5v5 scoring as the man he will replace, Brandon Saad. Over the past two seasons at 5v5, Panarin’s goal output, and goals-per-60 rate was below Saad’s, although their points-per-60 rate was similar. That said, Saad was a far larger contributor to scoring chances than Panarin in both raw and a per-60 rate. To add to this, Panarin played quite a bit more at 5v5 than Saad, and it will be interesting to see if that continues under John Tortorella, who has generally favoured a more balanced approach to ice time distribution. Panarin will be looked at to improve on his over-all numbers, while potentially seeing less ice time. That’s a tall task.
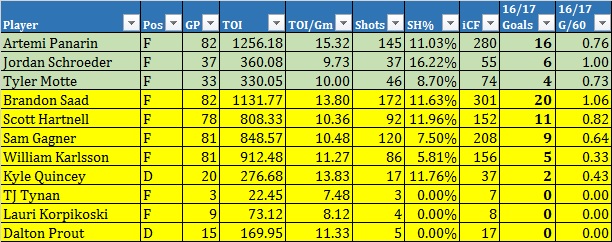
Outside of the Panarin/Saad swap, the team has countered the loss of Hartnell, Gagner, and Karlsson by acquiring cheap depth with some potential. Tyler Motte (acquired in the Saad trade) and Jordan Schroeder (acquired for low-level prospect Dante Salituro) will look to win permanent roster spots, and the team will be placing faith in some untested youngsters to battle during training camp for the right to fill the rest of the roster out at a fraction of the cost of their predecessors.
MAKING UP THE GOALS
To make a somewhat-educated guess into what the goal output of the Blue Jackets may look like in 2017/18, I took a look into a couple of different metrics.
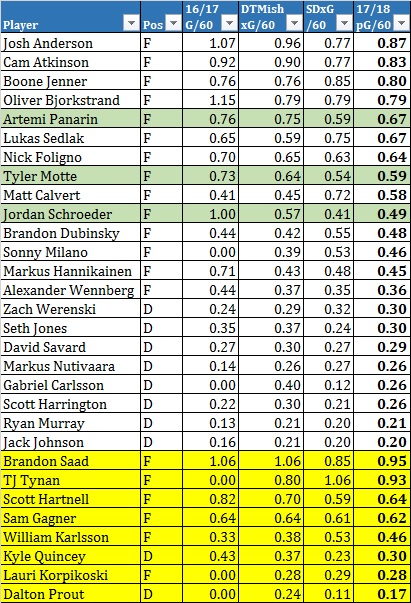
First, I ran a simple exercise to determine a player’s expected-goals-per-60 from 2016/17 (and tested it in previous seasons). I took high-, medium-, and low-danger shot data from Natural Stat Trick, and calculated a player’s expected goal output based on his high-/medium-/low-danger Corsi attempts, multiplied by the league-average Corsi shooting percentage for each type of shot. After removing any player with less than 100 minutes of TOI in each of the seasons, the results were reasonably predictive of future scoring when compared with the following season’s goals-per-60 rate. Using 2014/15 and 2015/16 data, the r2 correlation between this “Shot Danger Expected Goals-Per-60” (SDxG/60) and the next season’s goals-per-60 output was 0.4475.
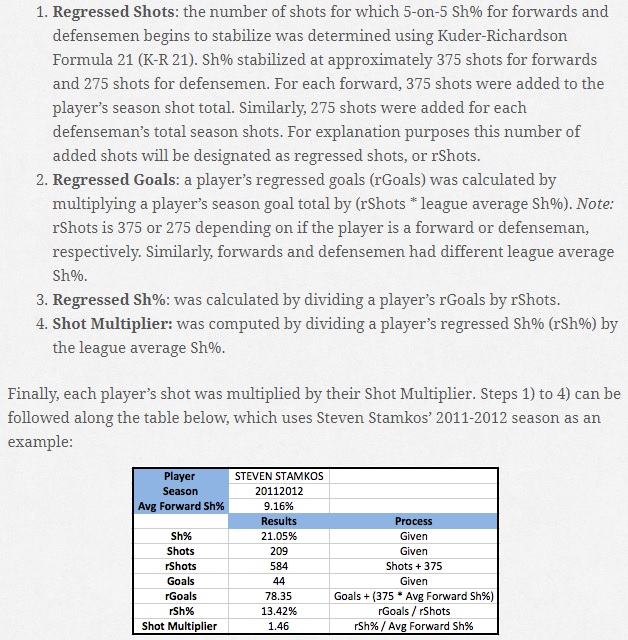
The second exercise was to use a series of calculations from @DTMAboutHeart in the first part of his article “Expected Goals Are a Better Predictor of Future Scoring Than Corsi, Goals”. I should note that this method is likely outdated and has been replaced by something far more complex, but I didn’t want complex – I wanted quick and easy. I followed steps one through four for every player, except I used league-average Corsi shooting percentage instead of regular shooting percentage. As I did not have x-and-y shot location data handy, this was as far as I went. In correlating with next season’s goals-per-60, the r2 was a bit less than my “Shot Danger Expected-Goals-Per-60”, at 0.3942.
Next, I took the per-60 outputs from each metric, and performed the ultra-scientific process of… averaging them. After doing this, the r2 correlation with the next season’s goals-per-60 improved to 0.5487 – better than either of the metrics performed individually. Upping minimum TOI from 100 to 300 improved the correlation to 0.6777, and upping further to 500 improved it to 0.7415. Not precise, but it gets me where I need to go for this exercise.
SQUAD GOALS
Now that we have goals-per-60 projected, I set to use a mix of guesswork and opinion to determine TOI and games played. This way, we can use our projected goals-per-60 to predict a raw goal total. This, of course, is highly subjective, as it’s nearly impossible to predict injuries, usage increases/decreases, etc with any real accuracy. With that caveat out of the way, let’s figure this out.
To gauge projected games played, I took the required total of games played for each position during an 82 game season: 984 for forwards (12*82), and 492 for defenders (6*82), and used each player’s three year average of games played, modifying the outcome based on my own whims. Prospect Pierre-Luc Dubois was added to the mix, and his numbers are based on his projected role of third line centre. I also added two players, helpfully named “Other F”, and “Other D”, which will make up assorted minor league call-ups who otherwise weren’t listed. Each one of the “Other”s filled out the remaining games. In determining TOI/gm, I used 2016/17 TOI/game of each player and adjusted based on the limited information we have available as to how the roster may look come the beginning of the season. For an example of the changes I made, we’ll use Artemi Panarin. Panarin had 15.31 TOI/gm in Chicago last season, but there’s almost no way that continues in Columbus, as the top CBJ forward in TOI (Nick Foligno) had barely over 14 minutes per game. So, I dropped Panarin down to Foligno’s level. A few other changes were made, as well, but nothing too drastic.
Since Pierre-Luc Dubois has no basis for NHL projections, I took the league average in projected goals/60 and multiplied it by 80%. Hopefully, this isn’t being too optimistic – because this is a relatively modest projection. For the “Other” categories of forward and defenders, I took league average and multiplied by 50%.
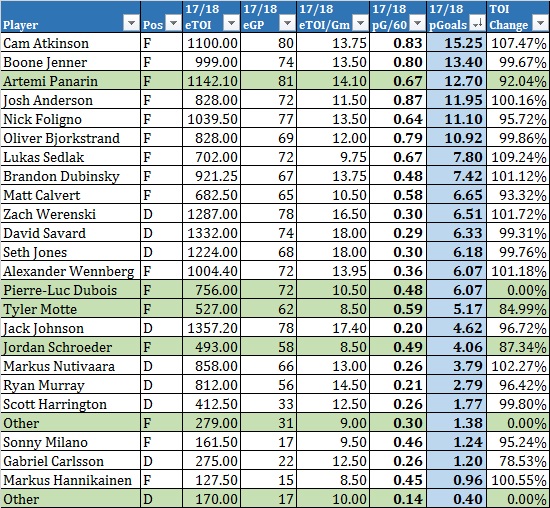
With these numbers, you can see that I am assuming Motte, Schroeder, and Dubois make the team and play full-time roles, while Motte, Schroeder, Milano and Hannikainen’s expected-goals-per-60 over their minimal NHL samples will end up being repeatable. But other than Dubois and the “Others”, there is no projecting from me whether goal scoring rates, or expected goal rates will rise or fall.
These totals show the Jackets reaching 155.74 expected goals for 2017/18, a drop of just over 12 from their previous season total. This would still have them slightly above the 2016/17 league average of 149.17 goals for, and would have had them in a tie for 12th in the NHL in 16/17. A team scoring like this likely will be in contention for a play-off spot, assuming their defense and Vezina-winning goaltending don’t also suffer major lapses. But that’s another story entirely.
– Jeremy
Follow me on twitter, @307x.
Add The Sports Daily to your Google News Feed!