
What if I told you that there is a defenseman that has scored 358 points in his last 465 regular season games (0.77 points per game) and has scored 57 points in his last 76 playoff games (0.75 points per game)?
What if I also told you those point totals are 6th and 2nd most, respectively, among NHL defensemen since the start of the 2010-11 season?
Or that regular season points per game total of 0.77 is 2nd best among NHL defensemen (that have played at least 50 games), dating back to the start of the same 2010-11 season (where #1 is possibly the greatest d-man to ever play the sport)?
Or how about that postseason 0.75 points per game is the most among NHL defensemen that have played at least 25 playoff games since 2010-11?
Would you consider those numbers to be objectively good? Would you want that defenseman (referred to as Player X from here on out) on your ice hockey team? Would you also want to know who that hypothetical player is (if you haven’t already figured it out)?
Join us here at The Pensblog for the first installment of…
Who’s. That. Penguin?!
Note: All stats herein are at even-strength via NaturalStatTrick.com or Corsica.hockey unless otherwise noted.
Player X 2017-18 Season vs. Career
On-Ice Stats
By most accounts, this defensemen has had himself a great career since he really became the guy at the start of the 2010-11 campaign, while still being a solid contributor since breaking into the league in 2007.
By some accounts, this 2017-18 season was the worst of his career. But how much was that really the case?
As it turns out, this Player X’s underlying numbers this year were almost entirely better than his career numbers across the board.
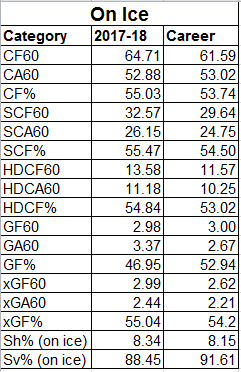
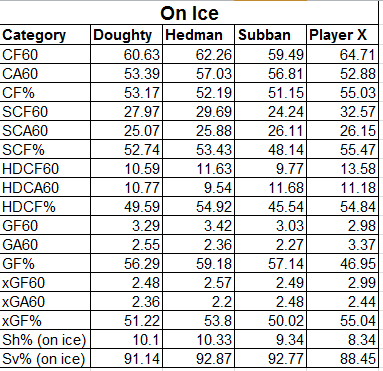
When looking at his overall percent shares, Player X saw his shares of shot attempts for (CF%), scoring chances for (SCF%), high danger scoring chances (HDCF%), and expected goals for (xGF%) all take a jump up over his career numbers. What this means is that when Player X is on the ice, his team is controlling the puck more than it’s not and moving it in a positive direction. What it also means is that this past season, these positive events were more frequent than have been over the course of his career.
In fact, Player X saw a big uptick in shot attempts for (per 60 minutes of ice time) while also limiting more shot attempts at his own goal compared to that of his career. Similarly, he saw his team generate nearly 3 more scoring chances, 2 more high danger chances, and a slight 0.37 expected goals bump while he was on the ice. For a player touted as an offensive defensemen, these are traditionally things you would hope to see.
Despite this, Player X was still viewed as having a down, or even bad, year. Why might that have been?
For starters, we may get a better idea as to why that was when looking at his scoring chances against and high danger chances against. While his shot attempts against were down from his career average, scoring chances and high danger chances against were up. Similarly, because expected goals takes shot quality into account, his expected goals against took a hit as well. So, while he was driving play forward at a much higher clip, he didn’t suppress quite as well as he has over his career (though the margins are very slim, all things considered).
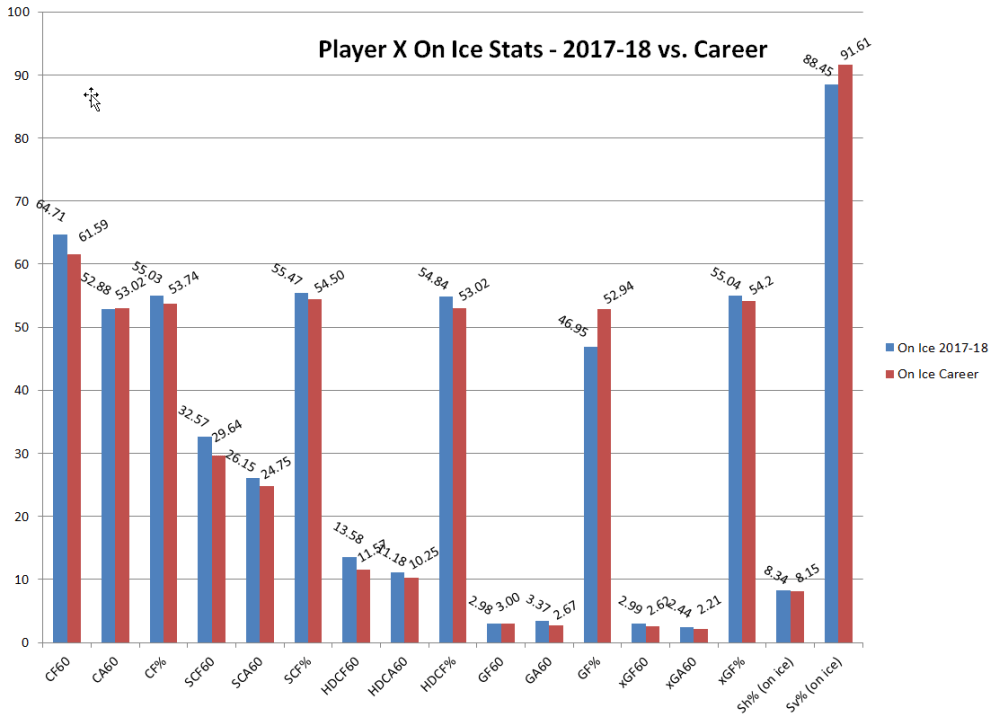
The biggest thing that stands out, though, is the disparity in his goals for share. Over the course of his career, of the goals that are scored when he is on the ice, 53% of them have been in his team’s favor. This past year, though, saw that drop to 46.95%, meaning he was on the ice for more goals against than goals for. However, his on-ice shooting percentage and on-ice goals for (per 60 minutes of ice time) stayed virtually the same, signalling the issue was in goal prevention, similar to what the Golden Knights are going through against the Caps currently.
In fact, his on-ice save percentage dropped from a moderately normal career 91.61% down to 88.45%. The dead horse will continue to get beaten all offseason, but simply put: If Player X is backed up by slightly better goaltending, particularly in October and November when it was at its absolute worst, the story of his season may have a different narrative surrounding it.
Individual Stats
Although players are sometimes only as good as their teammates, it’s worth looking at what Player X did individually this season vs. his career.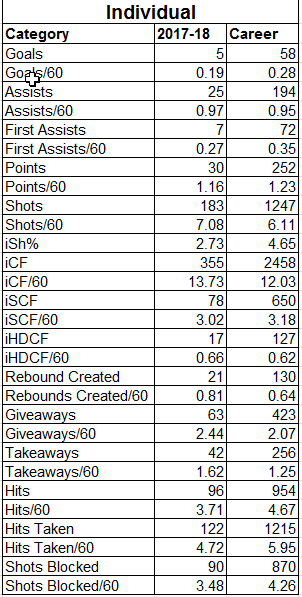
Some early things to consider here. Player X saw a slight drop off in goals, primary assists, and points per 60 minutes of ice time compared to that of his career. However, as we’re all well aware, rotten luck for his team was evident early in the season. For large stretches in October and November, they couldn’t get a goal…nor could they stop one.
To that point, Player X’s individual shooting percentage this season was nearly a full 2 percentage points below his career average, despite getting an additional shot on target per 60 minutes of ice time and attempting nearly 2 more shots than his career average. That Sh% drop accounts for a loss of about 3-4 goals scored, or an additional 0.11 goals per 60 minutes. Luck sometimes just doesn’t go your way in this sport.
In addition to shooting the puck more, Player X created more rebounds per 60 minutes this season than he has in previous seasons, despite individually getting about the same amount of scoring chances and high danger chances as he has.
Reasonably, regression will take hold of both him and his teammates and if he keeps shooting the puck and advancing it the way that the underlying numbers suggest he did this year, the puck will start going in again.
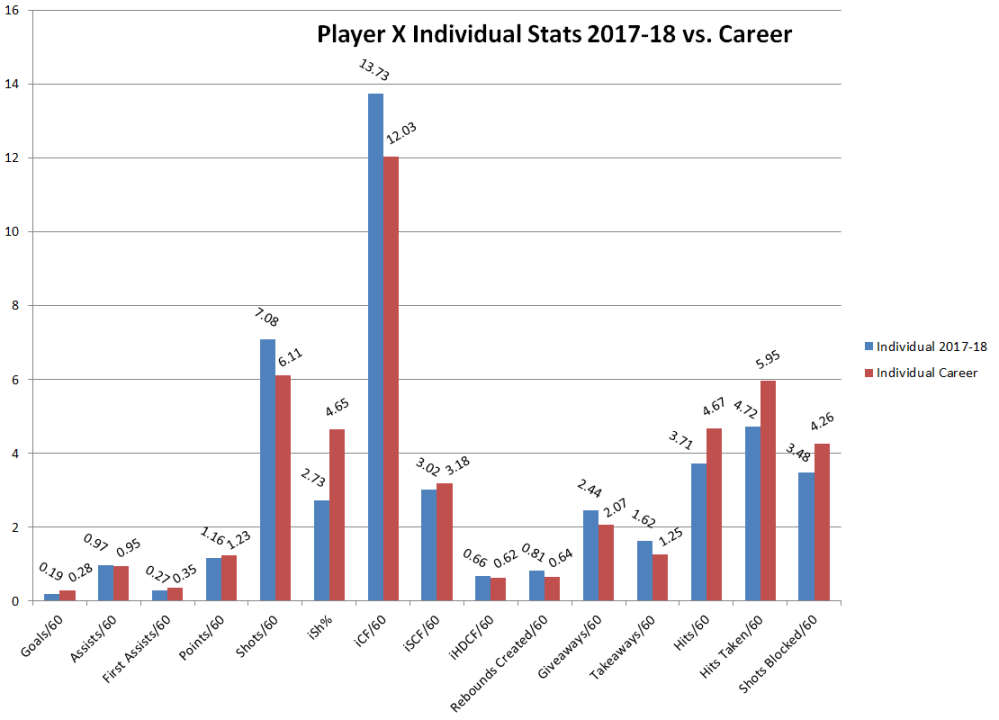
However, with every positive, there will always be a negative. One thing of note is that he was credited with 0.37 more giveaways per 60 minutes of ice time this year vs. his career (more on this later). Traditionally, this a black cloud that has hung over his head for a decade, but should hopefully be cleared by some rays of sunshine in a moment. But, on the flip side, he was credited with the same number of extra takeaways, which is objectively good.
Player X 2017-18 vs. 2017-18 Norris Finalists
On-Ice Stats
Save for a few bounces that seemed to not go his way, we can agree that Player X’s 2017-18 campaign was actually better than he may get credit for based on the above.
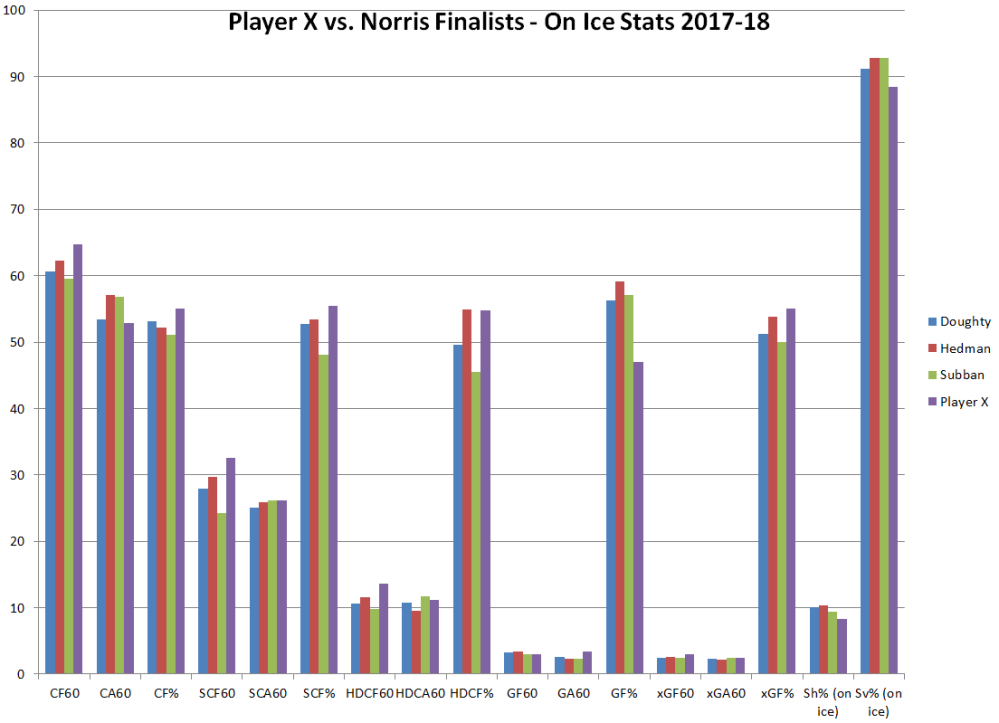
But how does he stack up against his peers? Let’s take a look at what he did this year compared to that of the Norris Trophy Finalists.
Drew Doughty, Victor Hedman, and PK Subban were deemed to be the 3 best defensemen in the NHL this season. Each player was brilliant in their own way, setting the stage for voters to rob Erik Karlsson of what should’ve been his like 6th Norris.
As it turns out, Player X at even strength was, across the board, in line with what these three did this past season based on the underlying numbers.
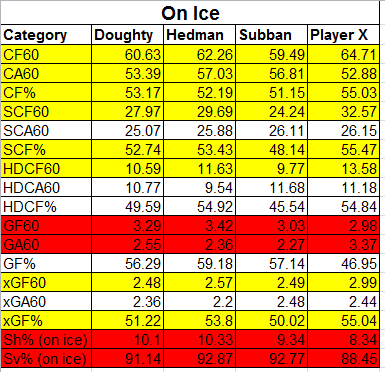
In fact, Player X was better than the 3 Norris Finalists in 8 of the 17 categories evaluated and 2nd best in another (by just 0.08%).
What’s more, of those 9 categories, Player X not only out-performed the Norris Finalists, but also a large swath of the NHL’s defensemen.
Note: Ranking below is based on a pool of 136 defensemen that played at least 1000 minutes)
| Category | Rank |
| Shot Attempts For (per 60) | 12th |
| Shot Attempts Against (per 60) | 9th |
| Shot Attempts For Share | 7th |
| Scoring Chances For (per 60) | 3rd |
| Scoring Chances For Share | 8th |
| High Danger Chances For (per 60) | 3rd |
| High Danger Chances For Share | 19th |
| Expected Goals For | 1st |
| Expected Goals For Share | 13th |
The difference, again, seems to come down to a little bit of luck at both ends of the ice.
With Player X defensively, it seems his goalie had more of a down year than he did when you look a little deeper. Player X gave up the least amount of shot attempts per 60 minutes than the other 3, while all 4 of them limited scoring chances at the same rate and were pretty close in the high danger realm as well (Hedman a little better, Subban a little worse). Similarly, all 4 came in pretty much dead on top of one another in expected goals against. But looking at each players’ on-ice save percentage, it tells a different story and certainly explains why Player X saw his goals against per 60 nearly a full goal higher than his peers.
Again, a bounce back year in 2018-19 from one of the best young netminders on Earth and returning to form changes the story completely surround Player X.
And, while Player X seemed to get the short end of the luck stick there, it showed up offensively too. To that point, Player X saw his expected goals and actual goals for come in together. Plus, a 8.34 on ice-shooting percentage is pretty respectable. But with Doughty, Hedman, and Subban, the story was a little different. Each of the 3 Norris candidates saw a big jump in actual goals for from their expected goals for, resulting in above average on-ice shooting percentages. This is in no way Player X’s fault and instead an illustration of how much more things went the other three’s way this year than Player X’s.
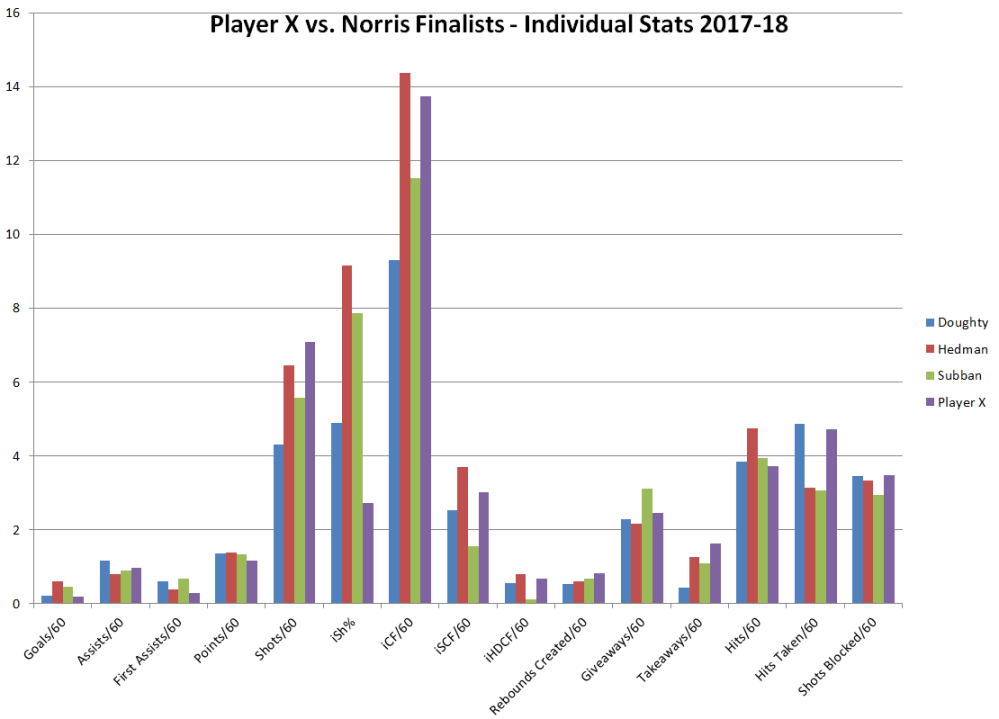
Individual Stats
The final exercise left is to take a look at how each of the 4 players we’re looking at stack up against one another in the same individual categories.
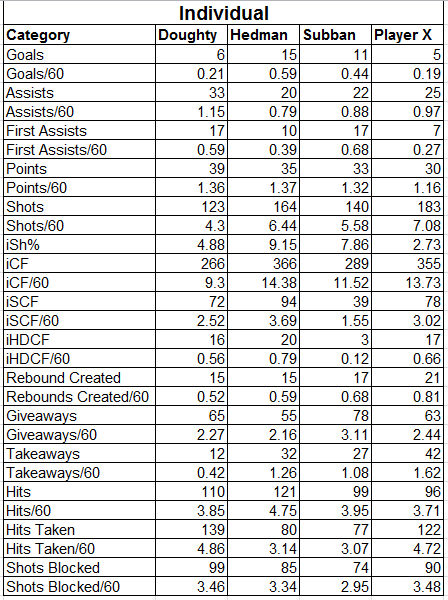
When taking a look at these numbers, the full picture starts coming together. In the non-point based stats, Player X is right in the thick of things. He shot the puck more than the others, created more rebounds, and wasn’t far off Hedman’s pace in individual shot attempts, scoring chances and high danger chances. He also found himself with more takeaways and shots blocked per 60 minutes of ice time. And, despite what you’ve been told, the wheels didn’t fall off here with his giveaways. In fact, among the 136 d-men that played at least 1000 minutes this season, Player X ranks 39th in most giveaways per 60 minutes. The other three ranked 47th (Doughty), 52nd (Hedman), and 9th (Subban).
It’s as if guys that see the ice more and have the puck on their sticks the most are going to inevitably turn it over more. Weird.
But while the wheels didn’t fall of there, it was the the finishing that did. Out of the 4, Player X far and away had the worst individual shooting percentage. On the whole, out of the same 136 d-men, Player X’s abymal Sh% was the 24th worst, hanging out in the same company as Brent Burns and Dustin Byfuglien. With a normalized shooting percentage back at his career average, Player X sees himself not far away from PK Subban’s even strength goal total.
As we also saw above, Player X didn’t see quite the same on-ice goal output as his peers despite finding himself in their company with his point total and assist total. The fact remains that with a little bit of different luck (and a little bit of regression), you should hear a different narrative surrounding Player X’s season storyline in a year’s time if he does a lot of the same things next year that he did this year.
So who is Player X?
You’ve probably figured it out by now, but…..

It’s Kris Letang.
And, despite the overarching narrative being that he had a “bad” season because a handful of anecdotal mistakes in the postseason, Letang kept up with the 3 Norris Trophy finalists almost entirely across the board.
All this after coming back from a serious neck injury. In itself, that is wildly impressive. Particularly with Kris Letang, you have to take some of the bad with all of the good that he brings and as we’ve seen, he brought a lot of good this past season.
Now just imagine what he’ll do with a full offseason to heal and prep.
Add The Sports Daily to your Google News Feed!