Much has been made of the Pittsburgh Pirates pitching philosophy to utilize the fastball, particularly in an era where the rest of the league is reducing their reliance on fastballs, in favor of more breaking pitches.
Since 2015, starting pitchers league wide have reduced their reliance on the fastball every year, starting out at 56.7 percent in 2015, down to 53.8 percent this year. In that same timespan, the Pirates’ starters have seemingly taken the opposite approach, utilizing the fastball 60 percent or more of the time over all 4 seasons.
The most frequently used example of pitchers reducing fastball usage in favor of breaking pitches, in Pittsburgh at least, has been Gerrit Cole, who reduced his fastball usage by about 5 percent this season over last, and increased his cumulative usage of his curveball and slider by about 10 percent. The implication is that Cole’s success this season is directly linked to this change in pitching strategy.
The problem with only using successful examples like Cole, no matter how drastic the change in performance, is that it ignores any possible downsides. For instance, while Cole may be grabbing headlines with his performance this season, there could be any number of other pitchers who tried to make this same change and ended up with a corresponding decrease in performance.
What is needed instead is a quantitative approach, using broader data, rather than a qualitative approach, like comparing individual pitchers. To this end we can use a mathematical tool known as game theory to find the optimal pitch usage, based on each individual pitcher’s actual pitching results.
The benefit to using this approach is that we’re optimizing each individual pitcher’s approach, based on their unique set of abilities, rather than assuming a strategy that is working for one pitcher should work for any other pitcher, regardless of their respective abilities. As a clear example of this; we really shouldn’t take a player with a plus fastball and good curveball, like Cole, and compare it to someone with an average fastball and a rarely used curveball, like Trevor Williams. The differences in skillsets between these two pitchers are obvious, so comparing their pitching approaches is rather pointless.
Due to the complex nature of this problem, this article will be heavy on the math, deriving how game theory arrives at the optimal strategies. There will be very little focus on the actual analysis of any pitchers. If you’re more interested in the specific recommendations for particular pitchers, keep an eye out for part two of this series where I take a look at the Pittsburgh Pirates’ starting pitchers using the framework created in this article.
Building the Model
To engage in any kind of game theory model, there must be payoffs to the players for any given choice that they make. In baseball the payoffs are runs, or more generally, run expectancy changes. For instance, a single with no one on and no one out isn’t worth much in and of itself, it is only worth something if the next few batters can get him home. What that single does do, however, is increase the likelihood of a run scoring, thus the payoff to the batter is the increase in that likelihood of scoring, or the increase in run expectancy. A pitcher’s payoff is the exact opposite of the batters, each increase in run expectancy for the batter is a cost to the pitcher, and each out that costs the batter runs is a benefit to the pitcher.
What is the value of a strike?
Similarly, each ball thrown is worth something to a batter since it gets him closer to a walk and it squeezes the pitcher to pitch to throw more hittable pitches to the batter; each strike costs the batter something because it gets him closer to a strikeout and it forces the batter to be more defensive in the ensuing pitches. However, that exact value of each of those depends on the count that it is thrown in, for instance a ball thrown in a 3-1 count is worth a lot more to the batter than a ball thrown in an 0-2 count.
In order to find this run value for strikes and balls in each count, I utilized Dan Meyer’s work on Dynamic Run Values for throwing a strike or a ball in each count. I highly recommend reading that article as it provides a rather clever way of establishing these values. The upshot is that we can use the wOBA of plate appearances that contain each ball-strike count to determine the run value of throwing a strike or a ball. Using data for all NL pitchers this season, the resulting table looks like this:
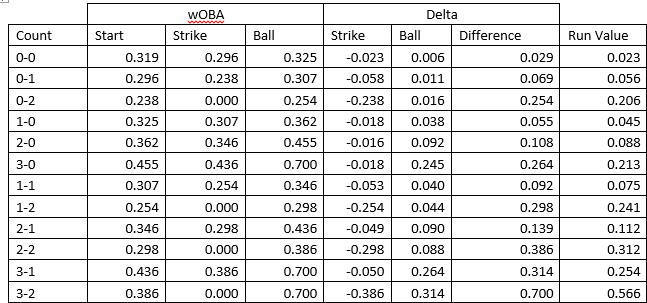
The way to read this table is, for instance, a ball in a 0-0 count, gives the batter 0.023 additional run expectancy, while a strike costs them 0.023 runs. The run value for a pitcher is the exact opposite of the batter’s, such that a strike benefits the pitcher by 0.023 runs and a ball costs them 0.023 runs.
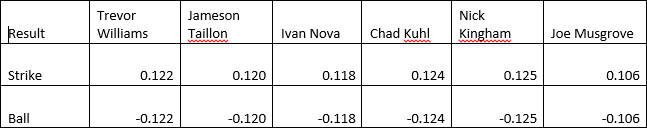
The next step is to find the average run value of a strikes and balls for each of the Pittsburgh Pirates’ starters independent of the count. To quote Meyer, “arriving at a singular, context-neutral run value is as simple as taking the mean weighted by the number of pitches in that count”. In other words, if we take the number of pitches that, for instance, Jameson Taillon threw in 0-0, 0-1, 2-1, etc. counts, multiply that by the run value for each of those counts, then divide by the total number of pitches, we arrive at each player’s marginal run value of a strike and the marginal value of a ball. This gives us the following context neutral value of balls and strikes for the Pirates’ starters (note: Joe Musgrove and Nick Kingham have the smallest samples of pitches this season, so use their numbers should be taken with some caution):
Players and strategies
Before we continue, we have to talk about what each player’s strategy set is, or what options the players can choose between, and who they’re playing against. In the pitcher’s case their strategy set is simply the pitches they throw, so for instance Trevor Williams throws a four-seam fastball (FF), a changeup (CH), a sinker (SI), and a slider (SL); mathematically we’d write Williams’ strategy set as {FF, CH, SI, SL}. The pitcher’s opponent is, somewhat obviously, the batter, who has two strategies, swing and don’t swing, which can be written as {Swing, Don’t}.
Now let’s talk about payoffs. For any pitch out of a pitcher’s strategy set, their run expectancy payoff depends on if a batter is choosing to swing or not, so there are two different payoffs to the pitcher, depending on the batter’s choice (in the batter’s case there are 4 different payoffs, given their choice of swinging or not, depending on which of the 4 pitches Williams elects to throw). The pitcher’s payoff if the batter decides to swing, is the probability of a swinging strike * their run value of a strike + the probability of contact * the average run value of batted balls against that pitch. The pitcher’s payoff if the batter doesn’t swing is the probability of a strike * their strike RV + the probability of a ball * their ball RV.
This is a zero sum game, meaning anything that the pitcher receives, the batter loses, and vice versa, so the batter’s payoffs in these cases are just the negative of the pitcher.
Payoff Tables
After deriving those 4 different probabilities, as well as the run value against each pitch type for each individual pitcher, we can finally calculate our payoffs and do a bit of game theory. Below are each of the starting pitcher’s payoff tables versus the average batter they have faced this season.
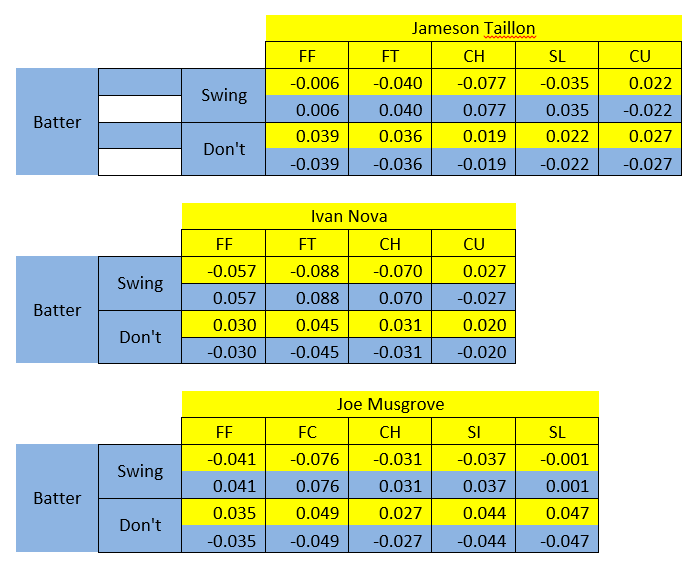

Taking Nick Kingham’s payoff table as an example, the way to read it is that if Kingham choses to throw a slider and the batter chooses not to swing, Kingham gets a payoff of 0.047 runs and the batter receives a payoff of -0.047 runs on average. Were the batter to choose to swing instead, Kingham would have received a payoff of -0.017 runs and the batter gets 0.017 runs on average, and so on for every combination of pitcher and batter choices.
With these payoff tables in hand, we can now start doing some game theory, to determine which pitchers are maximizing their effectiveness and which are pitching less efficiently. That analysis will begin in Part 2 of this series, coming later this week!
Add The Sports Daily to your Google News Feed!