
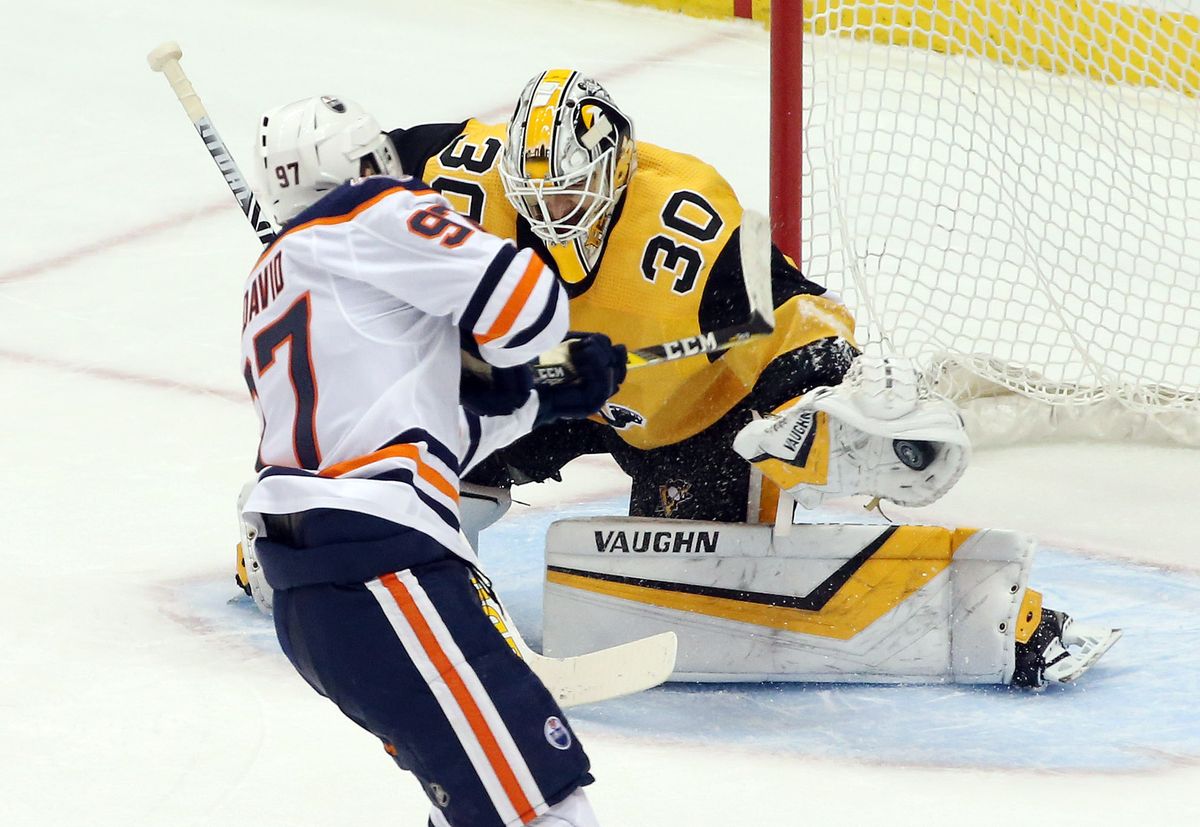
CHARLES LECLAIRE/USA TODAY SPORTS VIA REUTERS
On December 15th, Matt Murray returned from a month-long stint on IR, making 38 saves in a 4-3 overtime against the LA Kings.
Since returning from injury, Murray has been nothing short of spectacular. In fact, just over a month ago, we took a look at just how good he had been in the 8 games after his return compared to that of his first 11 of the season.
Since then, Murray has played an additional 9 games, including his previous two, where he’s stopped 88 of the last 90 shots (.978 SV%) he’s faced in wins over the Flyers and the Oilers. This coming after missing one practice, one game, and backing up DeSmith in another before returning against the Flyers, riling up the locals waiting to bring out their “injury-prone” narratives.
Nevertheless, Murray returned to the ice and returned right back to form.
And, because he’s now played 17 games since December 15th, we have a large enough sample size to take a look at how Murray stacks up against the league’s top netminders since his coming back to really appreciate (again) just how great he’s been lately rather than looking just at his performances now compared to his performances at the start of the season.
So let’s do that thing.
As mentioned above, since returning from his trip to IR, Murray has been brilliant in his 17 starts. Heading into Wednesday night, he was 12-4-0 in 16 games, posting a 2.18 GAA and .935 SV%.
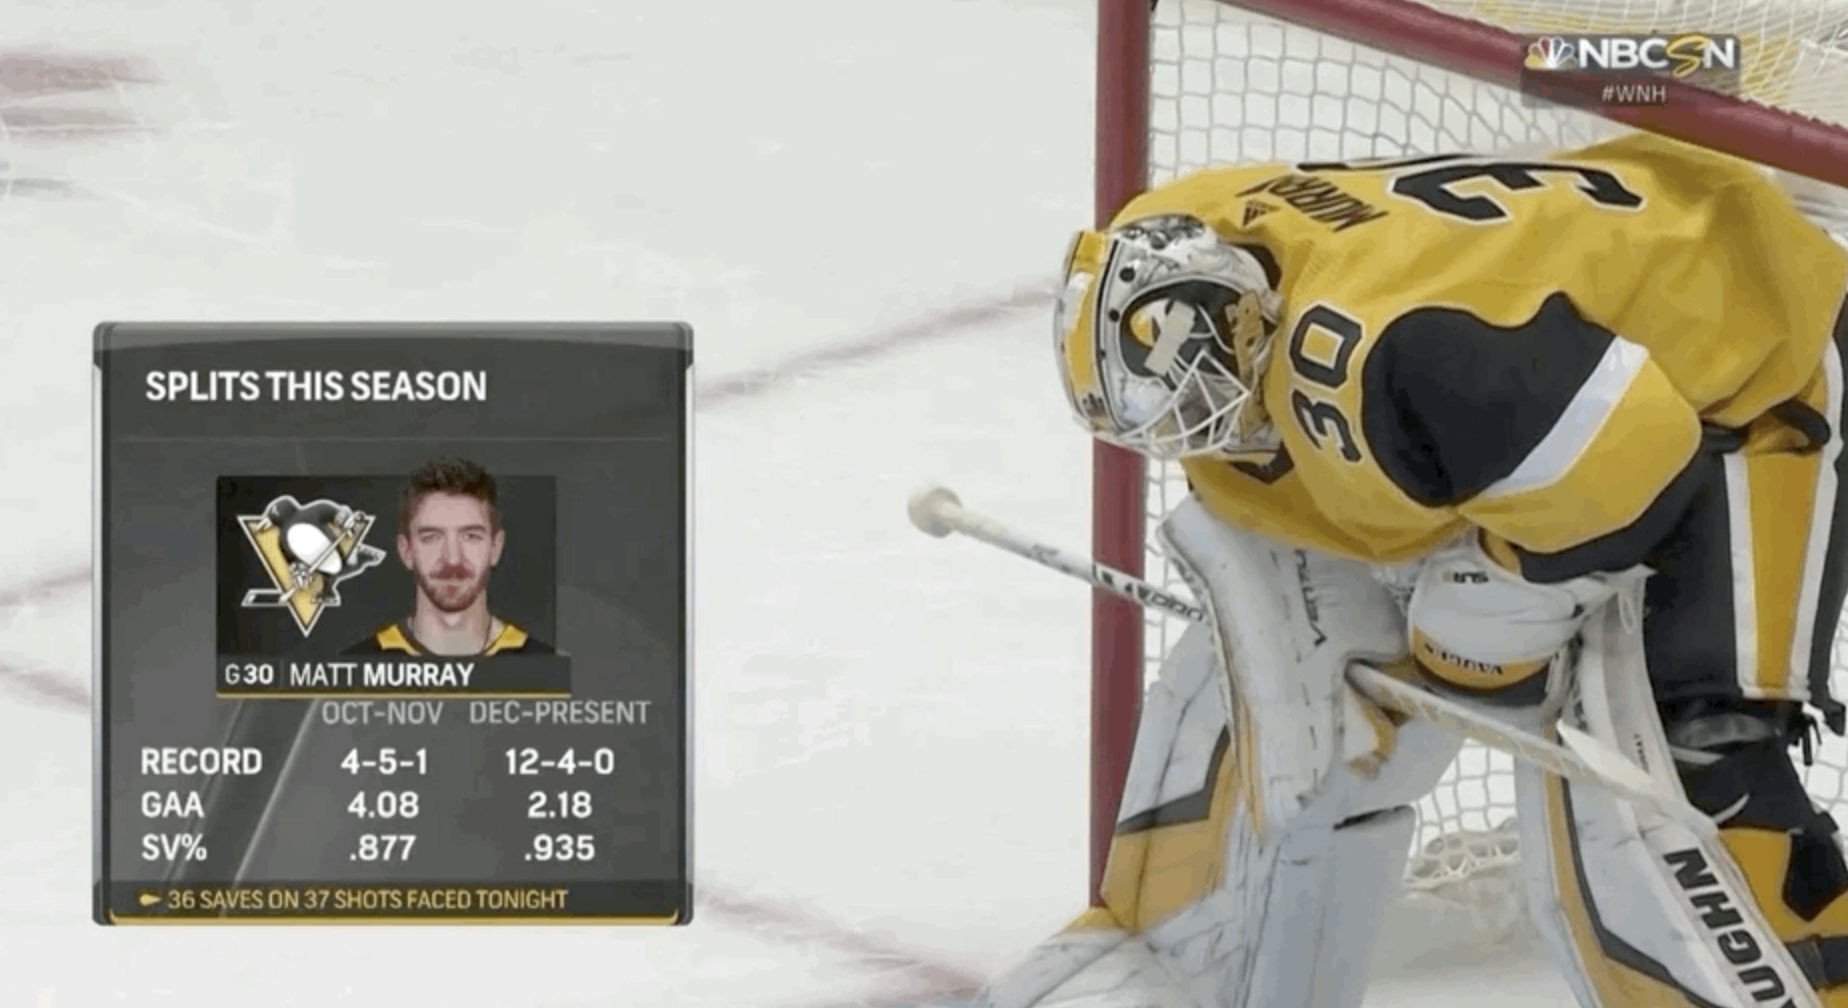
After Wednesday’s win over the Oilers, we saw his save percentage jump up to .938, GAA drop to 2.11, and record move to 13-4-0 since December 15th. Below, you’ll see exactly where Matt Murray stacks up among the 41 goaltenders that have played a minimum of 10 games since 12/15/18 in the basic statistics at all strengths of play, via NHL.com.
| Qty. | Rank | |
| Games Started | 17 | 16th (tied) |
| Minutes Played | 1022:26 | 14th |
| Wins | 13 | 3rd (tied) |
| Save Percentage | .938 | 4th |
| Goals Against Average | 2.11 | 6th |
| Shutouts | 2 | 5th (tied) |
Only Martin Jones and Andrei Vasilevskiy have won more games (14) since Murray’s return than Murray and Robin Lehner.
Only Andrei Vasilevskiy (4), Thomas Greiss (3), Sergei Bobrovsky (3), and Jordan Binnington (3) have supplied more shutouts than Murray’s 2.
And Murray’s .938 SV% has only been bested by just 3 other goaltenders: Thomas Greiss (.948 in 11 games), Robin Lehner (.943 in 17 games), and Juuse Saros (.942 in 11 games). Murray does, however, find himself .005 ahead of 6th best Carey Price and .013 ahead of 10th best Tuukka Rask, for context.
(Side note: just how crazy good have the Islanders goaltenders been?)
These are some obscene numbers, but still won’t tell you the full story of just how good he’s been. For that, we head over to Natural Stat Trick for the full story.
5-on-5
From here, let’s take a look at how Murray stacks up against goaltenders that have played a minimum of 300 minutes at 5-on-5 since December 15th, a pool of 51 goaltenders.
Note: All stats from here on out are accurate prior to the start of games dated 2/14/19.
| Qty. | Rank | |
| Minutes Played | 832:00 | 11th |
| Shots Against Per Hour | 34.76 | 2nd most |
| Save Percentage (total) | .944 | 6th |
| High Danger Shots Against Per Hour | 7.64 | 33rd |
| High Danger Save Percentage | .858 | 12th |
| Medium Danger Shots Against Per Hour | 8.37 | 18th |
| Medium Danger Save Percentage | .914 | 28th |
| Low Danger Shots Against Per Hour | 16.15 | 3rd |
| Low Danger Save Percentage | .966 | 1st |
| Goals Saved Above Average | 11.76 | 1st |
| Goals Saved Above Average Per Hour | 0.85 | 5th |
If you’ll remember back to the November 30th post comparing Murray, DeSmith, and Jarry, you’ll notice something that jumps out immediately here with respect to the location of the shots Matt Murray is facing. Prior to his stint on IR, Murray was seeing 10.52 high danger shots against per hour of ice time at 5v5, 7.63 medium danger, and 13.15 low danger. The Penguins, quite simply, were not doing much to help Matt Murray out in that regard.
Since then, they’ve gotten things together a bit more in terms of the location of the shots on goal and scoring chances allowed.
To that point, since his return, no goalie in that pool of 51 goaltenders has seen more shot attempts directed at him per hour of ice time than the 66.49 Matt Murray has. Only Collin Delia in Chicago has seen more unblocked attempts directed at him per hour (49.56 vs. Murray’s 48.53). Delia’s 38.77 shots against per hour also outranks Murray’s 34.76, too.
In spite of all of that, the Penguins have actually allowed slightly fewer scoring chances against per hour (28.53 then, 27.69 now) and high danger scoring chances against per hour (13.41 then, 10.6 now) since Murray returned in December versus his first 11 games of the season. Still, that number of 27.69 scoring chances against is 11th most and the 10.6 HD scoring chances against are 22nd most of that pool of 51 goaltenders.
Yet, even with seeing that uptick compared to the league and seeing just over 2 more shots at 5v5 per 60 minutes of ice time than he did prior to his injury, he’s actually facing just under 3 fewer high danger shots against. He’s found himself stopping nearly 86% of those high danger shots now, 12th best over that stretch. He also sees the most low danger shots against now, solidifying the idea that the Penguins are doing much better now at limiting teams than they were in October and November. Murray still needs to stop those shots and has done exactly that, allowing just 1 low danger goal since his return.
But perhaps what is most impressive is his Goals Saved Above Average, which is the measurement of goals saved versus the league average. In other words, if you were to put an arbitrary league average goalie X in goal to face the same shots, how many actual goals would Murray save compared to that theoretical goaltender X.
Since December 15th, not a single goaltender in the league has saved more goals above average than Matt Murray’s 11.76. Adjusting that per hour of ice time, his 0.85 GSAA ranks him 5th.
That means that if a game was played at 5v5 for the entire 60 minutes, Matt Murray will have likely saved the Penguins from conceding a goal at some point compared to that of a league average goaltender. If we were looking for something to tell us just how much Murray has helped to bail out the Penguins as of late, look no further than this.
To put this into perspective, of those 17 games that he’s played since coming back from his November injury, 6 of them have ended with a goal difference of just 1 or 2. In those games, Murray is 5-1-0. Saving 11.76 goals above the average (or nearly 1 more than the average every 60 minutes) plays a role in those decisions.
What’s also noteworthy is how much his Expected Save Percentage (which, much like expected goals, factors in shot quality, among other items), has grown this season.
In his first 11 games of the season, Murray saw his actual 5v5 SV% sit at a dismal 0.895, while his Expected Save Percentage sat at 0.912. Considering all of his games this season to date, his Expected Save Percentage has moved to a cool .923 (27th best of 73 NHL goalies that have played 200+ minutes at 5v5), while his actual 5v5 SV% for the season sits at .927, 21st best of that same pool of goaltenders (via Corisca Hockey). To see that sort of uptick after such a tumultuous and torturous start to the year is impressive. To see him now looking to break into the top 20 is also impressive.
penalty kill
So if Murray has been a godsend at 5v5, what about his results on the penalty kill?
There’s the old adage that your goalie has to be your best penalty killer in this sport. It makes sense: a penalty kill’s success is rated based upon goals allowed per opportunities against. Goaltenders are tasked with preventing goals and if they do that, the penalty kill will succeed.
As of 2/14/19, the Penguins PK sits at an 82.2% success rate, 8th best in the league, despite having killed every penalty in a game just 5 times in the last 11 games, giving up 9 goals on 30 opportunities against (70% kill rate) and having gone 5 straight games without a 100% over that stretch.
They have, however, killed off 13 of their last 15 penalties (86.67%), including netting 3 shorthanded goals over that period.
[For further reading on how the PK defensemen are performing, our former Pensblog Boy Jesse Marshall busted some narratives over at The Athletic last week (TL;DR: Kris Letang – Good//Jack Johnson – Bad).]But we’re here to talk about Matt Murray stopping shots, right? So let’s do that thing, looking at goaltenders that have seen a minimum of 30 minutes of penalty kill time on ice since 12/15/18 (49 goalies).
| Qty. | Rank | |
| Minutes Played | 88:49 | 9th |
| Shots Against Per Hour | 44.58 | 39th |
| Save Percentage (total) | .909 | 9th |
| High Danger Shots Against Per Hour | 7.43 | 49th |
| High Danger Save Percentage | .818 | 28th |
| Medium Danger Shots Against Per Hour | 11.48 | 37th |
| Medium Danger Save Percentage | .882 | 21st |
| Low Danger Shots Against Per Hour | 24.99 | 13th |
| Low Danger Save Percentage | .946 | 16th |
| Goals Saved Above Average | 2.84 | 5th |
| Goals Saved Above Average Per Hour | 1.92 | 10th |
Since 12/15, only 8 goaltenders have seen more shorthanded ice time than Matt Murray. What’s interesting, though, is that Murr has actually seen the 11th fewest shots on goal on the penalty kill of these 49 goaltenders. That’s a trend that’s echoed in both the high and medium danger rate of shots on goal per hour of shorthanded ice time. You can see, too, that the Penguins have done a remarkable job for Murray in keeping opposing powerplays from getting shots in high scoring areas of the ice. What’s more, they’ve managed the 14th fewest shot attempts against (88.48), 8th fewest unblocked shot attempts against (62.14), 5th fewest scoring chances against (34.45), and fewest high danger scoring chances against (8.11) per 60 minutes of shorthanded ice time with Murray in goal.
So, you might be asking yourself why, if he’s facing so few shots from in close, is Murray in the middle of the pack in terms of his location-based save percentages?
Well, consider this: out of the pool of 49 goaltenders, the average high danger save percentage sits at .811, the average medium danger save percentage is .851, and the average low danger save percentage is .907. Matt Murray is well above the average in each of the 3 categories.
To really illustrate this, we need to look no further than his Goals Saved Above Average again here. His raw count of GSAA of 2.84 is fifth most of those 49 goaltenders, while his per hour rate of 1.92 is 10th best. And, though he finds himself in the middle of the pack in terms of HDSV%, he’s actually only given up 2 high danger goals against on the penalty kill (on 11 shots), bringing his high danger goals saved above average per 60 minutes of PK ice time to 0.06, which is fine. As is his 0.29 medium danger GSAA and his 0.85 low danger GSAA.
In other words, from all 3 danger areas, he’s performing above average across the board on the penalty kill. When the PK in front of him is as good at limiting high quality looks as the Penguins PK is, slightly above average is all you need from your goaltender.
With all that being said, we can see that the results are tangible and quantifiable now that we have a much larger sample size to work from: Matt Murray is back.
We’ll have to revisit this in April once the regular season finally plays out and we know where the Penguins stand for the postseason, but as it stands right now, it’s easy to reach the conclusion that Matt Murray has been one of the best goaltenders on the planet since returning in December.
To say that he’s regained his Stanley Cup winning form would probably be the world’s biggest understatement, too.
But he has and the Penguins are frankly a better team because of it. Anything else is just noise.
Add The Sports Daily to your Google News Feed!