Does the NHL have a return policy?
Because right at the end of Monday’s Trade Deadline, GMJR pulled the trigger on getting two defensemen after Kris Letang and Brian Dumoulin left Saturday’s Stadium Series game in Philadelphia with neck and brain injuries, respectively.
Admittedly, we all knew he had to make some trades. Every other contending team in the league got better prior and up to the deadline, while GMJR had only added the likes of Jack Johnson in free agency, traded for Marcus Pettersson and Tanner Pearson during the season, and shipped out Jamie Oleksiak to that point.
Pettersson has been fine. You could say the same for Pearson, whose 8 5v5 goals as a Penguin ranked him 4th on the team since he debuted on November 15th. That’s not insignificant. Jack Johnson has been…well…Jack Johnson.
But, aside from maybe a fully acclimated Tanner Pearson and his goal-scoring ability, you could say that none of those players listed are players that will put your team over the top.
All this is to say that GM Jim Rutherford had to do something on Monday, particularly because of his depleted blue line, but when 3 PM came and went and Central Registry finally burned through the last minute filings, you could say that GMJR would’ve been better off doing nothing rather than acquiring Erik Gudbranson for Tanner Person (and Chris Wideman for JS Dea).
We won’t look too much at the 29 year old Wideman here, only that GMJR said that he’s “a smaller guy, a puck moving guy” that has played 181 NHL games. Despite possessing that puck moving ability, something the Penguins desperately need, Wideman is going to start his Penguins career in the AHL (emphasis in the above quote is my own).
Which leads us back to Erik Gudbranson, who, for all intents and purposes, is not an NHL quality defenseman. The data attached to this post will show that.
However, by GMJR’s own admission, Erik Gudbranson:
- is heart and soul guy
- puts the Penguins in a “stronger position to push back when [they] get into more physical games by being able to “protect” his teammates
- is a character guy
- is team guy
- is going to help the room
- is going to make guys feel more comfortable
- is a player that’s played NHL games.
If you, too, were wondering why nothing he said resembles any on-ice qualities, it’s because Erik Gudbranson is really only good at doing a few things on the ice like:
- Being 6’5″
- Being physical and doing things like throwing hits and fists
- Living in his defensive zone
- Killing his teams’ ability to be good offensively.
Now, the horse has been beaten to a pulp about how poor his advanced metrics are on the surface, but let’s go on and really dive down into the data to see if we can find some glimmer of hope upon which defensive strategists like Jacques Martin and Sergei Gonchar may be able to build to turn this guy into a useful player.
All statistics herein come via Natural Stat Trick and are at 5-on-5 unless otherwise noted.
First, let’s take a look at Bill Comeau’s SKATR comparison tool one last time before he retires it to see, from a bird’s eye level, where Gudbranson stacks up across 21 categories this year (left) versus his past 3 years (right).
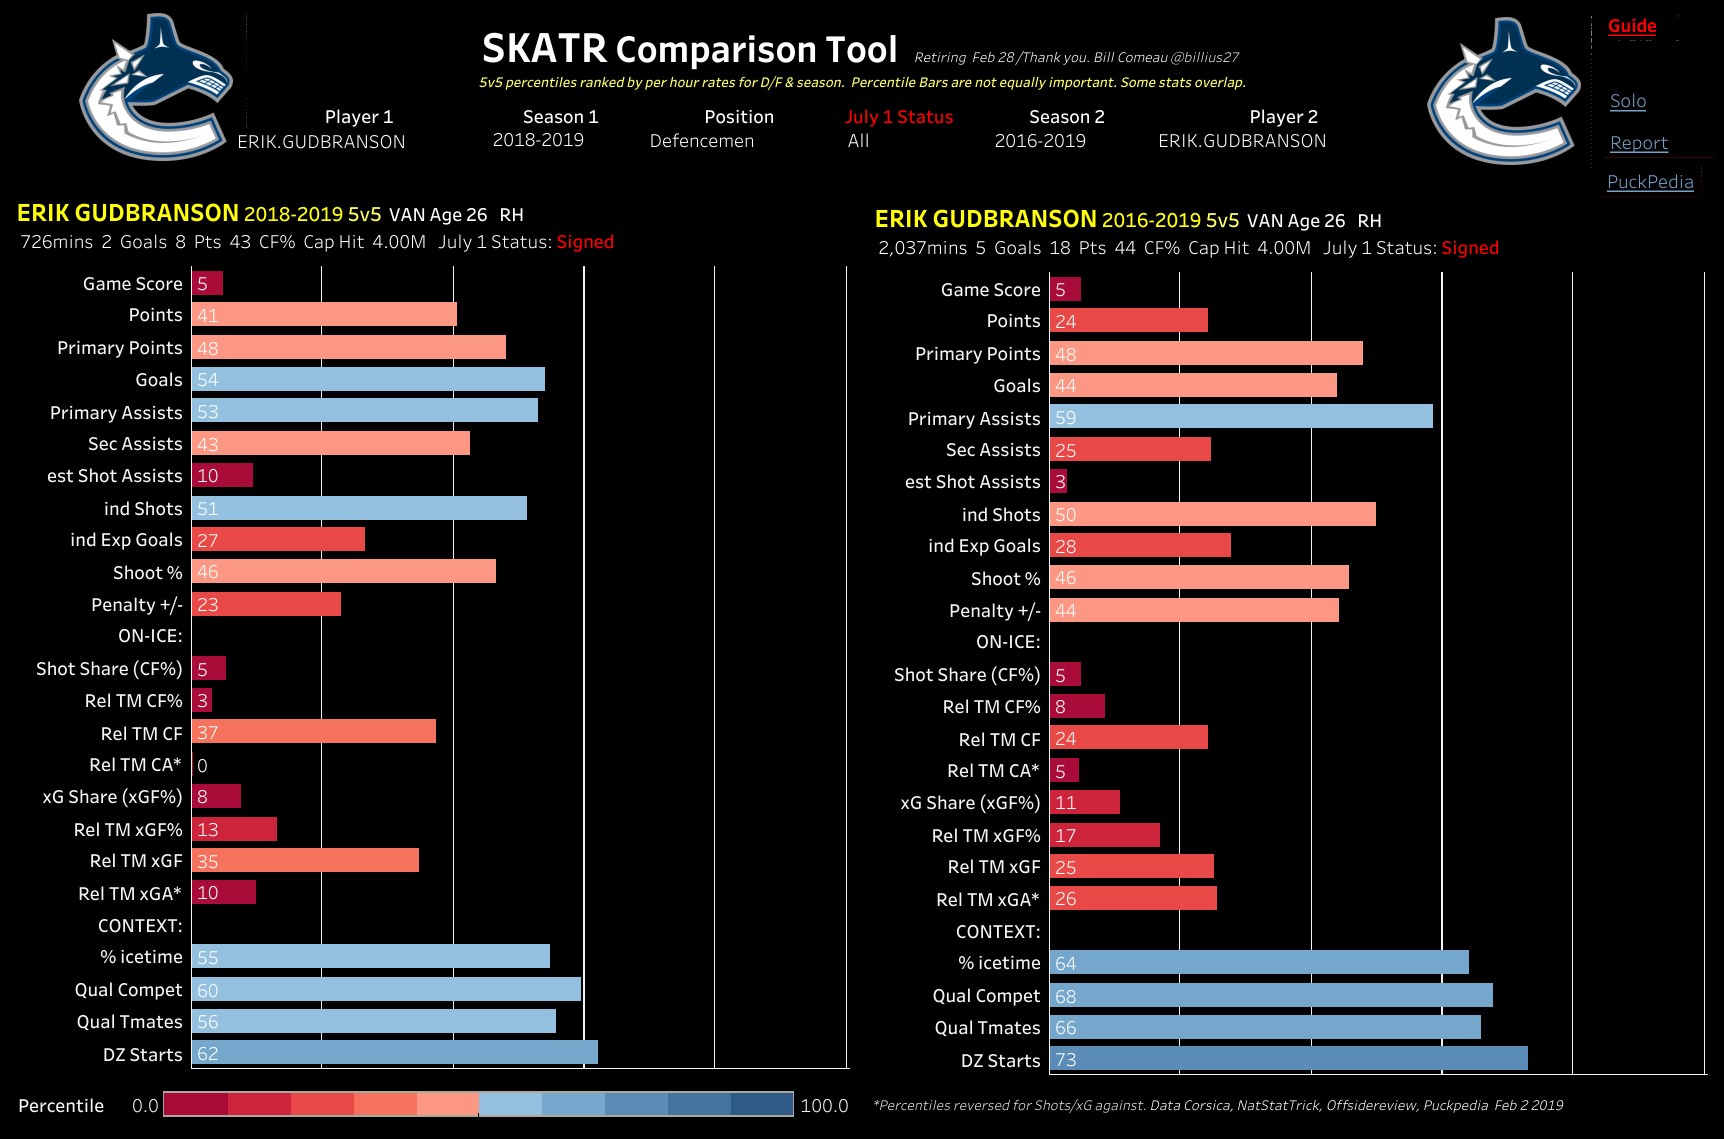
What stands out here is just how bad of a season Gudbranson has had so far. His last three years were bad, but this year has somehow been worse. That makes the price of Tanner Pearson even more mind-boggling.
What’s more, and Jesse Marshall of The Athletic touched on it briefly in his piece, is that Gudbranson is actually performing at a lower level than that of Jack Johnson.
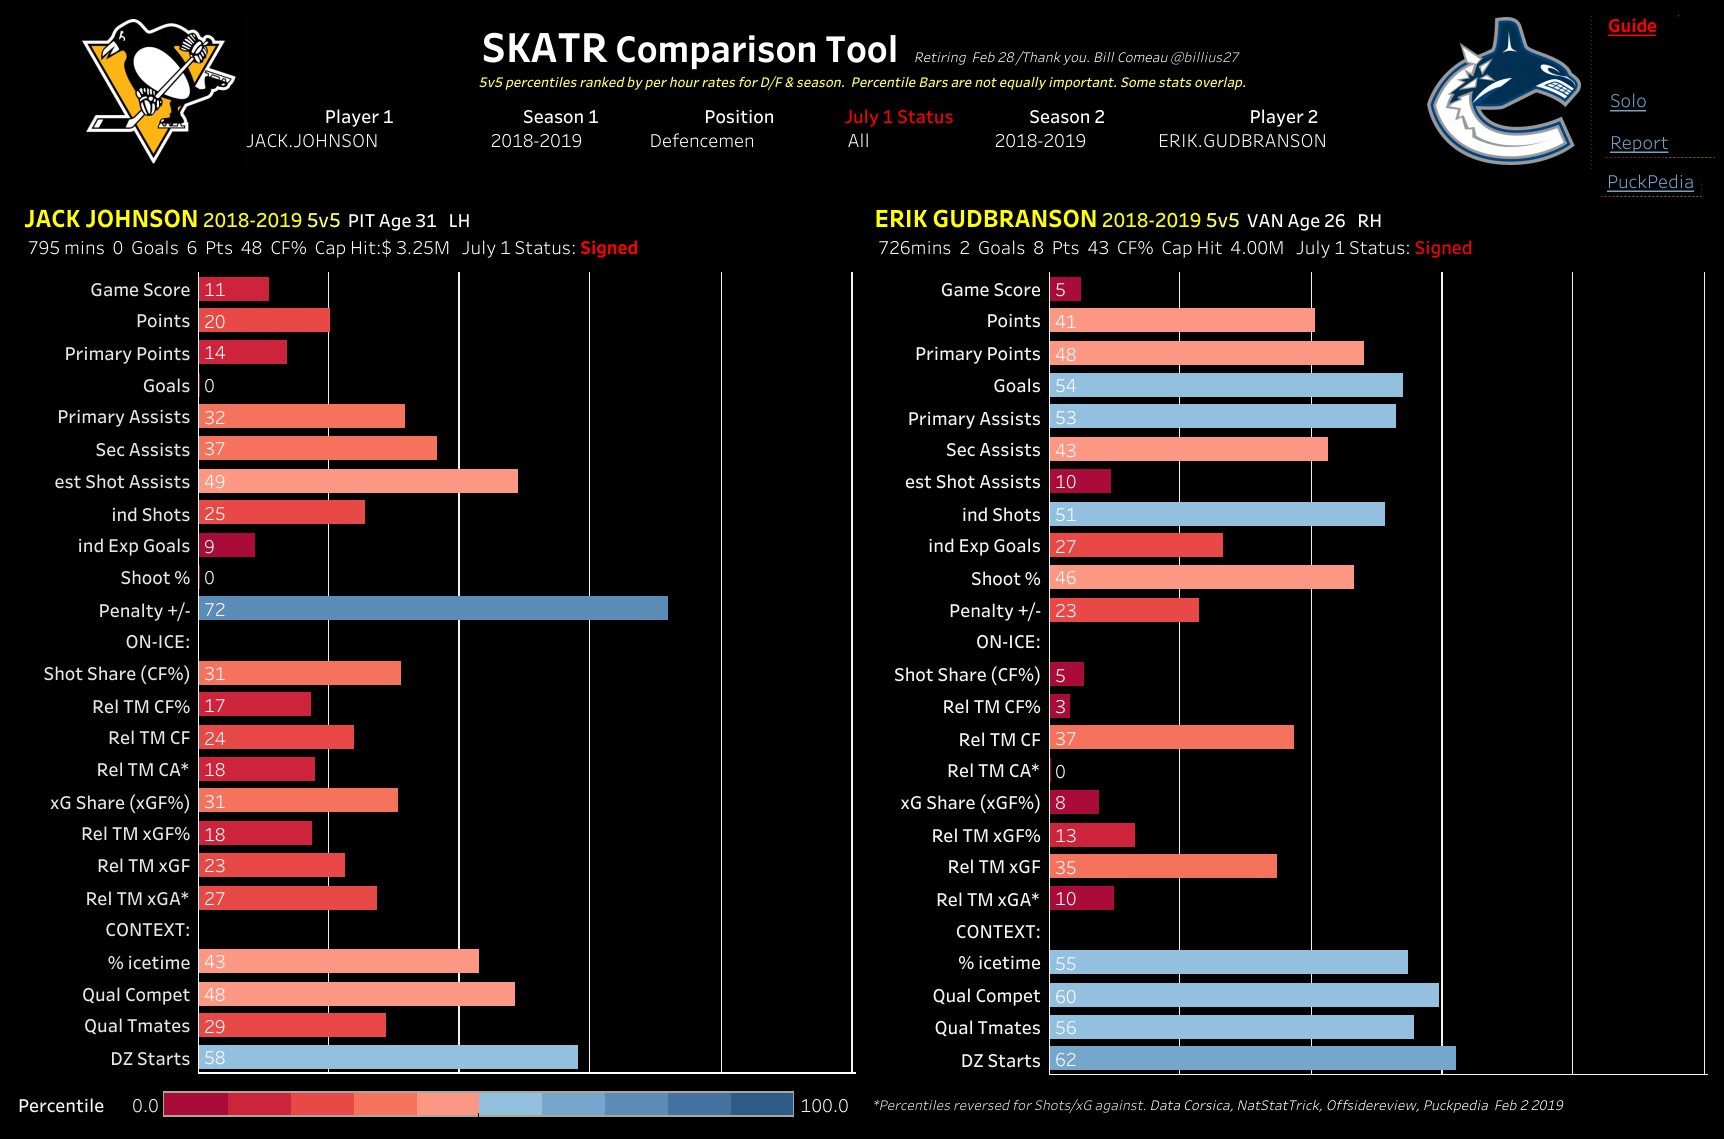
As you can see, from a defensive perspective, Jack Johnson finds himself in a higher percentile of 5-on-5 shot attempt share, shot attempt share relative to his teammates, shot attempt suppression relative to his teammates, expected goals for share, and expected goals against relative to his teammates. As far as being on the ice for a larger amount of expected goals relative to their team, both are pretty much on par in the “bad” realm.
What this means is that both Johnson and Gudbranson are bad at helping their teammates generate in the offensive zone and are generally worse at limiting the opposition from creating shot attempts and quality looks in the form of expected goals. Thinking back to when we took a look at Johnson’s underlying numbers a month ago, seeing a player that’s actually worse than Johnson is, in a word, terrifying.
While it’s a useful exercise to examine Gudbranson’s numbers here in this capacity, it’s important to look at how he impacts the teams he plays for while he’s on the ice.
On-ice – Rates
With the Penguins possessing one of the more potent attacking forces in the league and three forwards that are producing at greater than a point per game, it stands to reason that you don’t want a defender that is going to stifle that potency.
On the flip side, with defense being perhaps the weakest point of this current Penguins team, you’d reasonably want a “defensive specialist” to come in and help steady the ship.
Unfortunately, Erik Gudbranson does nothing to stimulate offenses and does even less at being strong defensively. This is a trend that exists beyond this season and shows up across the board throughout his 8 year, 448 game career.
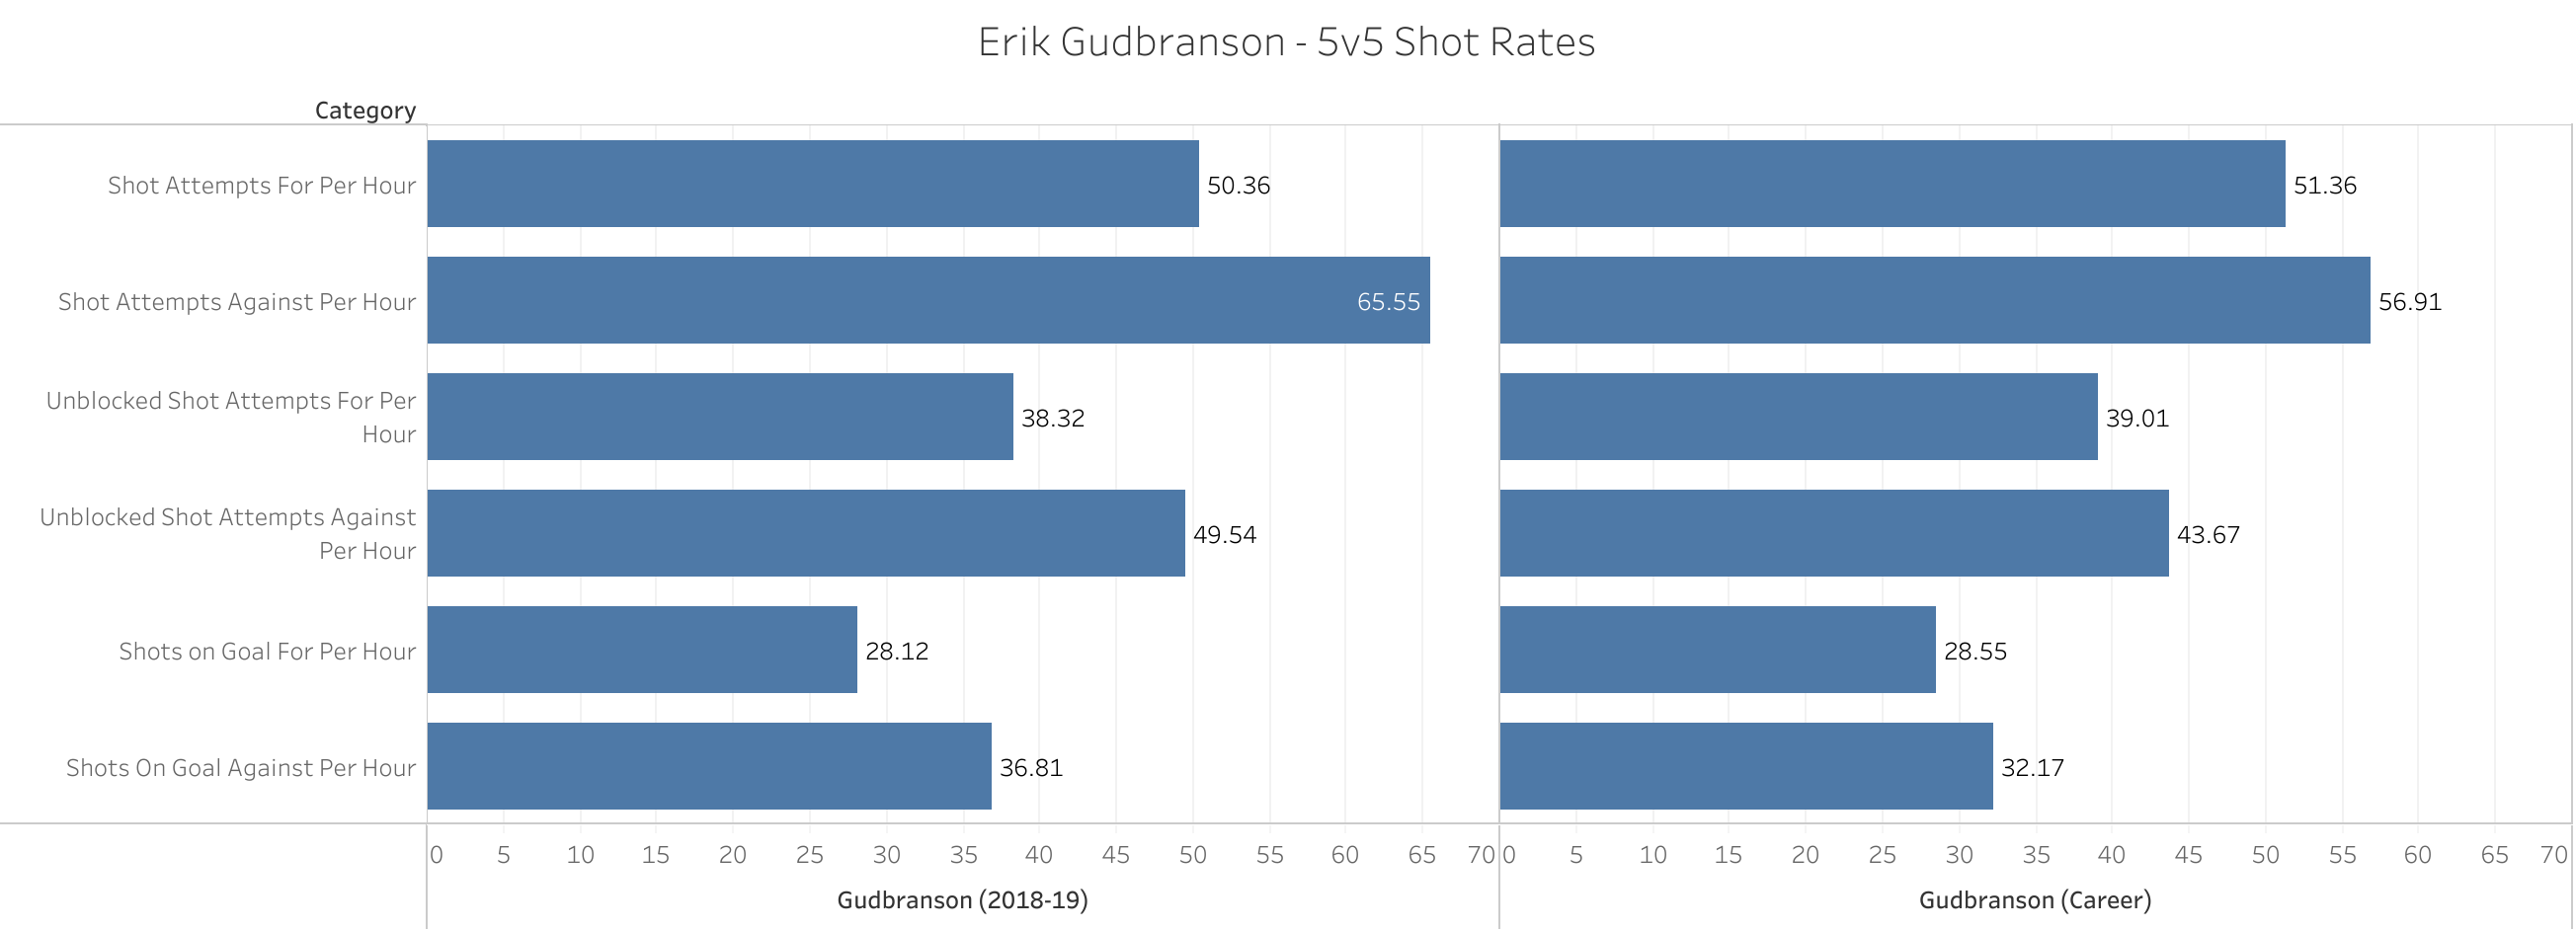
There’s a lot of information here, but it can easily be summed up like this: Erik Gudbranson is having himself a terrible year (as we saw above, even by his 3 year average standard). In nearly every single data bucket captured below, Gudbranson is worse off this season than he has been over his career and is among the worst in the league in nearly every single data point that we track.
[Click to enlarge all images]
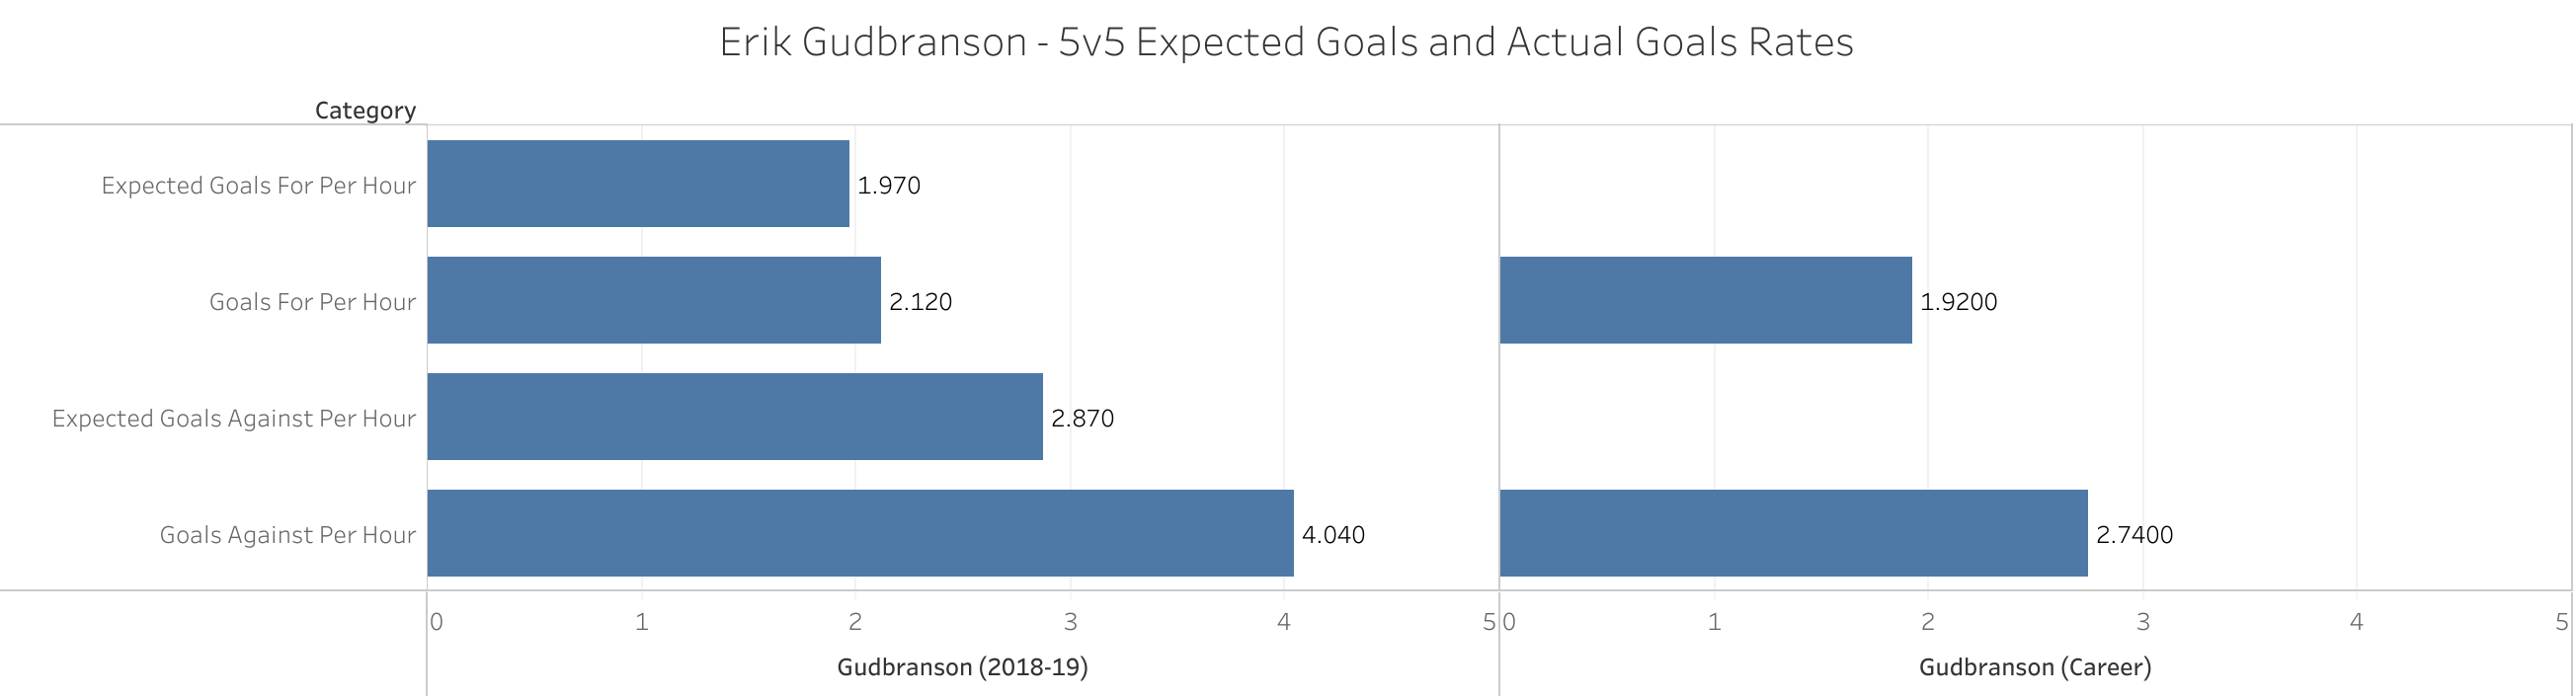
[Note: Expected Goals below come via Evolving Hockey. Career xG numbers are unavailable.]
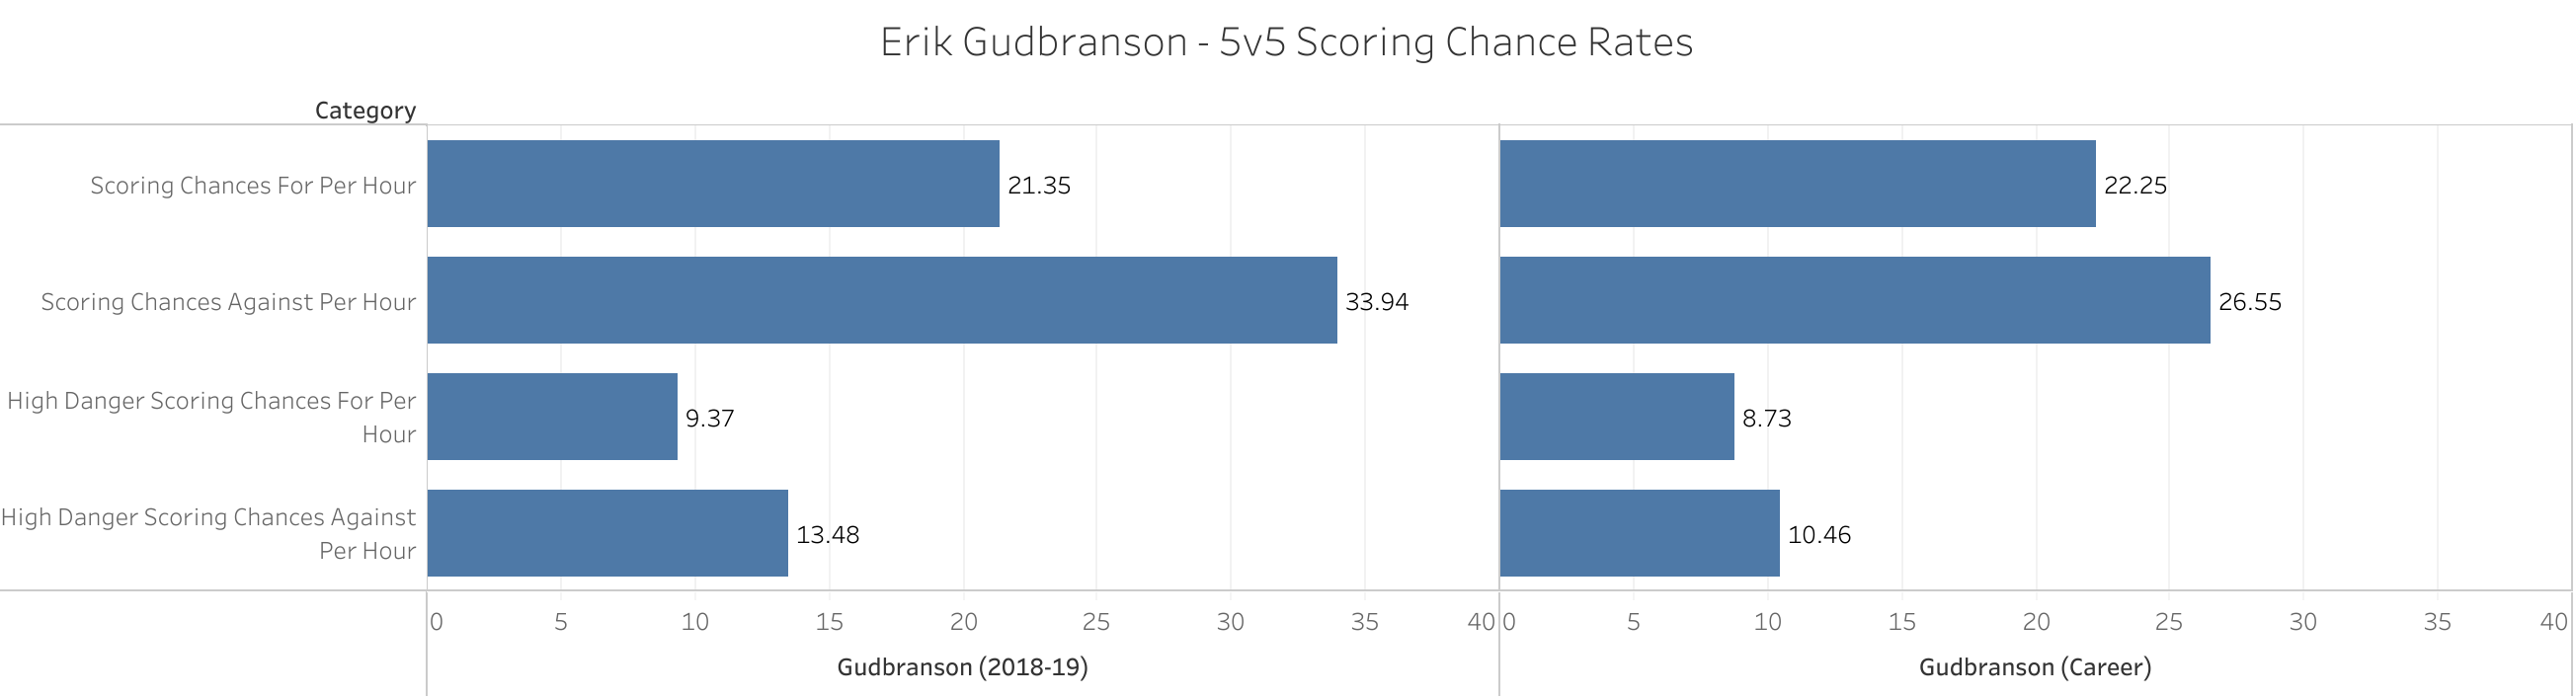
In fact, in every “For” category, except for High Danger Scoring Chances For per 60 minutes of 5v5 ice time and actual Goals Scored For per 60 minutes of 5v5 ice time, Gudbranson is on the ice for fewer in each compared to his career average.
In other words, when Gudbranson is on the ice this season, his team is generating fewer shot attempts, unblocked shot attempts, shots on goal, and scoring chances per hour of ice time compared to his career average. That’s not to say that his career numbers are good (they’re not), but the fact that he’s seen such a drop off is frightening.
That’s especially concerning for a team like the Penguins that is so reliant on their defensemen contributing offensively.
What’s more, when you look at each suppression-based metric (i.e. the “Against” date buckets above), you see that this season, he’s drowning in his own end of the ice. It cannot be stressed enough just how bad these numbers are.
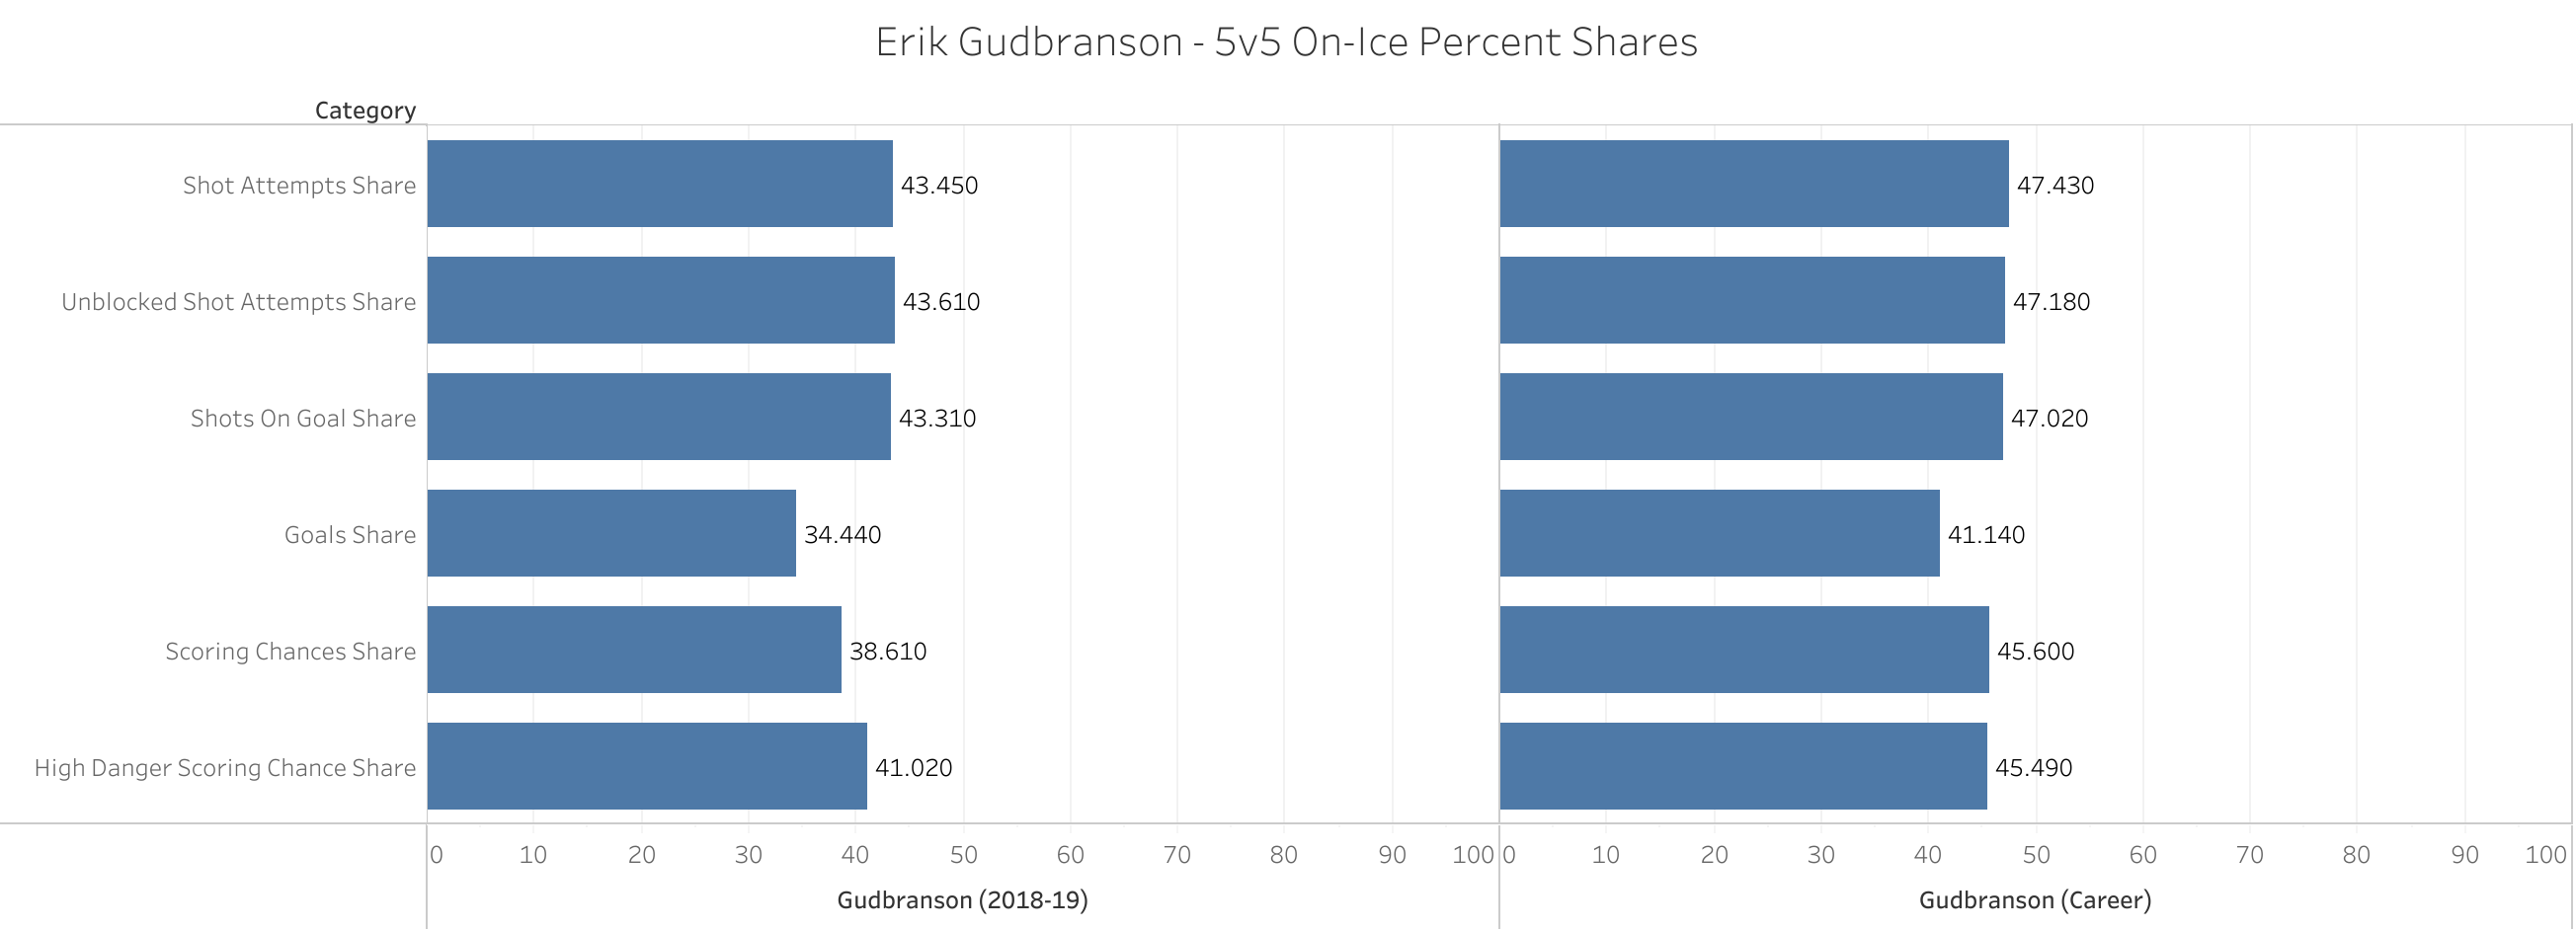
After seeing such a disparity between his For and Against numbers, it should come as no surprise to see that his share of each category is well below 50%. This season alone sees him down 4 percentage points across the board compared to that of his career average, too.
It’s worth noting here that he’s seen his share of shot attempts, unblocked shot attempts, shots on goal, and high danger scoring chances pass the 50% share threshold just once in his career (2013-14). Furthermore, 2015-16 was the sole year he was on the ice for more goals for than against (36-35) at 5v5. It shouldn’t surprise you to find out that in 2015-16, Roberto Luongo went 35-19-6 with a .922 SV% and 4 shutouts.
But, bearing the rates and shares above in mind, it’s worth checking out just exactly where he ranks in terms of the 217 defenseman that have played 300+ minutes if 5-on-5 ice time.
You’ll see that he is in the bottom 11 out of 217 defensemen in all 7 suppression-based categories. Aside from ice time and share of goals, he finds himself in the bottom 44 in every category.
| Gudbranson 2018-19 Rank | |
| Time On Ice per Game | 146th |
| Shot Attempts For Per Hour | 196th |
| Shot Attempts Against Per Hour | 9th most |
| Shot Attempts Share | 210th |
| Unblocked Shot Attempts For Per Hour | 179th |
| Unblocked Shot Attempts Against Per Hour | 7th most |
| Unblocked Shot Attempts Share | 210th |
| Shots on Goal For Per Hour | 173rd |
| Shots On Goal Against Per Hour | 5th most |
| Shots On Goal Share | 210th |
| Goals For Per Hour | 156th |
| Goals Against Per Hour | 2nd most |
| Goals Share | 213th |
| Scoring Chances For Per Hour | 208th |
| Scoring Chances Against Per Hour | 1st most |
| Scoring Chances Share | 217th |
| High Danger Scoring Chances For Per Hour | 178th |
| High Danger Scoring Chances Against Per Hour | 10th most |
| High Danger Scoring Chance Share | 210th |
| Expected Goals For Per Hour | 201st |
| Expected Goals Against Per Hour | 11th most |
| Expected Goals Differential Per Hour | 4th worst |
To drive just how bad these numbers are, we need to look no further than Corsica Hockey’s Player Rating Tool. Out of the 246 total defensemen rated within this tool, Erik Gudbranson ranks 245th.
So, based on this model, Erik Gudbranson is the 2nd worst defenseman in the league.
On-ice – Relative to Teammates
Understandably, there is a cause for concern with Gudbranson having played on some pretty poor Panthers and Canucks teams over his career. To that end, he’s played in just 13 career playoff games (2011-12, 2015-16). So the thought is that his rates above are skewed because he’s played on such bad teams. Admittedly, there’s some truth to that.
However, despite playing on bad teams, if there were areas where he showed up and made his team better, we’d see them in the Relative data buckets.
Put another way, if Gudbranson’s teams are better while he’s on the ice than when he’s off of it, we’ll know by looking at the statistics relative to his teammates.
So first, let’s take a look at what he does at 5v5 relative to his teammates with respect to moving the puck in a positive direction on a season-by-season basis.
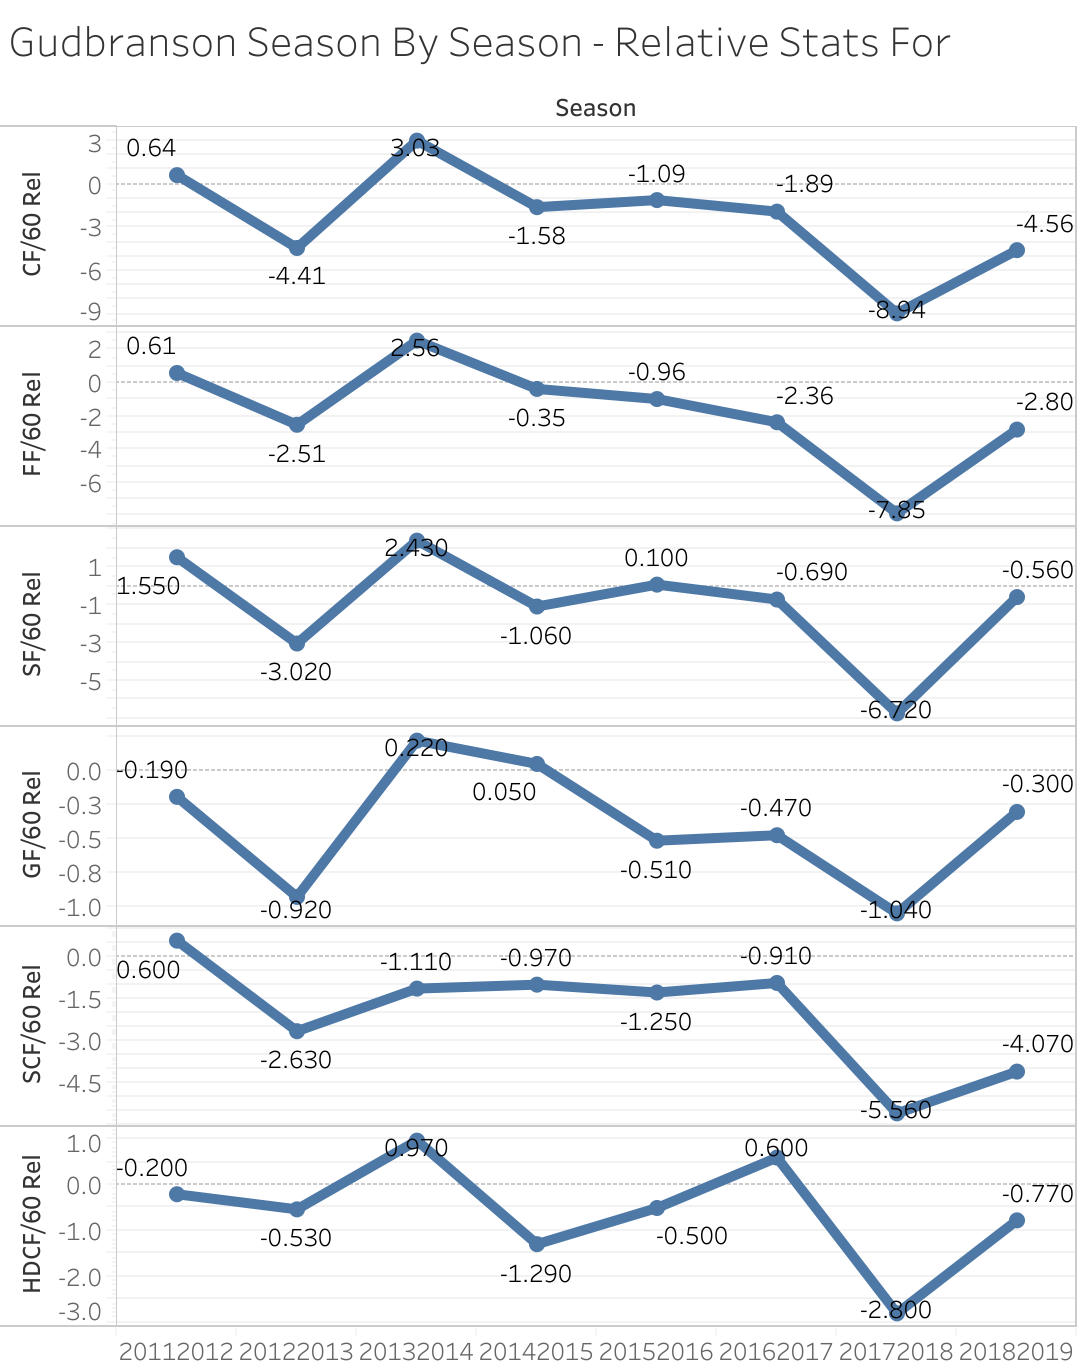
You can see here that 2013-14 was probably his best year relative to his teammates (while 2017-18 was his worst) in terms of helping move the puck away from his own goal. What this shows us here is that, in 2013-14, his team was generating more shot attempts, unblocked shot attempts, shots on goal, goals, and high danger chances when he was on the ice than when he was off of it.
However, when you see so many negatives, it’s concerning. Take this season as an example. When Gudbranson is off the ice, his team is generating 4.56 more shot attempts than when he’s on it (per hour of 5v5 ice time). They were also generating 2.80 more unblocked attempts, 0.56 more shots on goal, 0.3 more goals, 4.07 more scoring chances, and 0.77 more high danger chances per 60 minutes when he’s not on the ice.
Think of it this way: His teams generate more offensively when he’s not on the ice.
That’s bad news, but something you can maybe stomach if he’s a solid contributor defensively.
Next, we want to take a look at how he’s performed defensively at suppressing shot attempts, unblocked attempts, shots, goals, and scoring chances.
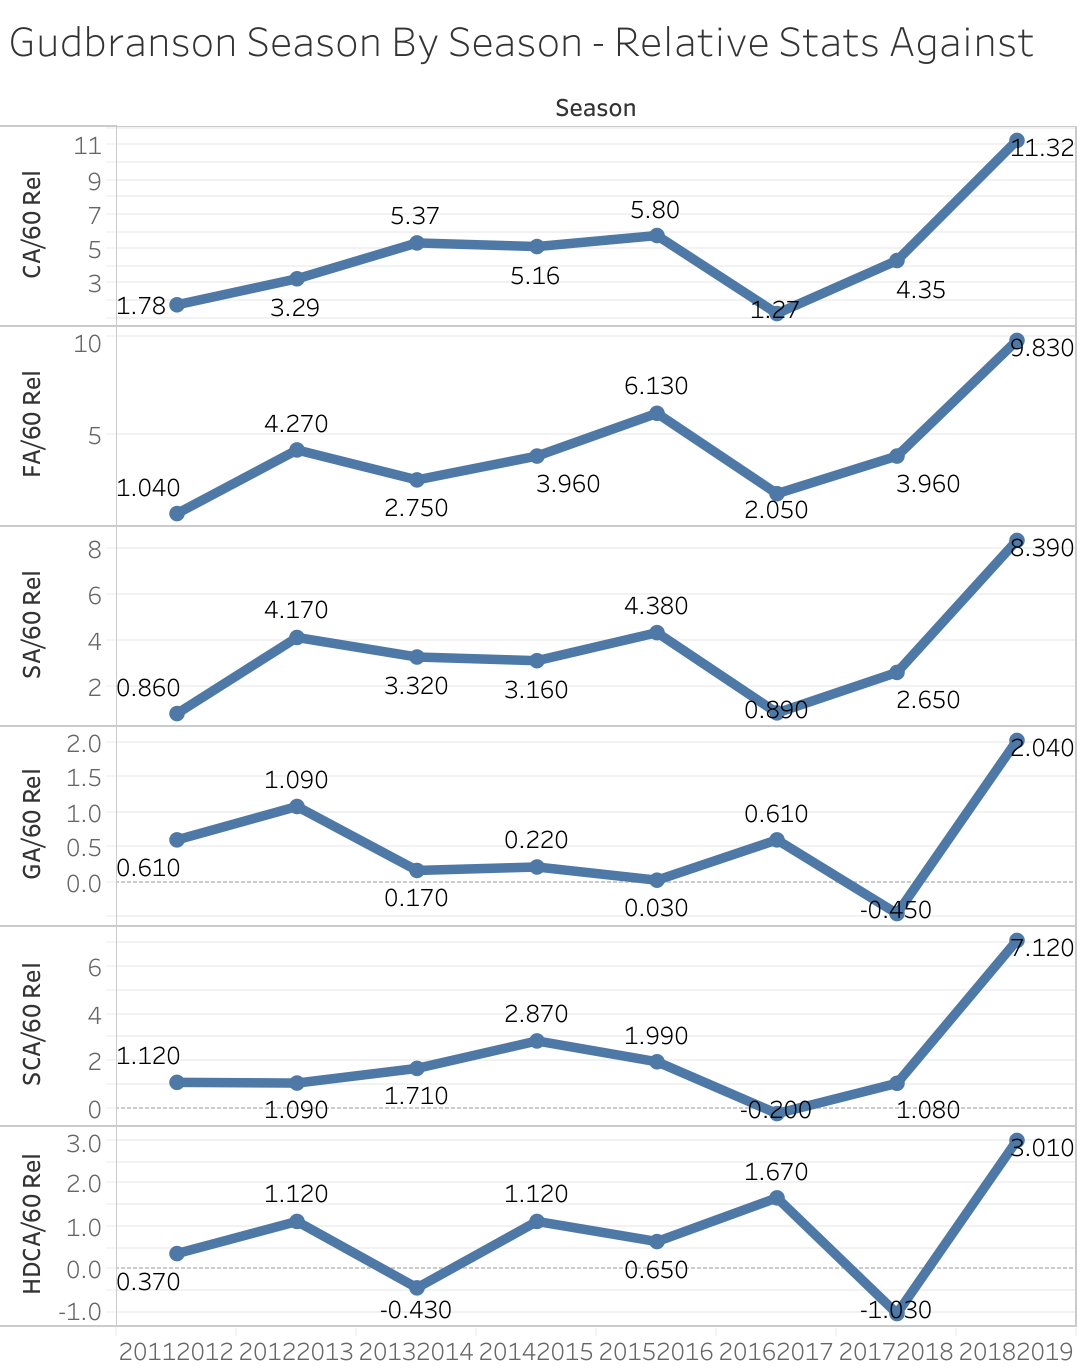
With respect to the “Against” numbers, you want to see more negative signs than positive signs. Seeing a negative sign means that when he’s on the ice, his team is having fewer shots, goals, and chances directed at his goal than when he’s off of it.
Here, you can probably make the case that 2016-17 was perhaps his best season defensively.
But this season? Ho boy, this season is not good. Relative to his teammates, Gudbranson finds himself on the ice for over 11 more shot attempts against per hour, nearly 10 more unblocked shot attempts against, over 8 more shots on goal against, about 2 more goals against, 7.12 more scoring chances against, and 3.01 more high danger chances against compared to when he’s off of it.
Put another way: his teams are better defensively when he’s not on the ice.
Finally, let’s see what the net result looks like as a relative share of these data buckets.
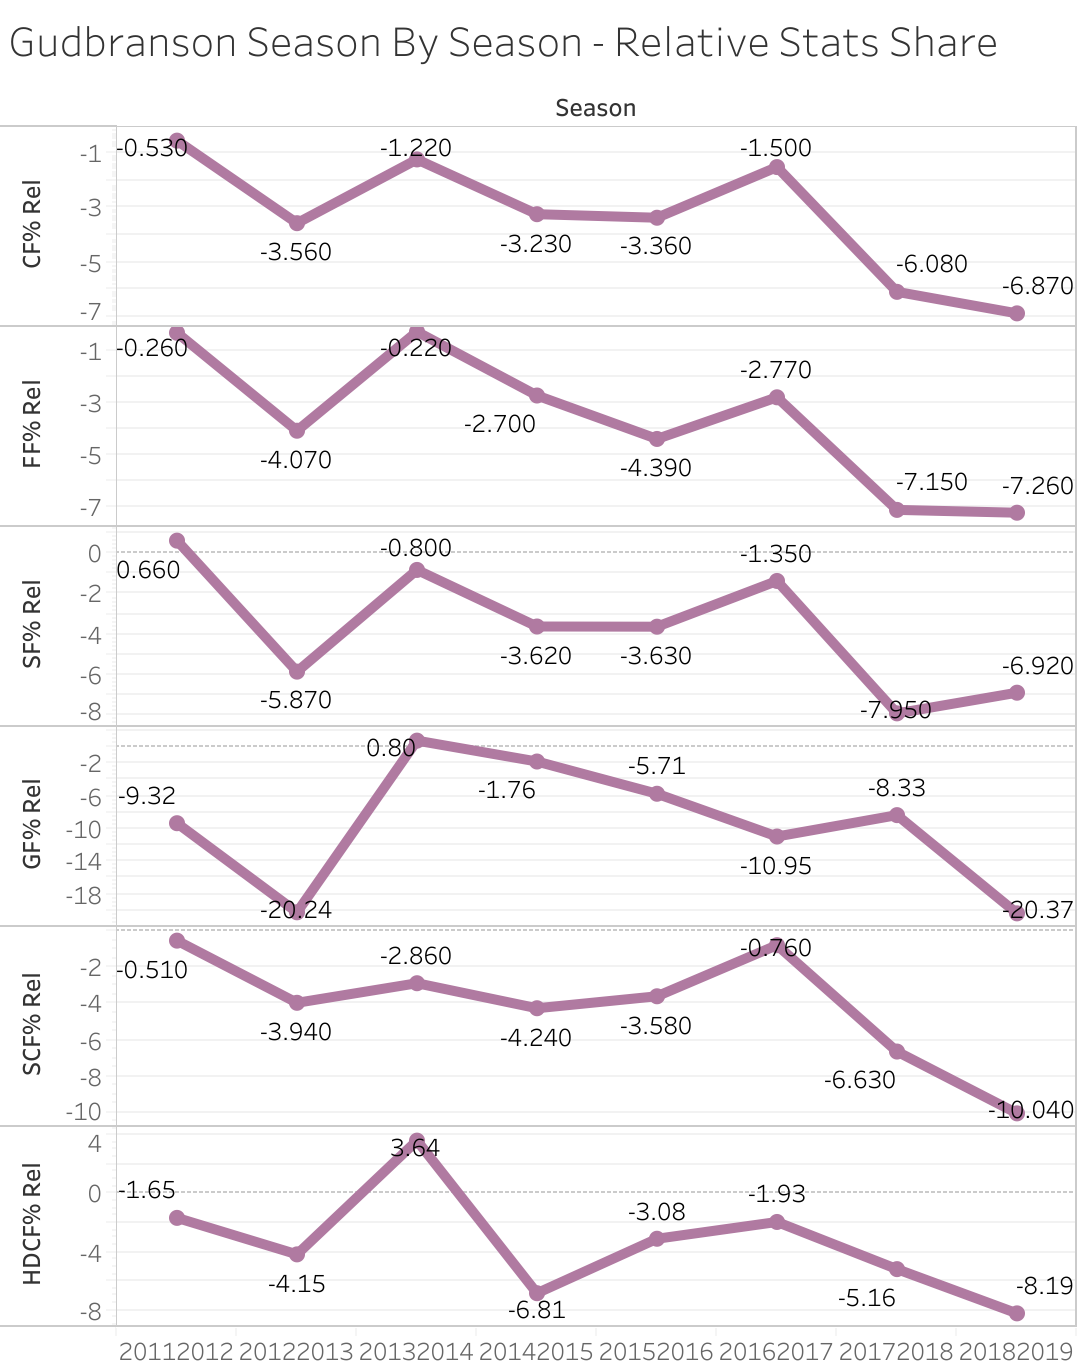
When we look at his share of these data buckets relative to his teammates, it does not paint a pretty picture. Aside from 2013-14’s share of goals for and high danger chances for, his teams have been better with him off the ice than on the ice in terms of controlling the puck in every other data bucket in every single season of his career.
If his poor on-ice stats were just a product of his environment, we’d see it in the relative stats just as we did with Pettersson and his time in Anaheim. But we simply don’t here and that’s a big concern.
To summarize: Erik Gudbranson is one of the worst defensemen in the league, which we largely already knew. Checking out Micah McCurdy‘s Hockey Viz, we can really see this impact.
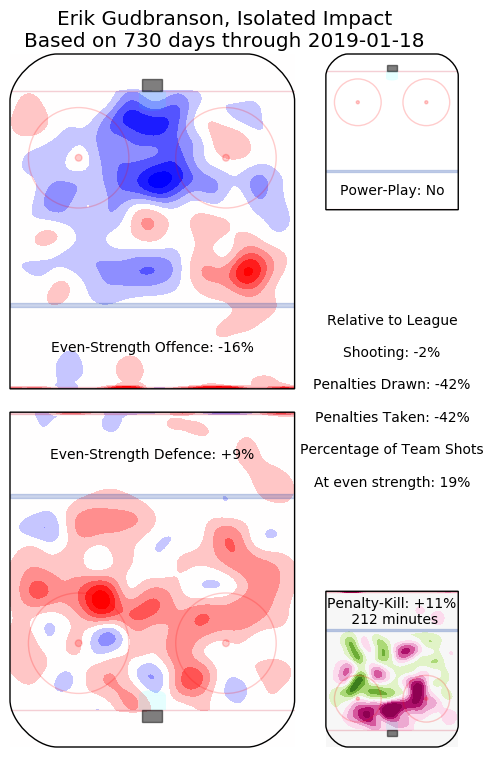
His teams benefit offensively and defensively when he is off the ice and are negatively impacted when he’s on it. The data shows this conclusively. The video that Jesse broke down does, too.
https://twitter.com/MrBooth_7/status/1100207747822321664
The way Phil! just waits for Gudbranson to commit, then de-commit before making the pass to Hagelin is a thing of beauty. Gudbranson gets back up right as he buys into Phil! shooting the puck, pic.twitter.com/AQANq8taSi
— nerd king geoff (@geoffwithano) October 17, 2018
Question: “What is he supposed to do there?”
Answer:
your job as a defenseman is to take away the pass on a 2v1. So, i guess preventing the pass is a good start.
— nerd king geoff (@geoffwithano) February 25, 2019
Now, it should be said that the Penguins have done well with a few “reclamation” projects over the years (though, it should be said that Schultz and Daley were a lot better than Gudbranson).
Is Gudbranson one of those or is he a lost cause? Time will tell. But they’re going to be paying him $4M through the next 2+ seasons, so they’re going to need to do their absolute best to try to make this work.
Otherwise, one-third of the Penguins defense will get caved in regularly and will be a $7.25M liability in the final years of the Crosby/Malkin/Letang window.
That’s one hell of a gamble no matter which way you cut it. Let’s hope it works out despite all of the red flags.
Add The Sports Daily to your Google News Feed!