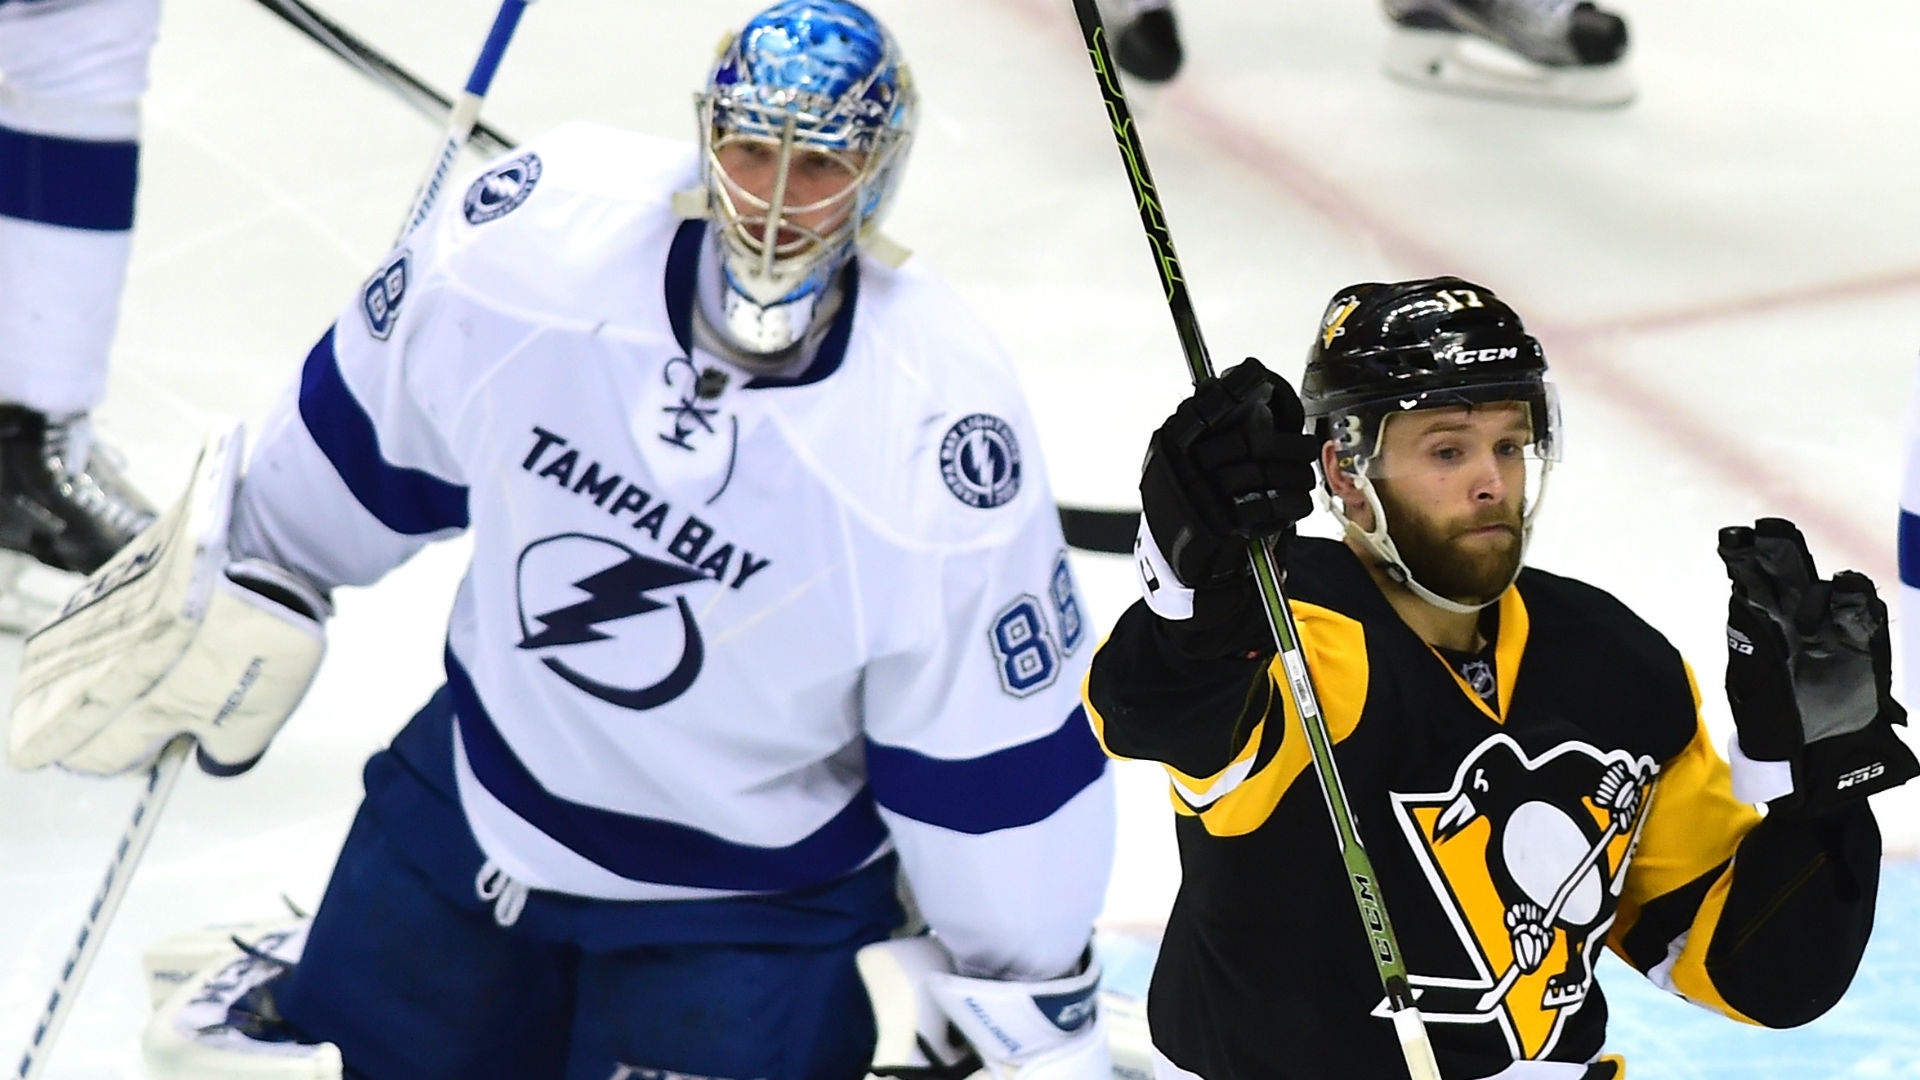
Pensblog Pat with a solid recap of the Pens big win over Washington last night. Jake Guentzel was in the middle of it as usual and Pensblog Geoff explains why Guentzel is flourishing this season.
* * *
As we approach the end of the regular season, there is something historic happening at the top of the standings. After Tampa Bay’s victory on Monday, they held a 17 point lead on the entire league. Tampa Bay has already dusted off every other NHL team this year and for the remainder of this regular season, their focus can be on chasing history, pursuing some of the greatest clubs of all-time, including a Penguins team from a generation ago.
THE .700 CLUB
This is not “BoltsBlog”, but when another team (with non-annoying players and a fan base that doesn’t piss us off) is on the verge of something historic, it’s a good idea as fans of hockey in general to take a gander, so that we don’t miss one of the most incredible single-season team accomplishments ever.
Since the five-minute overtime period was re-introduced into NHL regular season games starting in 1983-84, only eight teams have achieved a true single-season .700 winning percentage (excluding lockout-shortened seasons). That’s just 0.9% of the 854 team-seasons during that time span.
What’s so great about .700?
It’s a nice round number. Seriously, a team that posts a .600 winning percentage will definitely be a playoff team and possibly one of a few legitimate Cup contenders. However, to compile a hundred more points of winning percentage … that lifts a team up to a very exclusive level, better than 99% of others, an elite accomplishment that deserves recognition.
Why start counting from 1983-84?
To make apples to apples comparisons. Overtime did not exist in the NHL from 1942 to 1983. Further, while present-day 21st century teams play in an era of overtime loss points and shootouts, we can easily adjust standings tables to fairly compare teams that played before and after overtime loss points and shootout formats came into existence.
standings adjustmentS
For all teams since 1983-84, we follow this criteria:
- only regulation and overtime wins earn two points
- regulation and overtime losses earn zero points
- any game that reaches the end of overtime with a tie score (i.e. any game that is settled in a shootout whether a shootout win or shootout loss) is treated as a tie, earning one point
This is, of course, how standings points were earned prior to 1999-2000. Therefore, teams from 2000-present will lose their overtime loss and shootout win points. That’s why this is a “true” winning percentage and not the “points percentage” commonly used today to rank teams.
The chart below shows adjusted true standings points and winning percentages. Since a tie (or shootout game) is essentially half a win and half a loss, winning percentage equals the sum of regulation and overtime wins and half the ties (or shootout games), divided by total games played.
[office src=”https://onedrive.live.com/embed?resid=2A728A26A493C6FE%21185&authkey=%21AA52JXNbbEqebzw&em=2&ActiveCell=’Sheet1′!L12&wdHideHeaders=True&wdDownloadButton=True&wdInConfigurator=True” width=”452″ height=”402″]Tampa Bay needs 14 points from regulation/overtime wins or “tie” games at the end of overtime in their 12 remaining contests to reach .700. They are on pace to clear .700 by 1.5 wins. At the top of the list, Detroit in 1995-96 cleared .700 by a staggering eight wins, while the 1992-93 Penguins eked into the .700 Club by a half win. At the bottom of the chart below the cut line are three teams who were close but unable to break the .700 plane including Washington falling short two seasons ago by a solitary win.
GOAL DIFFERENTIAL, SPECIAL TEAMS & luck
This next chart shows goals for, goals allowed, goal differential, power play, penalty kill and combined special teams percentage (ST% = PP% + PK%). Additionally, to see how much luck, if any, was involved, PDO (shooting % + save %) and regulation/overtime 1-goal game win-loss records are also presented.
[office src=”https://onedrive.live.com/embed?resid=2A728A26A493C6FE%21187&authkey=%21ANeCHAy4ib0J31w&em=2&ActiveCell=’Sheet1′!C12&wdHideHeaders=True&wdDownloadButton=True&wdInConfigurator=True” width=”530″ height=”406″]To give context to these raw numbers, here is a final chart showing the .700 Club clubs (and the near misses) with their league rank in goal scoring and special teams. Also, goals for above average (GFAA), goals allowed below average (GABA) and the composite (GFAA + GABA), all expressed as percentages, are presented to show how far ahead of an average team these elite clubs were, in their respective .700 Club seasons.
For example, Tampa Bay has scored 26.7% more goals than league average this season while their goals allowed divided by league average is 0.867. The latter number is expressed as 13.3% goals allowed below average.
[office src=”https://onedrive.live.com/embed?resid=2A728A26A493C6FE%21189&authkey=%21AH3sIEtK4FJgpeQ&em=2&ActiveCell=’Sheet1′!C13&wdHideHeaders=True&wdDownloadButton=True&wdInConfigurator=True” width=”436″ height=”419″]* * *
2018-19 TAMPA BAY
The Lightning are on track to be the first member of the .700 Club to lead the league in both PP% and PK%. Their 28.5 PP% is the highest by any NHL team in 36 years and their ST% would easily be the best of any .700 Club member. Don’t overlook Andrei Vasilevskiy however. While T-Bay is best known as an offensive juggernaut, the Lightning goaltender leads the league with 31 goals saved above average (GSAA).
1983-84 & 1985-86 EDMONTON
The 1983-84 Oilers scored 41.3% more goals than league average.
41.3%.
Think about that for a second.
In raw numbers, they were the highest scoring team of all-time by total goals (446) and goals per game (5.58). The next closest team, Quebec, was more than a full goal per game behind. That’s why it didn’t matter at all that Edmonton was a league average team at preventing goals in both of their .700 Club seasons. When your offense floods the opposition, it covers over a multitude of defensive sins.
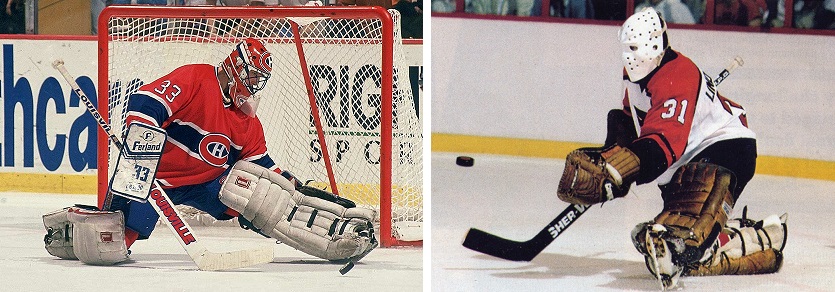
1984-85 philadelphia & 1988-89 montreal
The Flyers and Canadiens were the only two .700 Club clubs that did not finish in the top-three in the league in goals for nor the top-two in the league in PP%. For these clubs it was the play of their starting goaltenders that drove them to elite status. Patrick Roy, 23, in Montreal already had a Cup ring and a Conn Smythe Trophy. In 1989, he added his first Vezina Trophy and initial First All-Star Team selection to his resume, leading the league in GAA, SV% and GSAA.
Four years prior, Pelle Lindbergh, the first great Swedish NHL goaltender, was instrumental in helping the Flyers reach the Cup Final. He posted an astonishing 47 GSAA, the 10th highest mark ever at the time, 25 more than the next closest qualified goalie that season, easily winning the Vezina. At 26, his whole career and life was ahead of him but two nights after what would be his last game with the Flyers that November, he died after drinking and driving.
1992-93 PITTSBURGH
Mario Lemieux.
[youtube https://www.youtube.com/watch?v=rid9ZjjubVI]The still-NHL record 17 game win streak.
[youtube https://www.youtube.com/watch?v=S8T-HrkrDYo]1995-96 DETROIT
Never mind cruising into the .700 Club, Detroit almost qualified for the .800 Club. In what was the last high-offense season prior to the Dead Puck Era, Detroit was the third-highest scoring team in the NHL but more importantly, they were ahead of the curve defensively, posting 29.8% GABA. Detroit’s roster featured seven future Hall of Famers, the most of any .700 Club team.
* * *
common lucky threads
Unsurprisingly, the PDO of six of the nine teams (including Tampa Bay) are above 102.5, generally the point beyond which, a team’s goal scoring and goal prevention is unsustainable long-term. But that’s precisely why it’s interesting to see these high PDO numbers. Perhaps one shouldn’t be surprised at what happens when incredibly talented teams ride a season-long wave of good luck (as estimated by their high PDO). This yields the pretty absurd result of a .700+ winning percentage.
Similarly, there is obviously a luck element to winning close games, especially overtime contests. The .700 Club teams, with two exceptions, all won better than 65% of one-goal games. Collectively, in 185 one-goal games, their winning percentage was .681.
SCOTTY BOWMAN AND record-setting ELITENESS
From the dawn of expansion in 1967 to the beginning of our cutoff point, 1983, the NHL was a very polarized league. Expansion teams like Oakland, Kansas City and Washington were mostly utter trash and therefore, well-run teams like Boston, Philadelphia and most of all, Montreal, experienced a bump from being very good to being exceptionally elite. In the 1970s, the .700 mark was achieved 18 times including the Habs reaching the mark six times, surpassing .800 twice.
Just had a nice press-box chat with former #Habs coach Scotty Bowman, who is looking great at age 84. He lives in Tampa now and attends all the #Lightning home games #HabsIO pic.twitter.com/rQowkUjxgG
— Stu Cowan (@StuCowan1) December 29, 2017
The 1976-77 Canadiens, (.825 winning percentage, the best-ever) led by nine Hall of Fame players, are considered by many to be the best NHL team of all-time. They accumulated 132 points, 60 regulation wins and a +216 goal differential – all still-standing records 42 years later. (By comparison, the 1996 Red Wings finished with 131 points, 59 regulation wins and +144, while Tampa Bay currently has a +89 goal differential).
Montreal won five Cups from 1973 to 1979 with Scotty Bowman as head coach. When the Penguins surged to .700 in 1993, it was Bowman who was behind the bench. Three years later, it was Bowman again, at the helm of that vaunted Detroit club.
Incredibly, as late as 2002, if not for an 0-5-2 finish to the season, Bowman might have guided a ninth team into the .700 Club. That Detroit club with nine Hall of Famers, was comparable to his 1970s Montreal dynasty.
Though he officially works for the Blackhawks, Bowman lives in Florida now and attends every Tampa Bay home game. It’s astonishing. Just being in the same building as Bowman means the Lightning benefit from his winning aura. Everywhere the man goes, record-setting dominance follows.
Add The Sports Daily to your Google News Feed!