
When the Penguins traded Olli Maatta on June 15th, there was a sense that they moved on from the wrong defenseman.
That’s not to suggest that they had something on the table for the right defenseman, but one (or both!) of Maatta or Johnson had to go to open up the necessary cap space to re-sign restricted free agents Marcus Pettersson, Zach Aston-Reese, and Teddy Blueger.
As of this post, the Penguins, one year removed from inking Jack Johnson, the #110 ranked left D and 219th ranked overall D (of 254) by Corsica, to a 5 year, $3.25M per year contract, possess just $3,192,500 in cap space to sign their 3 RFAs, likely putting them right back up against the cap with little to no wiggle room to explore options in Free Agency.
One year removed from signing that contract and the Penguins were, at some point, considering moving on from Johnson. In retrospect, it seems crazy to think that absolutely no one predicted his bad season would be bad.
A year ago, the Penguins claimed they had to give Jack Johnson 5 years to chase away other suitors. Now no one wants him? Either they lied/miscalculated, or a bunch of GMs completely reversed their opinion of Johnson after one year. Both equally likely in this dumb league!
— Dan Hopper (@DanHoppOPS) June 17, 2019
As it turns out, this wasn’t the only claim made about Jack Johnson that turned out to be erroneous.
“He Only Had One Bad Year”
This argument stemmed from the fact that Johnson was a healthy scratch down the stretch in his final season with Columbus, largely because the Blue Jackets had 6 other defensemen that were better than him.
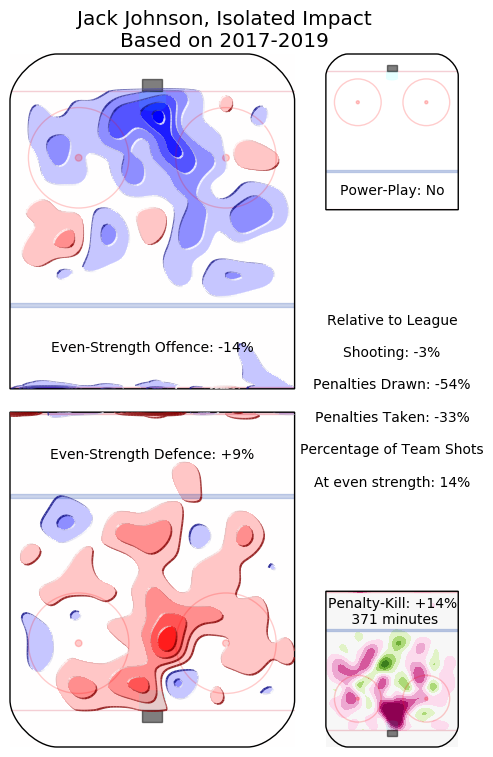
Taking a glance at his 3 year isolated impact (via HockeyViz.com), it makes sense as to why. He’s a negative impact on 5-on-5 offense, not particularly adept at defending at 5v5, and allowed opposing powerplay to live in front of the net while he’s killing penalties.
Moreover, we see this when looking at his overall shares from the same 3 year period as above, his “one bad season” in 2017-18 (his last one in Columbus), and this past year with the Penguins all compared to that of his career average since 2007:
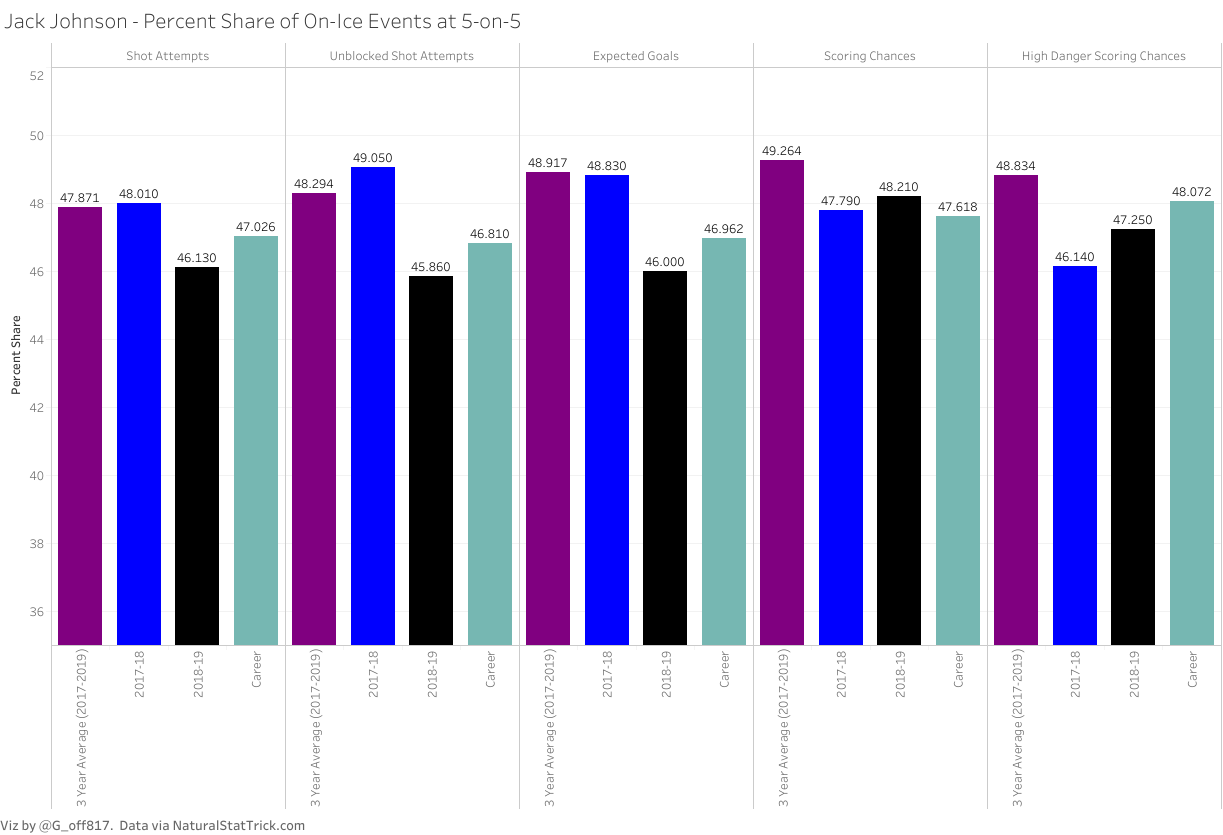
What we see here is pretty glaring: If his final season in Columbus was supposed to be his lone “bad year,” then there is no explanation for this season, which fell way short nearly across the board of his career average and certainly of his final season with Columbus.
Ultimately, what we got out of Jack Johnson this season is exactly who and what he is as a player, as evidenced by the 10+ years of data on him, and no amount of coaching or surrounding him with better players seems to be able to change that.
“He’ll be better with Better players and better coaching”
That said, it’s hard to imagine a world where this isn’t true, considering the Penguins employ Sergei Gonchar and Jacques Martin, two of the smartest defensive minds in hockey. Let’s not forget, these two were both credited with the resurgence and rejuvenation of the careers of Trevor Daley and Justin Schultz and a huge reason why they were such an impact during the back-to-back runs.
But, as it turns out, under their tutelage (as we saw above), Johnson did not improve with better coaching.
But what about playing with better players?
Well, last season, Johnson skated 1321:15 at 5-on-5. Of that, he spent 300+ minutes with each of the following: Phil Kessel (402:40), Justin Schultz (383:37), Marcus Pettersson (376:54), Sidney Crosby (371:51), Jake Guentzel (370:45), and Evgeni Malkin (365:43), while skating 294:25 with Patric Hornqvist. We talked at length earlier this offseason about his impact on Malkin (here) and Kessel (here), but the results for the rest of these players and the rest of the Penguins holds just true as it did with Geno and Phil.
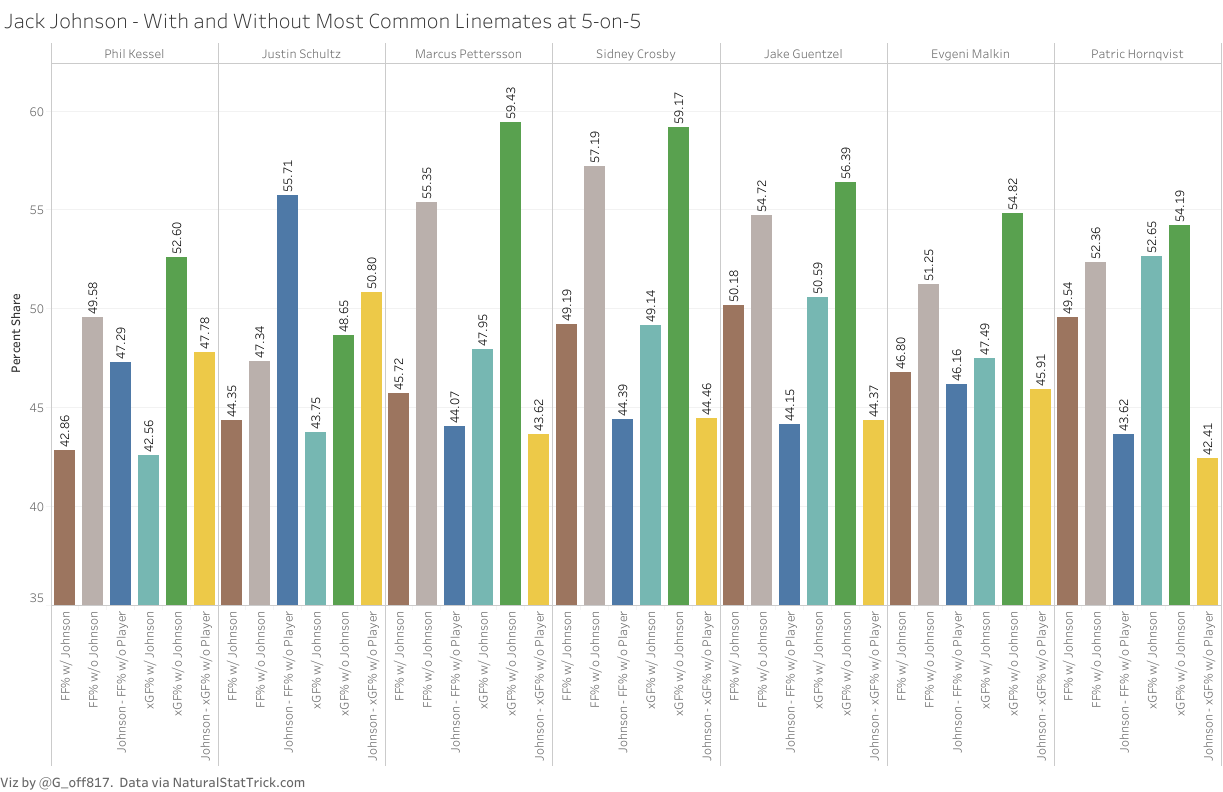
Simply put: Jack Johnson’s impact on the individual players was noticeably bad.
In every single case above, which largely held true for the rest of the Penguins players, we see a substantial jump in shares of unblocked shot attempts and expected goals when these players are away from Jack Johnson. In fact, in both shares of unblocked attempts and expected goals, each and every one of these players, with the exception of Justin Schultz (who was quite poor this season on his own), saw their percentage jump well above the 50% threshold.
In other words, when they were away from Johnson, they were generating more unblocked attempts and quality looks at the net than they were allowing.
And consider this: of every single Penguin skater that saw more than a half hour of 5v5 ice time with Johnson (27 in total), only Jake Guentzel (50.18% in 370:45 TOI), Dominik Simon (50.53% in 270:40 TOI), Kris Letang (51.28% in 133:54 TOI), Carl Hagelin (55.28% in 78:52 TOI), and Daniel Sprong (50.85% in 41:28 TOI) saw more unblocked shot attempts directed at the opponents’ nets than their own with Johnson.
In terms of expected goals under that same criteria, the list is no bigger: Jake Guentzel (50.59%), Patric Hornqvist (52.65% in 294:25 TOI), Dominik Simon (50.89%), Jamie Oleksiak (51.41% in 97:13 TOI), and Carl Hagelin (51.65%).
You’ll also notice that only 4 of those 7 players on the right side of 50% still remain with the Penguins.
What’s perhaps worse is the impact he had on the offensive side of the puck.
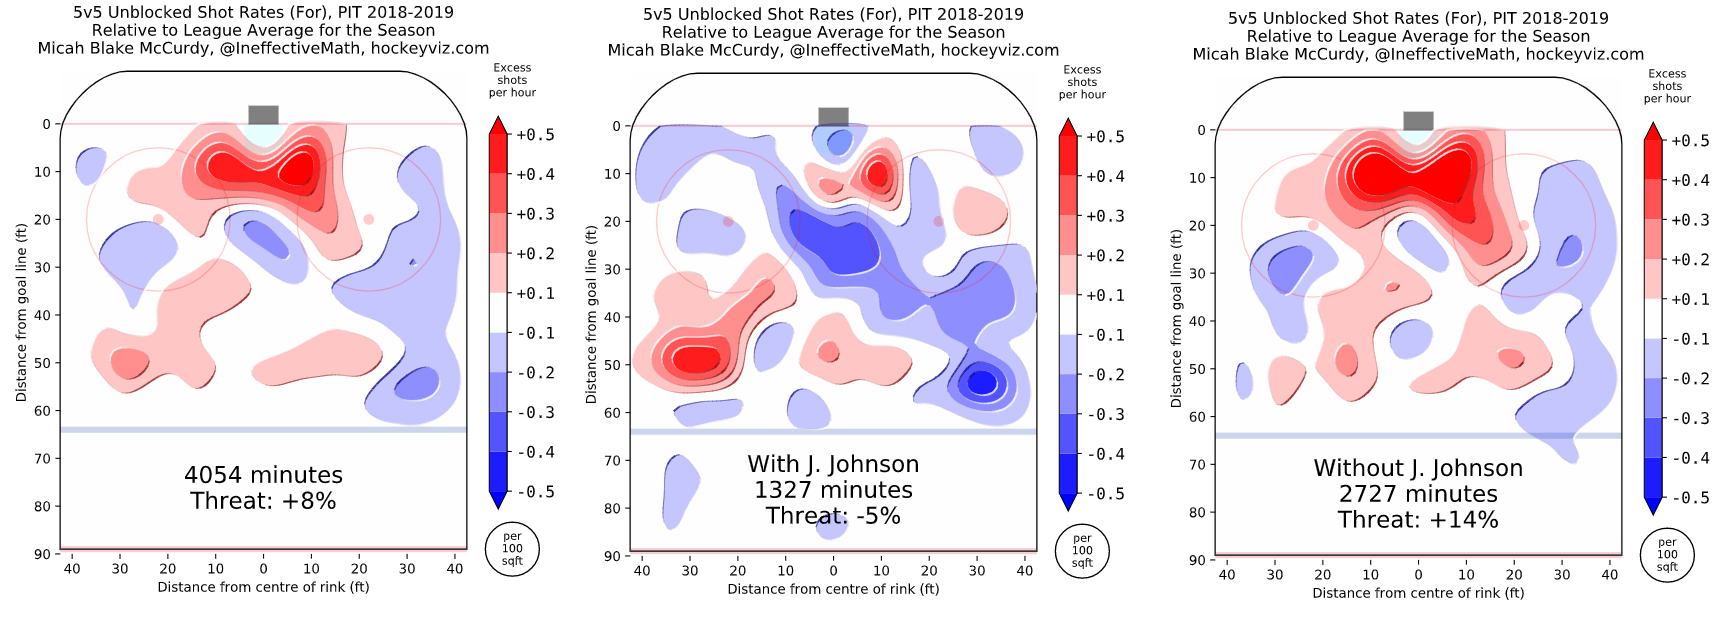
Here, we see (going from left to right) the Penguins unblocked shot generation as a whole on the season at 5v5, with Johnson on the ice, and without Johnson on the ice all relative to the league average as well as the respective Threat analysis.
Offensively, a positive Threat measure is good. Red means the Penguins were generating more unblocked shots from those locations compared to the league average, while blue means shots are being generated at a rate less than that of the league average.
The Penguins, as a whole, were good offensively last season and lived in front of the opposing teams’ goalies. This was amplified further with Johnson off the ice, jumping from a +8% Threat to +14% as the area in which they generated unblocked shots grew further and darker.
But with him on the ice, the Penguins did not generate nearly anything from in front of the net and, in fact, generated less than that of the league average. Worse yet, they saw themselves as a -5% Threat when Johnson was on the ice.
Put another way, as we saw with Kessel and Malkin, the Penguins offensive abilities were stymied and stifled with Johnson on the ice.
“He’s a solid, steady, physical defensive defenseman that makes the penguins harder to play against”
Admittedly, it’s hard to quantify “being hard to play against,” but one would have to imagine players that are difficult to play against are the ones that don’t allow much from the high danger areas of the ice.
As it turns out, from a shot location perspective, the Penguins were once again better without Johnson than with him.
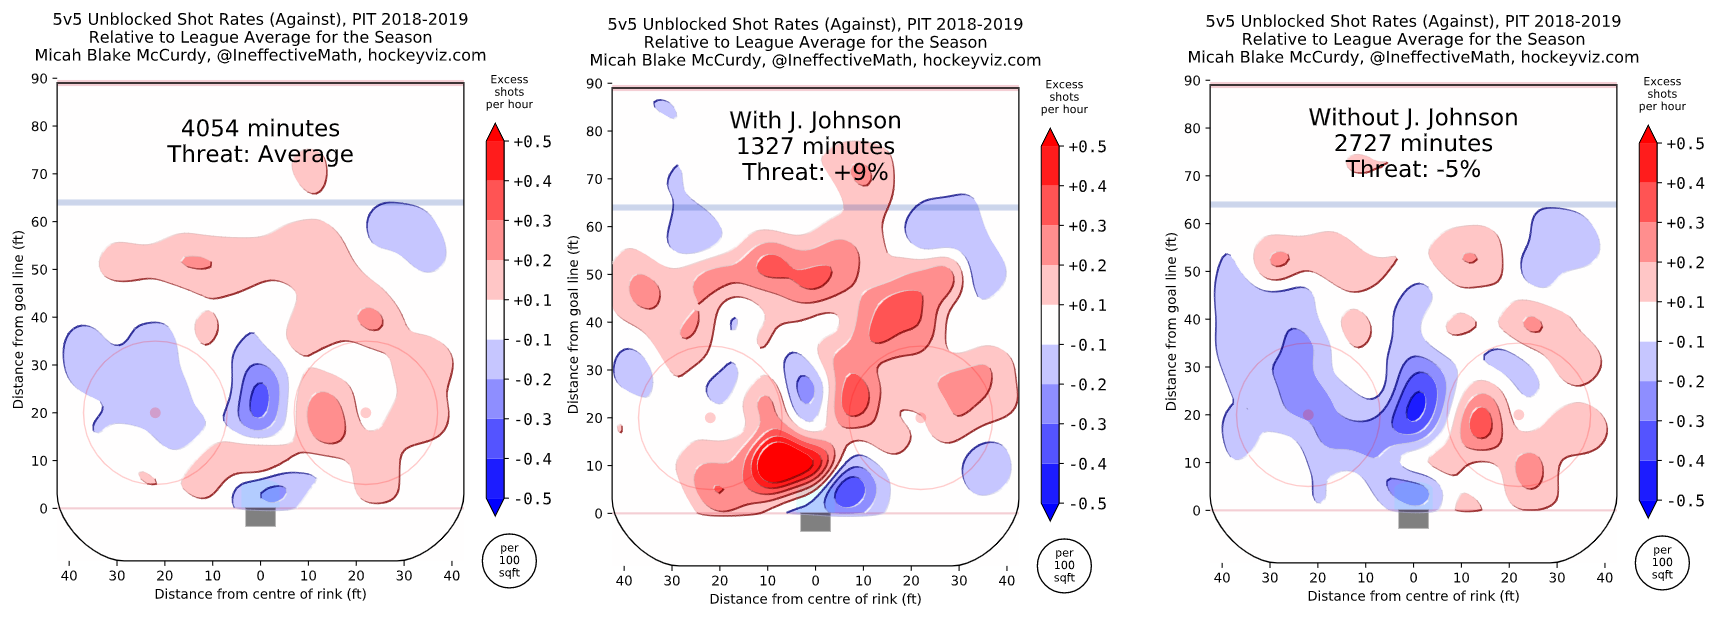
Here on the defensive side of things, a negative Threat is good. It means teams aren’t likely to be doing damage to you. Blue means the Penguins are allowing fewer unblocked shot attempts against compared to the league average while red means the opposite.
The Penguins as a whole (far left) were an average defensive team. They ended the season allowing slightly fewer unblocked attempts from directly in front of their goalies and in the high slot, but the mid-slot was a little problem area (only just). Without Johnson (far right), though, we see just how solid they actually were, holding teams to a -5% Threat and controlling nearly all 3 areas of the slot.
But the 5v5 time with Johnson (middle) was an absolute, unmitigated problem. Teams found success in the middle and left-of-middle slot locations and far more red than blue en route to a +9% Threat here.
When teams find it easy to generate shot against you from down low in particular as a defenseman, it’s seems pretty hard to consider that “being hard to play against.” This, too, without mentioning his propensity for pulling himself out of position to chase hits.
This is such a useless hit from Johnson on Svechnikov. This isn't being hard to play against. This is running a guy from behind after he's already moved the puck and putting your team at a literal disadvantage. FOH pic.twitter.com/NjUTrlfzmK
— nerd king geoff (@geoffwithano) March 20, 2019
Johnson tries to check Clutterbuck to the moon, gets dummied, and gives up a scoring chance instead of just defending like a normal human player. pic.twitter.com/ZXIvmUSpQb
— nerd king geoff (@geoffwithano) April 14, 2019
When you mix the quantifiable evidence of him hindering offense and being porous defensively, the end result is ugly. This holds true both relative to the league (as we saw above) and relative to the Penguins as a whole:
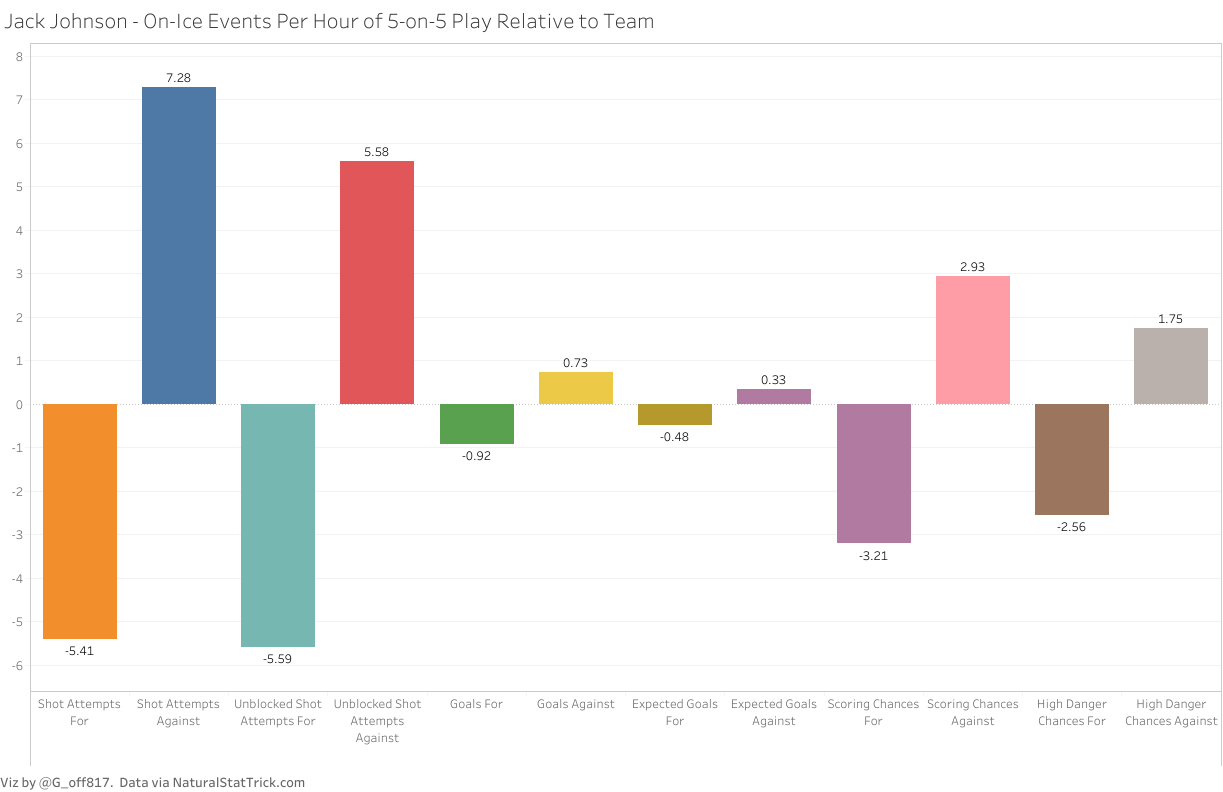
Relative to the team, we see exactly what happened when Johnson was on the ice compared to when he was off of it. Per 60 minutes of 5-on-5 play, the Penguins generated 5.41 fewer shot attempts, 5.59 fewer unblocked attempts, nearly one fewer goal scored, nearly half of an expected goal less, 3.21 fewer scoring chances, and 2.56 fewer high danger chances when Johnson was on the ice compared to when he was off of it. This should come as no surprise given what we saw above.
Similarly, per hour of 5v5 play, the Penguins were allowing 7.28 more shot attempts, 5.58 more unblocked attempts, just under 1 more goal against, about a third more expected goals, nearly 3 more scoring chances, and nearly 2 more high danger chances while Johnson was on the ice versus when he wasn’t.
That’s objectively bad.
And, in terms of the overall shares of these same data buckets, the picture gets uglier.
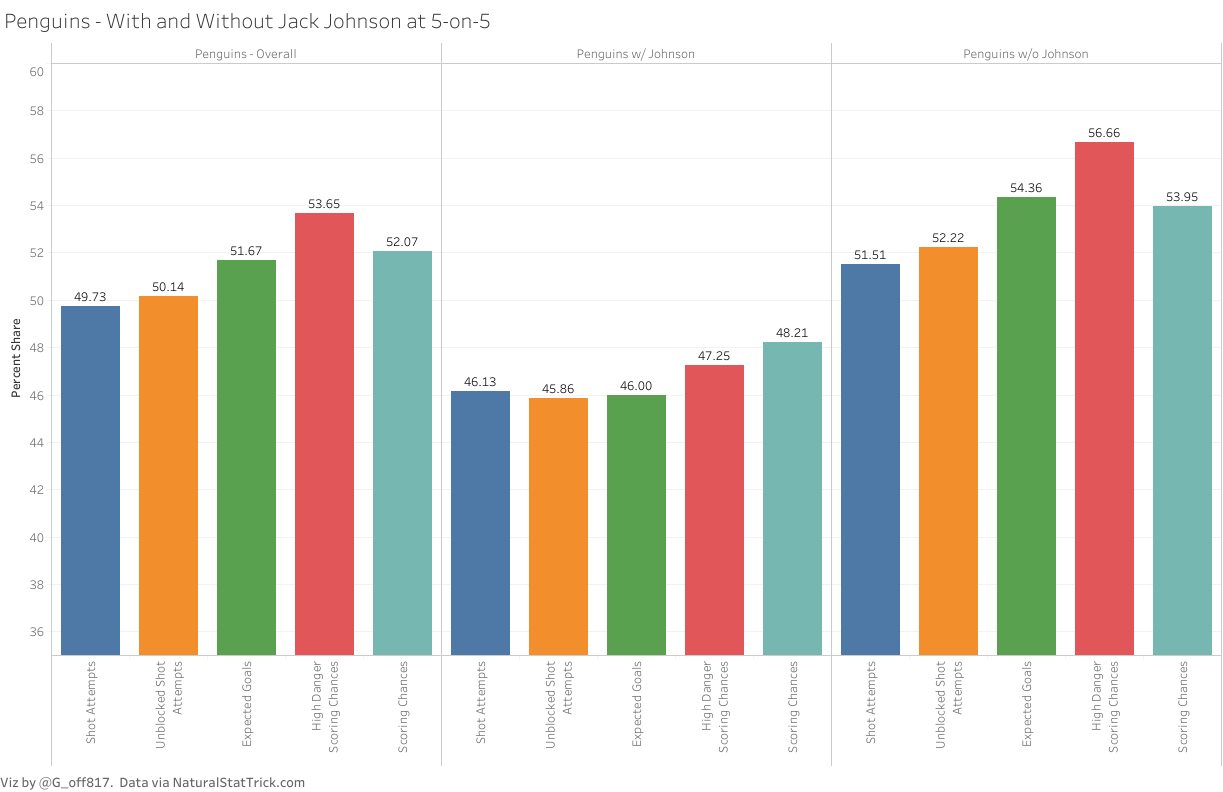
Similarly to the shot location charts above, here we have (from left to right) the percent shares of events that the Penguins controlled as a whole at 5v5, what they controlled with Johnson on the ice, and what they controlled with him off of the ice.
The results are overwhelming. Though the Penguins as a whole team were just north of 50% in everything but shot attempts, by simply removing Johnson from the equation, we can see just how freakishly dangerous they were.
For context, this is where those shares without Johnson rank versus this rest of the league:
| Category – Without Johnson | Rank – Without Johnson | Rank – Overall |
| Shot Attempts | 10th | 15th |
| Unblocked Attempts | 8th | 13th |
| Expected Goals | 4th | 10th |
| High Danger Scoring Chances | 1st | 6th |
| Scoring Chances | 2nd | 10th |
In other words, the Penguins as a whole with Johnson last year were very middle of the pack. Without him? Bordering on elite.
“He got better as the season progressed”
As the season wore on and the results got more and more damning, this became thread commonplace.
An interesting tidbit because, on the surface, he did “get better” as the season wore on in the sense that he wasn’t caught on the ice for as many goals against and that his “plus/minus actually improved.”
Ignoring the whole plus/minus argument, there is a single solitary reason that he was on the ice for fewer goals against late on: Matt Murray.
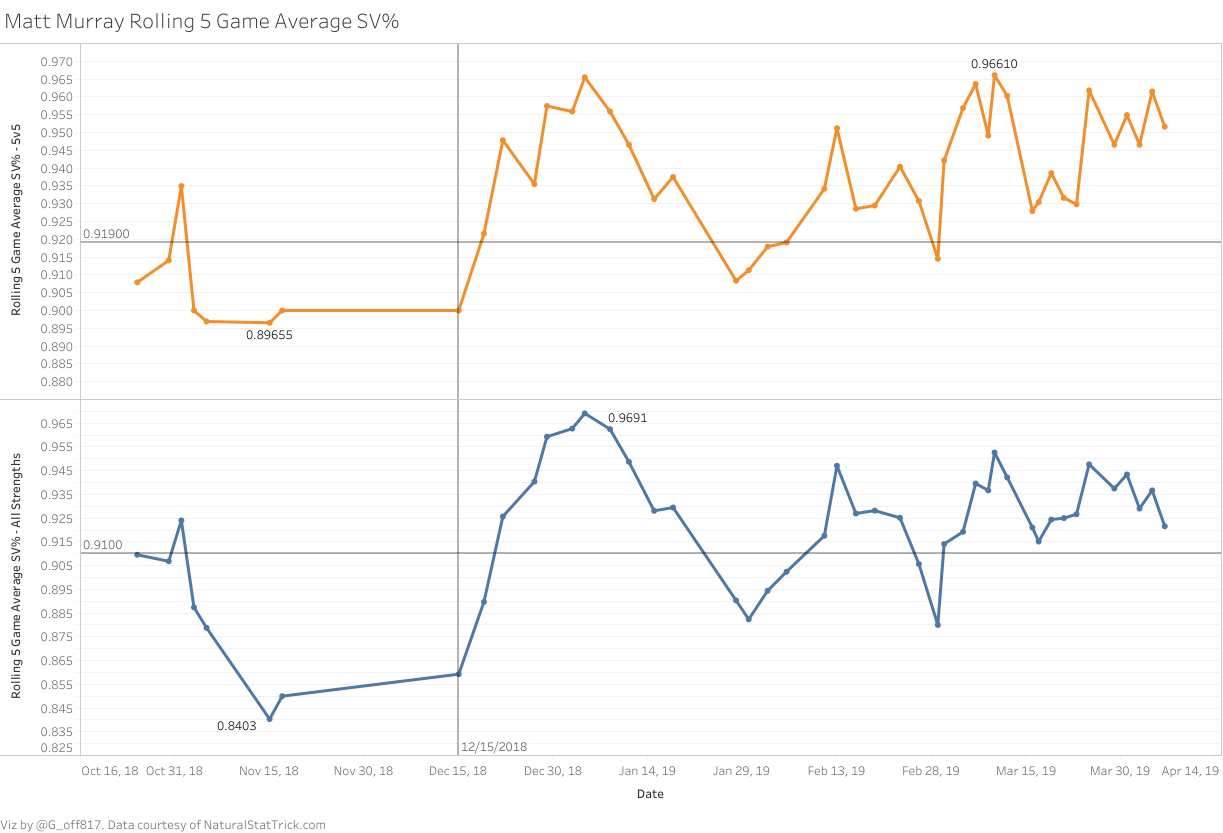
Murray’s brilliance following his stint on IR cannot be understated and, as you’ll see below, his impacted on stopping the puck while Johnson was on the ice can also not be understated.
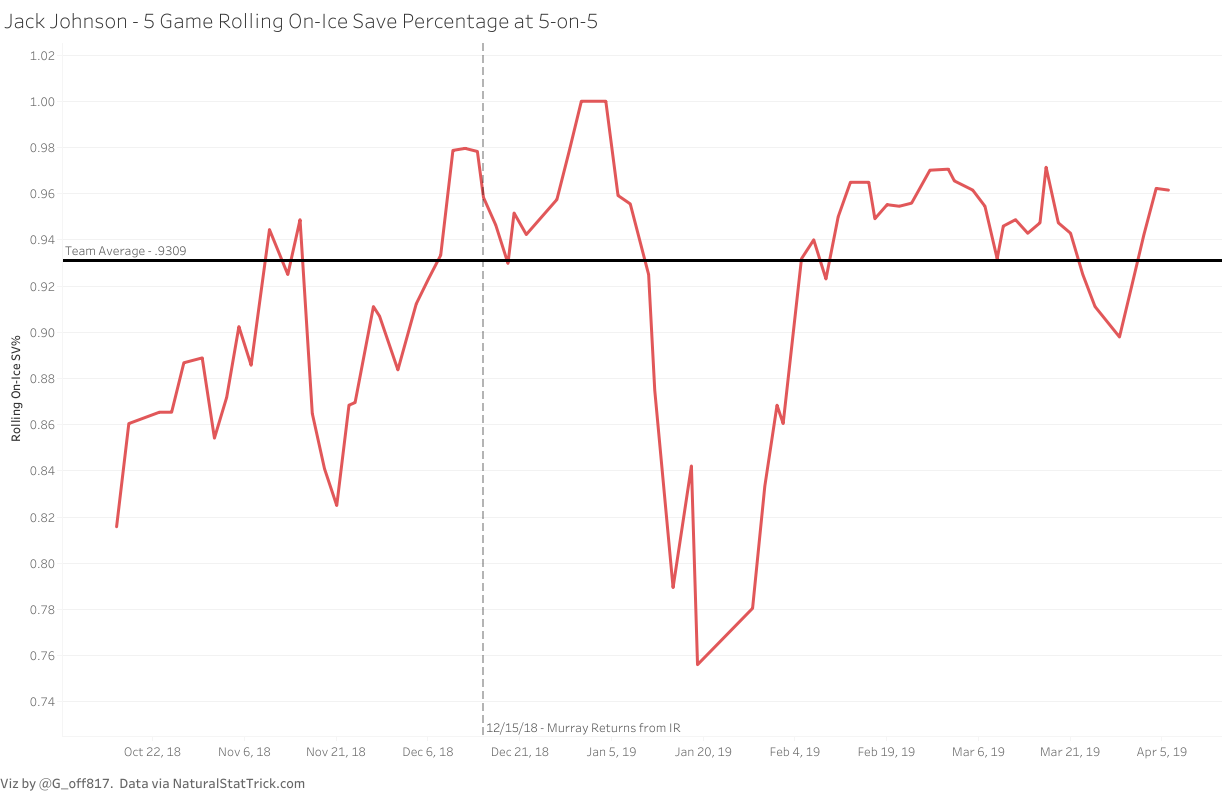
What stands out here are two things. First, Johnson had two stretches this season where goals weren’t going in against him at an alarming rate. The first came just prior to and immediately after Murray came back from injury. You’ll recall this stretch of games where Murr posted a .963 SV% across 8 games before coming back down to earth temporarily.
But by the end of January, he was back on top of the world. His rolling SV% above, in turn, matches up pretty well with Johnson’s rolling on-ice save percentage.
Matt Murray’s exceptional play covered up a lot of holes in the Penguins’ and Jack Johnson’s play in the final two months of the season.
With that in mind, and under the impression that Johnson did improve as the year went on, let’s take a look at his rolling share of expected goals and unblocked shot attempts at 5v5:
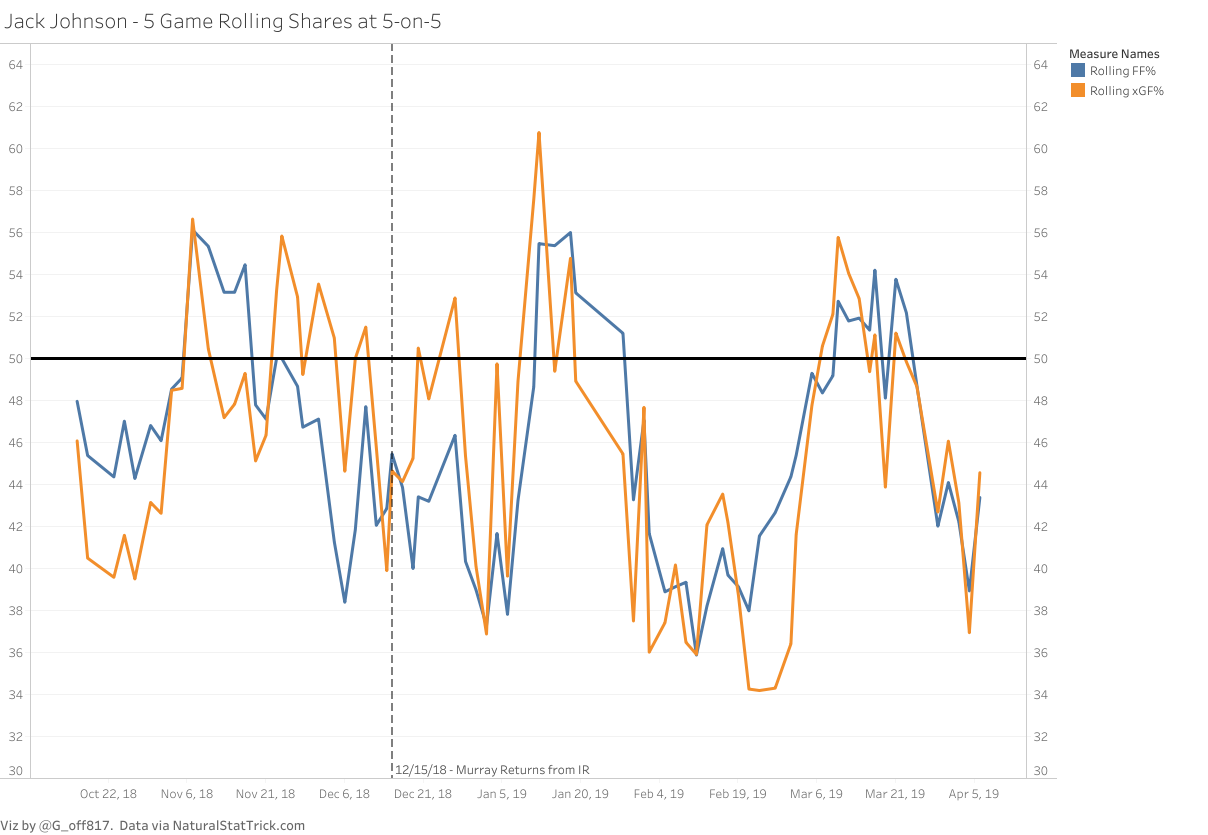
As it turns out, Johnson did have a few stretches this season where his head was above water and above the 50% threshold necessary to not be considered a liability, particularly early on in the season. Part of that can also be said to have occurred over a few week stretch from the end of February to the middle of March.
What doesn’t line up, though, is his on-ice SV% hovering around or above 96% between February 13th and March 17th while his expected goals share and unblocked shot attempt share sat around or below 40% for much of that stretch.
In other words (for the people in the back), Matt Murray’s exceptional play covered up a lot of holes in the Penguins’ and Jack Johnson’s play in the final two months of the season.
So what’s left for Jack Johnson and the Penguins?
If GMJR is to be believed, it appears that this is the blue line that he intends to roll into 2019-2020 with, for better or for worse.
The obvious issue with that is, currently at 32, Johnson isn’t an improving player. In fact, this season is evidence that he is actually probably declining as a player, making the prospect of 4 more years of even worse play all that more terrifying.
And, frankly, the Penguins are a flat out better team without him.
A simple solution would be to bury him and his $3.25M cap hit in the press box should a trade not present itself. It took until the 83rd game of the year and Maatta’s exceptional play down the stretch to make that happen and, with Maatta gone, the likelihood of that happening seems low.
Of course, this is assuming the status quo for next year. Perhaps we see Juuso Riikola adapt to the NHL and present himself as a viable solution on the left side next to one of Schultz or Gudbranson as Pettersson continues to grow and develop into a really solid 2nd pair player.
And perhaps Riikola’s skating ability alone makes Johnson more expendable than he already is, but the fact remains that until Jack Johnson is no longer on the ice for the Pittsburgh Penguins, they will continue to have issues being a dangerous team while he’s on the ice.
And for a team that isn’t getting younger, that’s a frightening proposition.
All data herein provided via Natural Stat Trick unless otherwise noted.
Add The Sports Daily to your Google News Feed!