One of the more interesting theories that I have read about over the years in baseball is that, more than anything else, the determining factor in whether a league runs high on offense or pitching is the total number of teams and total amount of available players. In times of a small player pool (as happened pre-integration and during both World Wars), pitching tends to dominate and as leagues expand in teams and available players, hitting tends to increase. While other aspects have often been credited with this phenomenon, it goes far to explain the increase in offense in the 1930’s, decrease in the 1940’s, extreme decrease in the 1960’s and extreme increase in the 1990’s.
While I’ve written on the topic previously in the generic, there may be a very specific example going on currently that hits right where I live, the Arizona Rookie League.
When it began 1988, the AZL consisted of four teams, the Athletics, Brewers, Padres and a Mariners/Red Sox combo squad. The league grew slowly, and by 2008 still had just nine teams, all for teams with Cactus League spring training facilities. The Indians were added in 2009 and the Reds in 2010, but it wasn’t until 2017 that the Padres broke the mold by adding a second team. The Indians, Giants and Cubs copied that move in 2018 and in 2019 there are an incredible 21 different AZL squads.
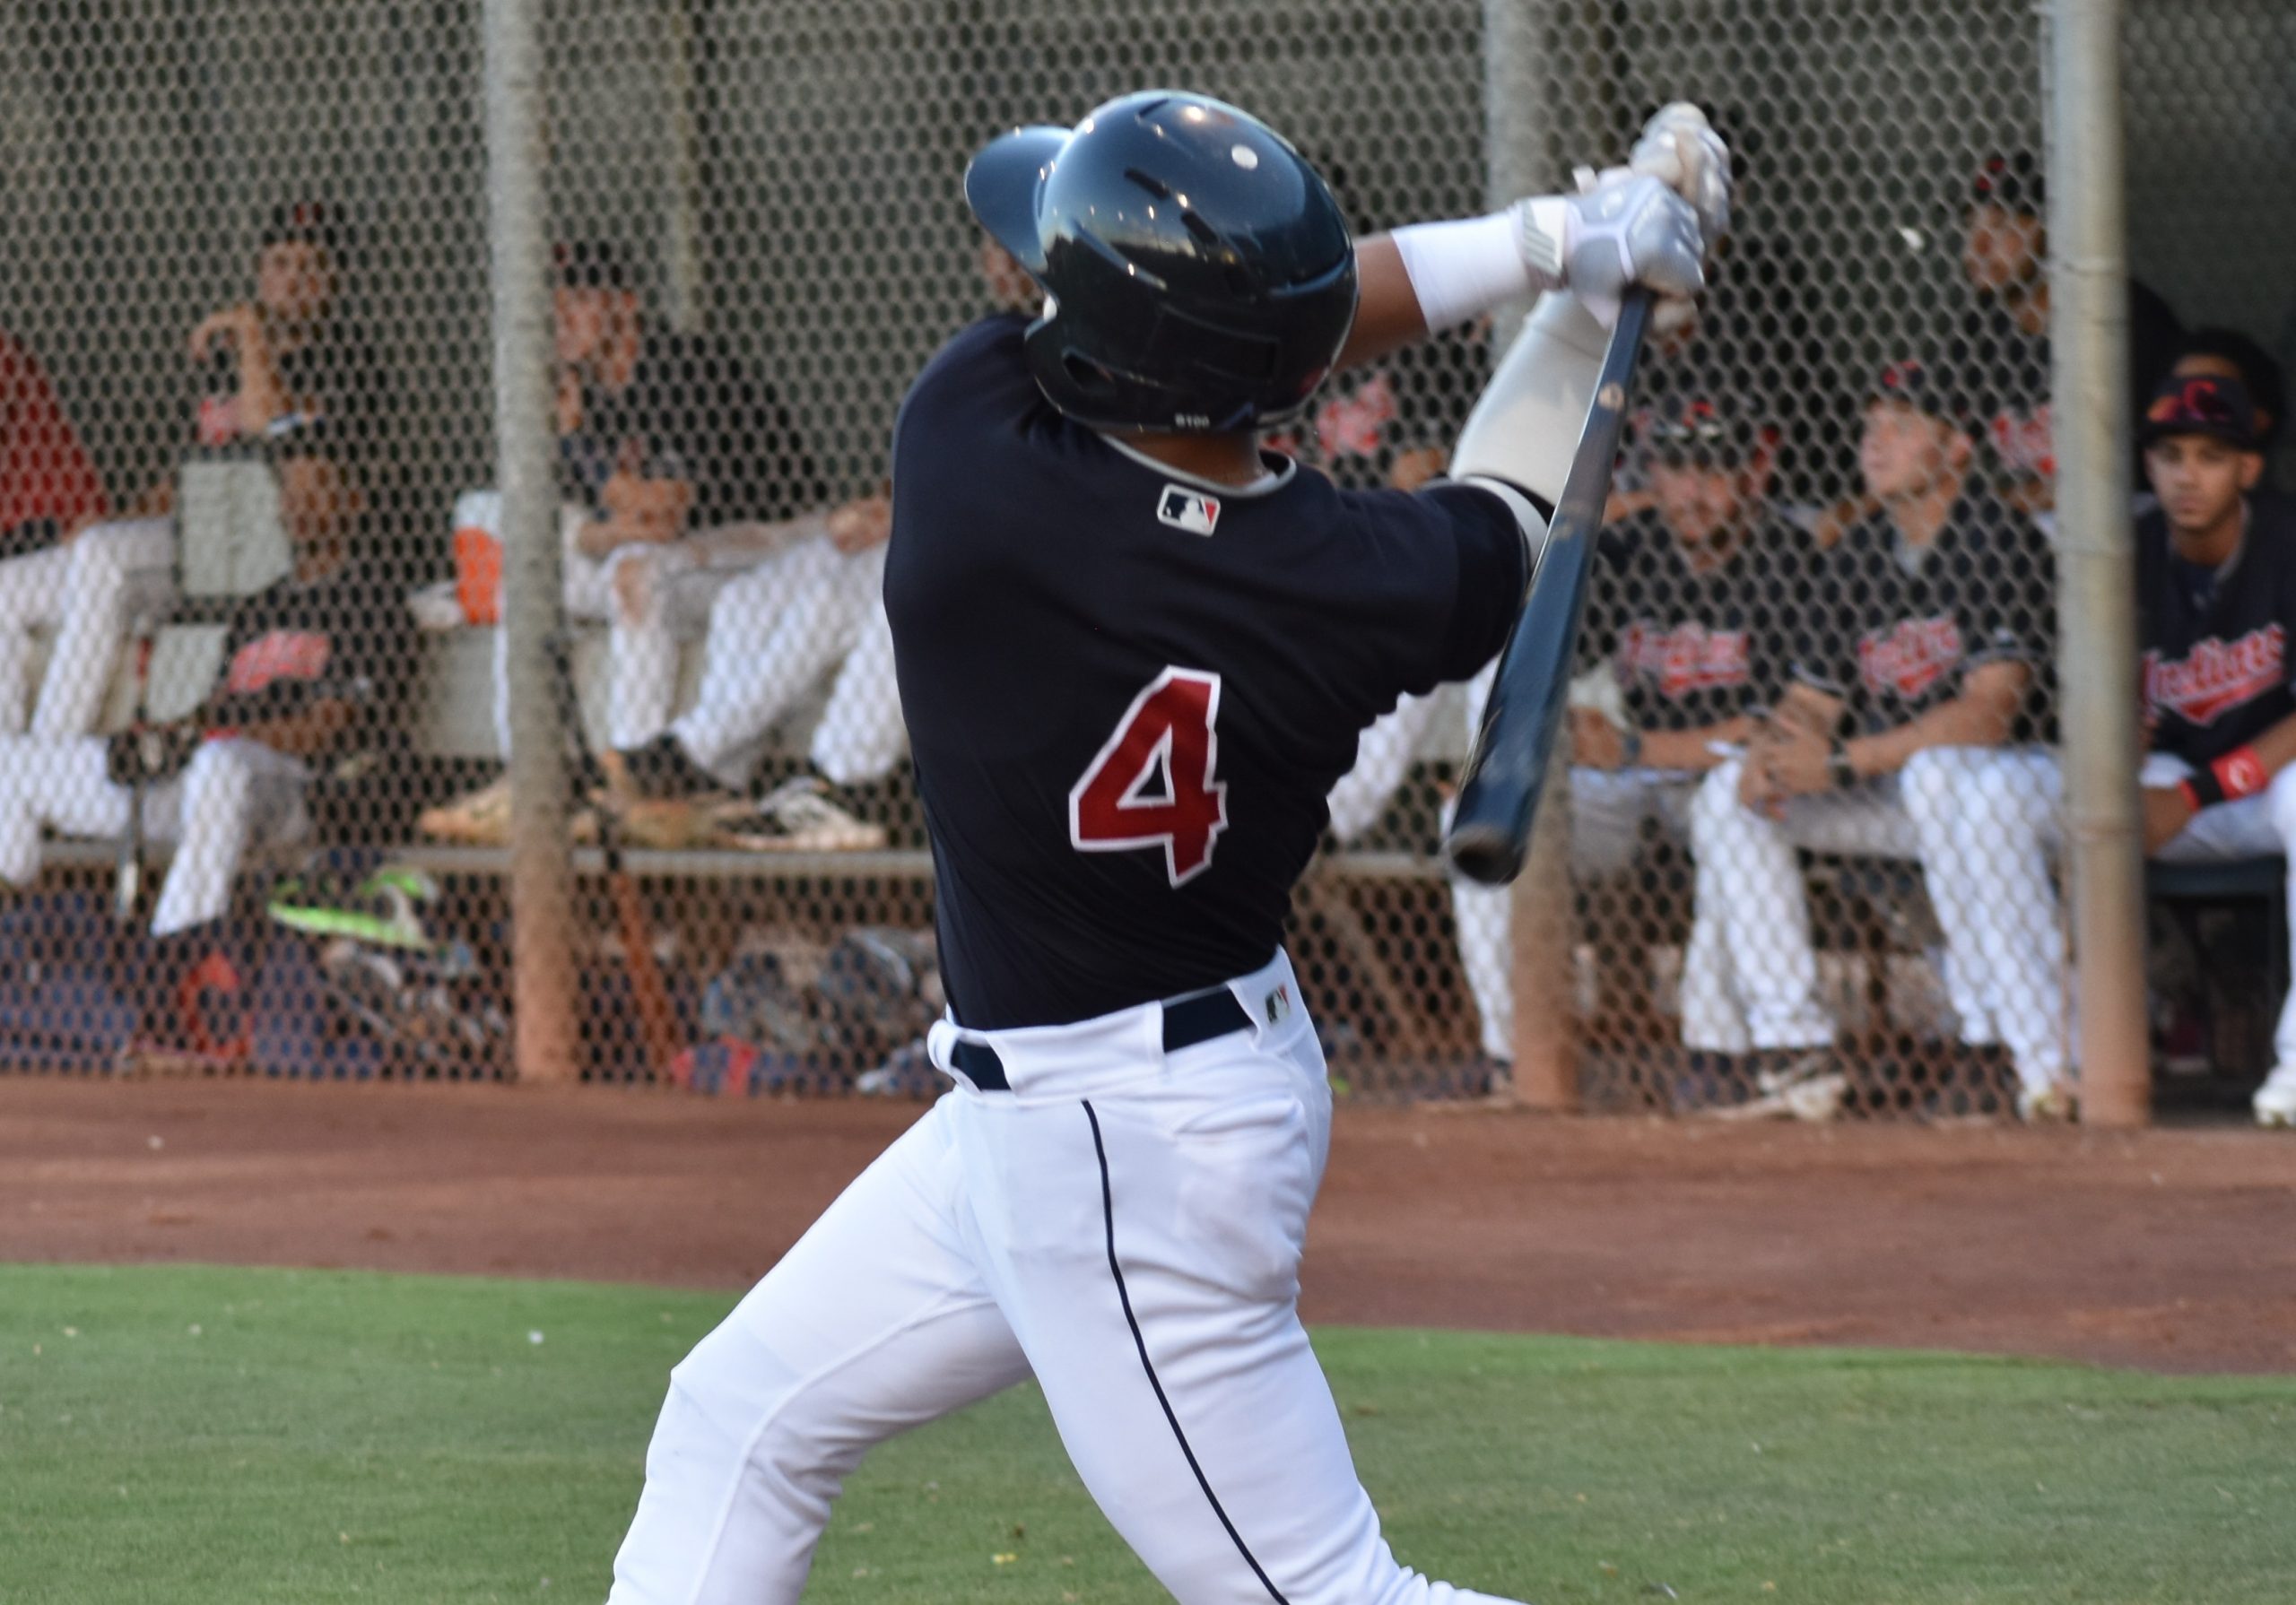
The first thing that caught my eye statistically was the extreme amount of dominating relief pitchers the Indians had drafted or signed in the last two seasons. Looking at every pitcher who has ever thrown at least 20 innings with any Indians AZL team, the 2018 squads featured the second (Sergio Morillo), fifth (Kellen Rholl), sixth (Shane McCarthy), 13th (Jerson Ramirez), 14th (Ignacio Feliz), 16th (Yeffersson Yannuzzi) and 24th (Eli Lingos) best seasons by ERA. Already in 2019, the Indians have Brauny Munoz (1.29 ERA), Jhon Vergara (0.84), Matt Waldron (0.90), Andrew Misiaszek (1.08) and Wilton Sanchez (1.23) all having dominant seasons with at least seven innings pitched (all stats through July 4th).
At the same time, it isn’t just the Indians pitchers that are dominating, but hitters all over the league. There are currently 19 qualified hitters who are slugging over .600 including Alexander Canario (Giants Orange, but has since promoted to short season A ball) who is slugging 1.000 and both Yainer Diaz and Julian Escobedo of the Indians Red and Blue respectively. To analyze the league as a whole to see how out of whack things are, I took a look at the wRC+ of all qualified hitters in the league since 2006 (as far as fangraphs goes back).
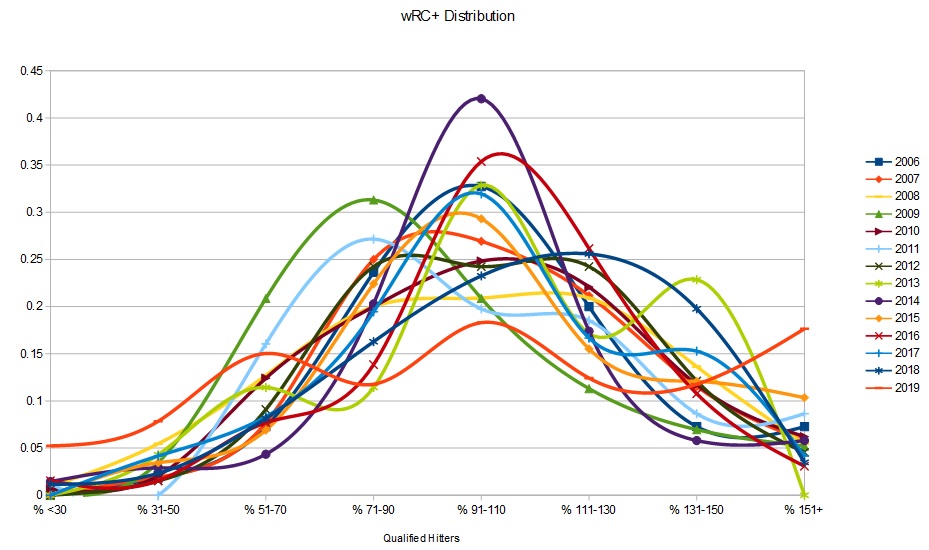
The chart above breaks hitters into groups based on their wRC+, starting with those with a mark under 30 and ending with those above 151. For those who do not know, wRC+ is an all-encompassing offensive stat that is weighted so the league average is always 100. This means a player with an 85 wRC+ is 15% worse than the average player and one with a 115 wRC+ is 15% better. Breaking this up into even groups should end up with a normal distribution like a bell curve. The chart is a bit jumbled, but 2014 is the best example of this with most players being around 100 and very few at the extremes.
If you can make out the orange line that is 2019, you can see that it is about as close to a straight line as you could get in this situation. Of the qualified hitters, 17.6% have a wRC+ above 150 while 18.3% are between 91 and 110 and 15% are between 51-70.
On the other end of the spectrum, the eight players (of 153 qualifiers) who currently have a mark below 30 are the most in both total (the previous record was one) and percent (5.2% compared to a 1.5% max in 2016). This means you can say three things definitively about this season. There have never been this many great hitters before, there have never been this many terrible hitters before and there have never been this few average hitters.
Before going any further, it’s important to point out the small sample size here. We are nearing the half way point of the season, but these numbers will certainly normalize some. The best players will be promoted (like Canario) and won’t qualify at the end of the season, so some of those outliers will be removed. In addition, this league is more about developing players than winning, so those on the lower end of the spectrum will continue to get regular playing time and will likely come back to the middle a bit.
That being said, I do believe there is a significant effect to the league’s statistics from the increase in team number. There has not been an increase in player pool by opening up new markets, so essentially all of the players on the eight teams added since 2014 would not have been playing professional baseball a decade ago. Teams are signing more and more international players, more late round draft picks and retaining mediocre players for longer periods, leading to farm systems that are much larger than any point in history. The best players were always going to get a place to play, so it leaves it to be inferred that these extra players (let’s say about 240 in the AZL alone since each team carries more than the normal 25 man roster) would not have been good enough to be professional baseball players ten years ago, but are now being benefited by extraordinarily large rosters.
This leads to a situation similar to the one that has been going on in the Dominican Summer League. Players who are above average simply over match the many players who shouldn’t even be in the league and accumulate extremely gaudy numbers while those on the lower end of the spectrum are made to look even worse. While I don’t want to name these specific players, I don’t think it’s random chance that the worst four players in AZL history (by wRC+ since 2006) are playing in 2019 and 10 of the worst 18.
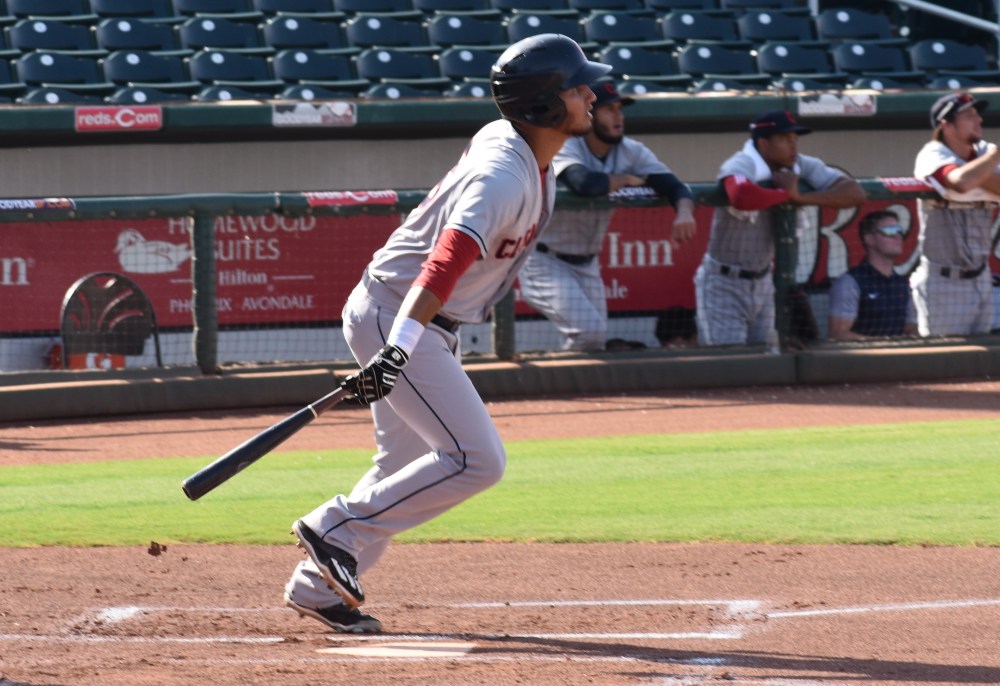
There are examples abound (I use wRC+ because it is the best overall judge), but another extreme one is the home run record. Joey Gallo has always been a monster masher and set the league record at 18 in 2012. Prior to that, only two players had reached 10 home runs in the AZL. Last year, both Miguel Jerez (14) and Billy Wilson (10) did so for Cleveland. This year, Canario hit seven in ten games and, while he is no longer in the league, his former Giants Orange teammates Marco Luciano and Connor Cannon, Jose Rodriguez (White Sox), Zac Taylor (Dodgers Mota) and DJ Gladney (White Sox) are all on pace for double digits this year.
On the pitching side, 17 starters have thrown at least ten innings and have a K/9 above ten including Mariners’ Danny Chang, who has struck out 46% of batters faced. Seven of the top 11 pitchers in K/9 since 2006 are currently pitching in 2019 including the Royals Emilio Marquez who currently has a mark of 14.1 per nine. The Dodgers Hyun-Il Choi is very literally having an unprecedented season with a 12.4 K/9 and 0.5 BB/9.
The point of all this is more than to point out some statistical oddities. It does the best players no favors to face so many who shouldn’t be there. After his MVP season last year, Miguel Jerez was promoted to A ball where he has an OBP below .300 and a SLG below .400. After his incredible rookie year, Billy Wilson is currently hitting .136/.224/.227 in short season. Maybe this pair is simply down on their luck, but maybe I (and those who voted for the AZL MVP in 2018) overrated these players based on their gaudy stats last year. With so many players putting up incredible stat lines, at some point we have to stop thinking about how many great players there are and start thinking about how many terrible players there are.
A hitter who faces an amazing pitcher once every three at bats can put up prolific numbers even if he never hits the special prospect. A pitcher who faces a line-up full of never will bes can give up solo homers to the top power hitters and still look amazing. This gives us extremely little information on how these players will look later in their careers and can give a ton of false hope.
The teams analyzing these players can look beyond the stats, basing their opinions on internal metrics like spin rate, launch angle and exit velocity, but those outside of the organization can’t see those numbers and are left looking at a bunch of probable record setters and those they are pounding into the ground to set those records.
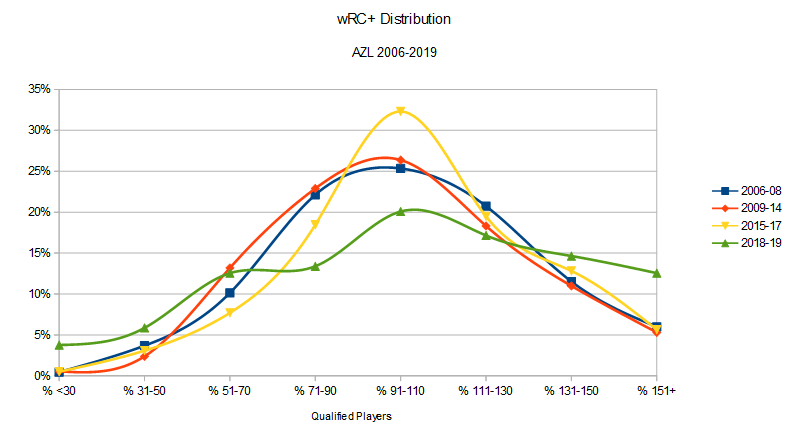
Because the chart posted earlier can be difficult to read, I’ve combined the seasons together to form another one. I don’t particularly like to do this as wRC+ is normalized for each season, so can’t really be compared from year to year. The groupings above were chosen because there were nine teams between 2006 and 2008, between 11 and 13 from 2009 through 2014, between 14 and 15 from 2015 through 2017 and there have been more than 18 each of the last two years. This makes it much easier to see the normally distributed bell curve in the first three groups and the strange, almost flat distribution over the last two years.
Add The Sports Daily to your Google News Feed!