As every NHL head coach would tell you, winning in the NHL is difficult. Hockey is inherently random. A team can dominate every facet of the game and still end up losing. Sometimes a bizarre deflection ends up in the back of the net. Sometimes the other team’s goalie plays out of his mind. These are a few things that give every NHL team the opportunity to win on any given night. That’s why they play an 82-game schedule (among other fiscal reasons).
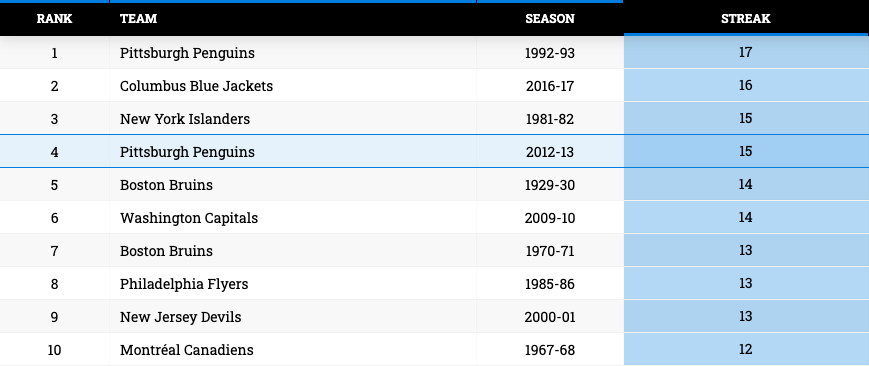
When a team can put together a string of six or seven wins, the streak starts to get media attention. That makes the Pittsburgh Penguins‘ undefeated month of March in 2013 an incredible feat. Their 15 consecutive wins tied the 1981-82 New York Islanders for the third longest winning streak in NHL history.
The Penguins franchise also owns the longest winning streak in league history, set by the 1992-93 club that was defending back-to-back Stanley Cups. The following is a list of the 10 longest winning streaks, via NHL.com.
Unfortunately we don’t have access to data that would allow us to do an in-depth analysis of the Penguins’ streak in 1993, but we do have the data to do it for the streak in 2013.
What’s the point of analyzing one of the longest winning streaks in NHL history? First of all, why not? Second of all, winning is great, but as I mentioned earlier, the better team doesn’t always win. It’s important to avoid getting too drunk from a win or a loss when doing analysis. Sometimes bad teams get lucky for a string of games and get a streak going.
The 2018-19 Buffalo Sabres went on a 10-game winning streak that convinced their fans they were playoff-worthy. The truth is that the Sabres were largely riding the coat tails of goaltender Carter Hutton and newly-acquired winger Jeff Skinner.
Hutton appeared in eight games during the 10-game winning streak. He saved 3.5 goals more than expected of him over that time.
Skinner, who was acquired the previous offseason from the Carolina Hurricanes, scored 10 goals during the streak. His shooting percentage was a ludicrous 32.2%. Aside from forward Tage Thompson, no other Sabres player scored more than twice during the streak.
Nine of the Sabres’ wins were one-goal games. Seven of those games required overtime or a shootout. Despite continuing to win, that isn’t a recipe for season-long success.
If none of that is enough to convince you the Sabres were over-performing, their 43.26% expected goals share at 5v5 should. That mark was good enough for dead-last in the NHL during their streak. Even when looking at all situations expected goals, the Sabres still fell below 50% and in the bottom-half of the league.
Did the Penguins dominate their opponents in March of 2013? Or was their streak just smoke and mirrors, like the Sabres in late 2018?
Similarly to the Sabres, nine of the Penguins’ 15 wins during their streak were one goal games. Three of those games required overtime or a shootout.
However, the similarities stop there. Unlike the Sabres, the Penguins were strong on special teams, controlled play in a significant way at even strength and suffocated the offensive generation of their opponents.
The most impressive part of the Penguins’ streak was their team defense. The defense corps of Kris Letang, Brooks Orpik, Mark Eaton, Deryk Engelland, Paul Martin, Matt Niskanen and Simon Despres isn’t awful by any means, but it’s far from a group of shut-down guys. (No, Orpik was not as good as you think he was, and in fact, he was actually bad).
Expected to give up just 1.89 goals against per hour at all strengths, the Penguins somehow outperformed expectations and only surrendered 1.67 goals against per hour. No other team in the league was expected to give up less than 2 goals against per hour during that time. Aside from the Columbus Blue Jackets (1.92), no other team gave up less than 2.2 goals against per hour.
Interestingly, despite limiting their opponents’ quality chances, the Penguins were league average in terms of suppressing shot attempts. Penguins goalies faced 54.89 shot attempts per hour, nearly 15 more attempts per hour than the league-leading New Jersey Devils during the month of March.
At the other end of the ice, the Penguins were good at creating quality offense, but not elite. Their 2.59 all situations expected goals for per hour ranked them ninth in the league during the month of March, a far cry from the league-leading New York Islanders (3.05).
The Penguins exceeded their expected goals for totals and scored 3.4 goals per hour, a strong rate. They trailed only the Minnesota Wild (3.45) and Chicago Blackhawks (3.54).
The Penguins were able to exceed their expected goals totals, in large, thanks to Sidney Crosby‘s finishing and incredible playmaking ability. Here’s what his month looked like:
Box Score
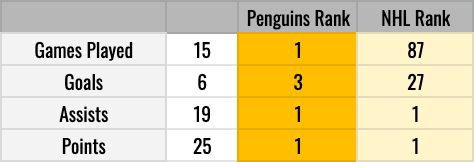
On-Ice (5v5, minimum 100 minutes)
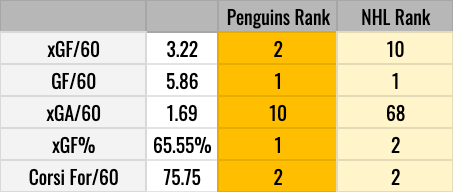
Crosby’s month was absurd, but he wasn’t the only Penguin who dominated. If you were thinking the player on the Penguins that was on-ice for more shot attempts and expected goals for than Crosby was Evgeni Malkin, you’d be wrong.
Malkin appeared in just five games during the month, scoring twice and adding three assists. His on-ice impacts were incredible as his expected goals share was rocking at 65.39%, but who is the mystery player? I’ll give you another hint; it’s not Letang either.
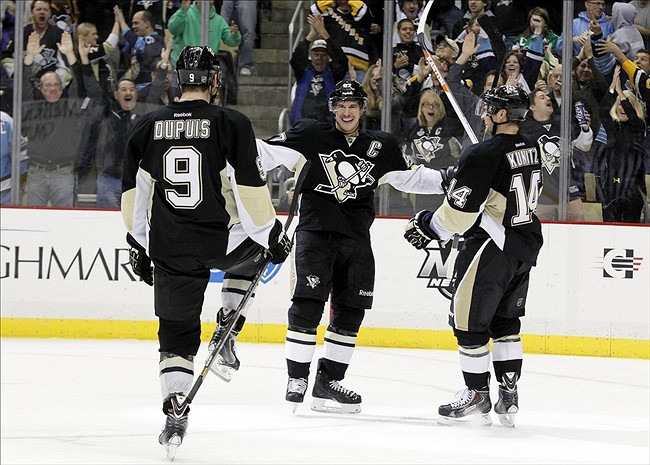
The answer is Chris Kunitz. Kunitz and Pascal Dupuis flanked Crosby for the duration of the winning streak and it was a nightmare for the opposition. Both wingers had remarkable months, but Kunitz’s was slightly more impressive.
Kunitz not only outpaced Crosby’s shot attempts for and expected goals for per hour, but he scored 11 times, shooting an asinine 30.56%. Dupuis potted 10 goals himself, converting on 15.62% of his shots.
Below is a chart from @JFreshHockey on Twitter. The chart is a Wins Above Replacement (WAR) per 82 games played percentile timeline that is meant to show how many wins a player adds versus a replacement-level player. Kunitz (98th percentile) and Dupuis (95th percentile) both peaked during the 2012-13 season, their play during the month of March being a big reason why.
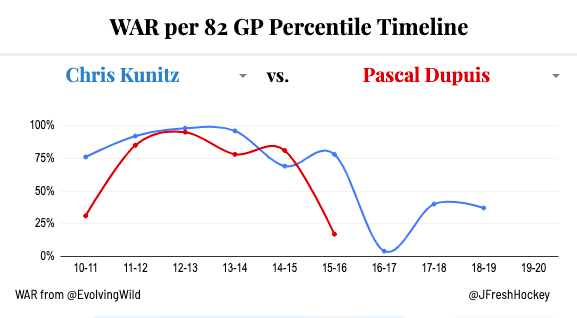
Getting 24 goals out of Chris Kunitz and Pascal Dupuis in a 15-game span might be the most incredible thing Sidney Crosby has ever done.
Another player that deserves some credit is winger James Neal. He scored 5 times playing in all 15 games. He added 7 assists alongside an impressive 59.89% expected goals share.
Oft-injured winger Beau Bennett tallied a goal and six assists (five of them were secondary) in 12 games. His on-ice impacts were less than stellar, especially relative to his teammates. The only Penguins to have a worse shot attempt share than Bennett (46.64%) were Brandon Sutter (46.59%), Craig Adams (45.92%), Dustin Jeffrey (45.07%) and Eaton (46.15).
On the back-end Letang paced the defense with a 62.23% expected goals share. Playing in only 10 games, he didn’t score, but added 13 assists and led the Penguins with a 58.89% shot attempt share.
Another defenseman of note is Despres. He played in 11 games assisting on two goals. His on-ice impacts were the best of any defensemen not named Letang. Despite the Penguins being expected to score 2.51 goals per hour at 5v5 with Despres on the ice, the number of actual goals per hour they scored with him on the ice was 1.53. The Penguins lit the lamp on just 4.33% of their shots on goal with Despres on the ice, a nod to the poor shooting talent of the Penguins’ bottom-six.
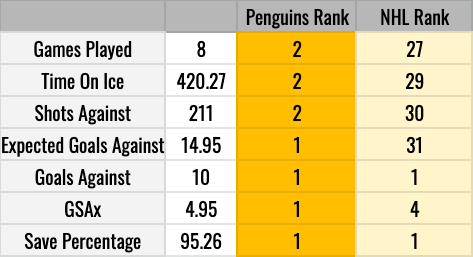
Moving on to goaltending. At the time, the Penguins employed both Marc-Andre Fleury and Tomas Vokoun. One goalie was brilliant over the course of the winning streak, the other had a strong save percentage but still allowed more goals than expected of him. Try and match the name with the chart. (GSAx = Goals Saved Above Expected).
Goalie A
Goalie B
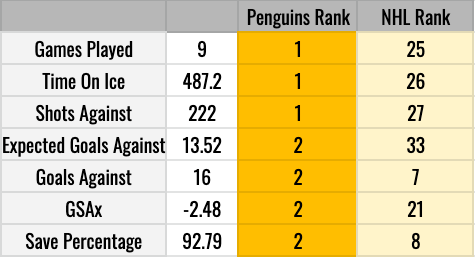
Goalie A is Vokoun and Goalie B is Fleury. Despite facing an easier workload, Fleury gave up nearly 2.5 goals more than expected of him. His save percentage was strong, but that just goes to show that traditional goalie stats don’t tell you much at all.
Vokoun was arguably the best goalie in the NHL during March and would have exceeded Kari Lehtonen‘s 8.31 goals saved above expectation had he started a few more games while saving goals at a similar rate.
The 2012-13 Penguins were a top-heavy team with an elite number one defenseman and inconsistent goaltending. Considering they had an all-time great player playing some of the best hockey of his career, it’s not hard to see why the Penguins were able to catch lightning in a bottle and go an entire month without losing a game.
The Penguins made an attempt to bolster their roster in late March by acquiring future Hall of Famer Jarome Iginla, Dallas Stars captain Brenden Morrow and defenseman Douglas Murray.
For reasons I won’t discuss, the Penguins were eventually swept out of the Eastern Conference Final by the Boston Bruins. The Bruins went on to fall to the Blackhawks in the Stanley Cup Final.
Thanks for reading! Let’s talk hockey on Twitter – follow me @shireyirving.
All data via Evolving-Hockey.com
Add The Sports Daily to your Google News Feed!