Pittsburgh finished their 49th regular season with 111 points, the second-most points earned by any Penguins team in franchise history.
How did their injury-plagued second-half stack up against other Penguins clubs in franchise history? More importantly, where does the entire 2016-17 season rank compared to other clubs of the Crosby-Malkin era, the Mario-Jagr era or even the Pierre “Lucky” Larouche-Ron Schock era?
Back in January, we presented a simple table comparing first-half records of all 49 Penguins teams since their expansion season of 1967-68. As the number of scheduled games, the post-regulation time format and the number of points awarded for the outcome of games has changed significantly over the years in the NHL, comparing points earned now to points earned in some past seasons is an apples-to-oranges comparison. To make apples-to-apples comparisons, it is necessary to adjust raw point totals to account for points earned from overtime losses and shootout games.
 To review, first-half adjusted team points records of all Penguins clubs were calculated with only regulation time and overtime wins earning two points. Any game that reached a shootout was counted as a tie, earning one adjusted point. This meant deducting one point for each shootout win. Losses in regulation time and overtime earn zero adjusted points, meaning we must take away the one point awarded for each overtime loss starting with games of the 1999-2000 season.
Essentially, this is how standings points were calculated before ties were abolished and shootouts implemented in 2005-06 and before overtime loss points were implemented in 1999-2000. We do note however, that teams pre-1983-84 did not have the benefit of overtime’s five extra minutes to try to earn wins.
For our look at the second-half, the exact midpoint of each year was considered the start of the second-half. For example, in a 78-game schedule, games 40 to 78 represented the second-half. In the lockout seasons of 1995 and 2013, games 25 to 48 represented the second-half. Then, after counting up all the wins, losses, ties and applying corrections for overtime and shootout games, adjusted point totals were calculated based on the present-day 82 game regular season schedule, to ensure a truly level comparison and easy-to-contextualize presentation of the data.
The first table shows adjusted point totals for all second-halves in Penguins history. The second table, further down the page, shows adjusted point totals for all full seasons in Penguins history. Remember, “ADJ PTS” are adjusted points per 82 games.
[office src=”https://onedrive.live.com/embed?cid=2A728A26A493C6FE&resid=2A728A26A493C6FE%21148&authkey=ADvIf2ubHN3Oe7g&em=2&wdHideGridlines=True&wdHideHeaders=True&wdDownloadButton=True” width=”380″ height=”400″]The 2016-17 Penguins finished tied for seventh-place in franchise history in terms of second-half performance. No doubt Ron Hainsey, Carl Hagelin, Bryan Rust, Evgeni Malkin, Kris Letang, Trevor Daley, Olli Maatta, Conor Sheary, Jake Guentzel, Patric Hornqvist, Justin Schultz, etc., etc., missing significant time prevented a higher placement. Sidney Crosby also missed six games at the beginning of the season with a concussion.
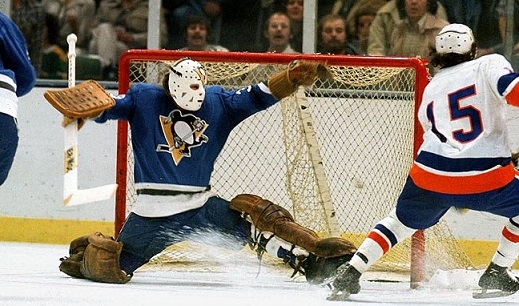
One of the more notable strong second-half teams on this list is the 1974-75 Penguins. That club was led by Jean Pronovost whose 31 even-strength goals was fourth-best in the NHL. The Penguins finished sixth overall in the 18-team NHL, their best finish in their eighth year as an NHL team. Making the playoffs for just the third time, they swept St. Louis in the best-of-three preliminary round before meeting the Islanders. The Pens jumped out to a three games to none lead before their scoring deserted them as New York won four straight including Game Seven 1-0 at Civic Arena, to become just the second team ever to overcome a 0-3 deficit and win a playoff series. (Sadly, the financially troubled club saw the IRS padlock the gates to Civic Arena shortly thereafter and the Penguins first bankruptcy proceeding was not concluded until 1979).
At the bottom of the list: If you lived through the last season pre-Lemieux and his rookie season, you lived through the statistically worst finishes in team history. I actually triple-checked the numbers on those two seasons, but yes, there is no mistake. Both seasons, 1983-84 and 1984-85, the Penguins second-half winning percentage was .188.
[youtube https://www.youtube.com/watch?v=EYhPREIOGGQ]More recently, the “X-Generation” era was truly D-Generation X, and those early 2000s seasons also populate the bottom of the table. What an awesome ad campaign in that video: Rico Fata is like Shawn Michaels and Michal Rozsival smashing people like X-Pac himself… “A new breed of Penguin hockey. Forged in ice and destined to dominate…” They must have meant dominate the top of the draft.
[office src=”https://onedrive.live.com/embed?cid=2A728A26A493C6FE&resid=2A728A26A493C6FE%21149&authkey=AIyG6MLJupd_6FM&em=2&ActiveCell=’Sheet1′!A1&wdHideGridlines=True&wdHideHeaders=True&wdDownloadButton=True” width=”380″ height=”400″]On the full season chart, the 2016-17 Penguins rank fifth-all time in team history. Unsurprisingly, the only club to win the Presidents Trophy, the vaunted 1992-93 club with their NHL-record 17-game win streak, remains the best Penguins club ever, after nearly a quarter-century. Also unsurprisingly, the 2013 Penguins club that ran the table in March with a 15-game win streak, comes in second.
This season’s club is one adjusted point behind the memorable 1995-96 Penguins of Mario, Jaromir and the equally great Ron Francis. There may never again be a trio in hockey history that end up combining for over 5,400 career points. Pensblog co-founder Derek once called 1995-96, “the greatest season of all time” on a podcast several years ago. I sensed he was only half-joking and I agree with him. That team was loaded with talent.
[youtube https://www.youtube.com/watch?v=VhMRGZ-7O0Y]68 in his stickhandling prime. 66 always knowing exactly where to go on the ice, finishing the tap-in – on his backhand. Best part is seeing the life drain from Mark Messier’s face. This was the series that ended with Lemieux and Jagr both netting hat tricks in the clinching game to eliminate the Rangers. If Francis doesn’t break his foot blocking a shot and the Florida Panthers weren’t blatantly molesting Mario and Jagr on every play, we would have had a Stanley Cup Final for the ages between the firepower of Pittsburgh and the firepower of Colorado Avalanche.
Final notes: all but one of the top 18 full seasons in franchise history are part of both eleven year playoff streaks (1991-2001 and 2007-2017). Never take for granted the quality of Penguins hockey we currently enjoy even during the inevitable rough patches in the next few weeks when we will want to melt down and scream at the Penguins.
Remember, it could be worse. It actually was worse… For example, finishing with 38 points in 1984, and people making documentaries three decades later to question whether your franchise illegally tanked to finish #1 in the draft.
[youtube https://www.youtube.com/watch?v=i-CRnk6fH0c]Add The Sports Daily to your Google News Feed!
