We’ve already said far too much about Josh Tomlin‘s position with the Indians, how long the Indians should stick with him and who his replacement could possibly be, so it’s time for a Tomlin appreciation piece. The fact is, Tomlin may be the greatest Indians pitcher ever in one really fun aspect.
On Tuesday night against the Cubs, Tomlin allowed his 150th career home run an impressive milestone for a pitcher with under 1,000 innings. Cumulatively in team history it ranks 8th (Bob Feller is the leader at 224), but the average amount of innings pitched by everyone other than Tomlin in the top 10 is 2,136 while Tomlin sits at just 841.
Before breaking things down further, the most simple way to look at home runs allowed is a rate stat (with 300 IP minimum) rather than the simple total and here we can see that Tomlin’s 1.605 HR/9 is second worst in Indians history to Scott Elarton at 1.632 and well above Ken Schrom‘s 1.576 in third place. In all, 27 pitchers in Indians history have had a HR/9 above 1.000 with at least 300 innings, but that isn’t to say that all these were subpar pitchers. Included in that list are 1980’s ace Greg Swindell, 1990’s ace Charles Nagy, 2008 Cy Young winner Cliff Lee, World Series heros Orel Hershiser and Chad Ogea as well as a few modern players in Danny Salazar, Trevor Bauer and Zach McAllister.
It shouldn’t be surprising that modern players take up the majority of the players with the highest home run rates as home runs have increased dramatically over the years. In fact, Mudcat Grant (1958-64) was the earliest pitcher of those above 1.000 with a large group from the 1970’s.
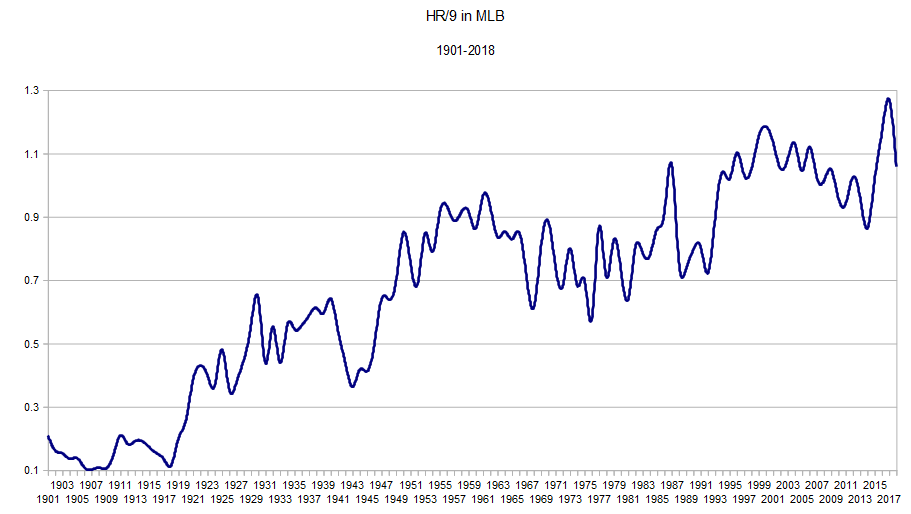
Below is a fun chart showing the league wide HR/9 from 1901 through last Monday.
As you can see, there was a huge rise in home run production in 1920 that, barring a period during World War II that saw pitchers take control, essentially continued through 2000. In addition, while 2017 was the greatest year in baseball history for home runs (and strike outs), the average during the rest of Tomlin’s career was actually lower than that of the previous decade. In order to sort this out, we need another, much more fun chart.
| Last | HR/9 | MLB HR/9 | Compared to AVG |
| Dunning | 1.324 | 0.778 | 170.1% |
| Schrom | 1.576 | 0.989 | 159.4% |
| Tomlin | 1.605 | 1.026 | 156.5% |
| Elarton | 1.632 | 1.063 | 153.6% |
| Ramos | 1.301 | 0.873 | 148.9% |
| Paul | 1.103 | 0.768 | 143.7% |
| Wilcox | 1.047 | 0.741 | 141.2% |
| Grant | 1.230 | 0.895 | 137.4% |
| Latman | 1.214 | 0.899 | 135.1% |
| Yett | 1.144 | 0.868 | 131.7% |
| Bailes | 1.136 | 0.868 | 130.8% |
| Byrd | 1.362 | 1.053 | 129.3% |
| Donovan | 1.059 | 0.862 | 122.9% |
| Clark | 1.122 | 0.977 | 114.7% |
| Niekro | 1.132 | 0.989 | 114.4% |
| Riske | 1.249 | 1.099 | 113.6% |
| Salazar | 1.119 | 1.055 | 106.0% |
| Ogea | 1.105 | 1.050 | 105.3% |
| Sowers | 1.103 | 1.052 | 104.8% |
| Jimenez | 1.018 | 0.975 | 104.4% |
| Bauer | 1.084 | 1.055 | 102.7% |
| Hershiser | 1.077 | 1.052 | 102.4% |
| Nagy | 1.005 | 1.004 | 100.1% |
| McAllister | 1.025 | 1.035 | 99.0% |
| Burba | 1.104 | 1.114 | 99.0% |
| Lee | 1.023 | 1.065 | 96.1% |
| Wright | 1.048 | 1.102 | 95.2% |
This lengthy list includes all of those 28 Indians pitchers discussed earlier who threw at least 300 innings with the team and had a HR/9 above 1.000. The first column is their career HR/9 rate, the second the league-wide HR/9 over the same time period. For example, Steve Dunning is only being compared to the MLB average from 1970-1973.
Looking at it this way separates out the advantage of pitching in certain eras and highlights some of the extremes. For one, while Lee did have a career HR/9 over 1.000, he was actually about 4% better than league average during that span (CC Sabathia was actually 21% better during his era). His home run rate, as well as those of Charles Nagy, Dave Burba and Orel Hershiser make sense as they were all close to league average. Josh Tomlin, however does not look better.
If anything, looking at things this way makes a lot of pitchers look worse. Those pitchers from the decreased offense days like Milt Wilcox, Mike Paul and Pedro Ramos all jump to the top of the list as some of the worst pitchers in Indians history as far as allowing home runs, but no one was hit worse than Steve Dunning.
Dunning began his career in Cleveland in 1970 and after allowing 59 home runs in 70 games he was allowed to impress another team via a trade to Texas in 1973. There, he ultimately became a reliever and his home run rate dropped slightly although he was never a serviceable pitcher.
This brings up another point about the list. Ignoring those players who wound up league average or better, Tomlin has the second most innings behind Mudcat Grant. This is because pitchers who generally allow 25% more home runs than the rest of the league don’t stick around very long. There was a 300 IP limit to even be considered on the list, but 8 of the worst 20 pitchers threw between 300 and 400 innings with another five throwing below 500. Grant being an exception makes sense, however, as does Tomlin. Grant was just beginning his career as a 22 year old in 1958 and had a 1.6 WAR as a rookie. With this promise, the Indians were more willing to hold him through some rough years (1959-60) and were awarded with two 2.3+ WAR seasons in his next three years and an All-Star appearance in 1963. After being traded to Minnesota, he had three more well above average seasons with another All-Star appearance and a top 5 MVP finish.
An interesting component of Grant’s home run rate was that it was highly variable with Cleveland (0.9 his rookie year, then it went from a peak of 1.5 in 1960 to a low of 1.2 in 1963), but extremely stable after leaving the Indians. From 1965 through 1971 he never had a HR/9 above 1.1 and averaged 0.9.
Tomlin had similar early career success with a 2.3 WAR in 2011 (his second season) and came back from injury with solid campaigns in 2015 and 2016, but if anything his home run rate continued to rise. While his success on the mound came from an infinitesimal walk rate (AL best in 2011 and 2016), his home run rate went from 1.2 in his debut season to 1.6 by 2012, 1.8 in 2014 and peaked at 1.9 in 2016 (current Indians record and 20th in MLB history). Incredibly, when the rest of the league started blasting bombs at an unprecedented rate, Tomlin was unaffected and his HR/9 dropped to 1.5 in 2017.
This is getting a little sidetracked, however, because we really want to know how great Tomlin is at allowing home runs. We already know that he’s the best in Indians history among those who pitched at least 402 innings (Dunning pitched 401.1), but how does that stack up against the greatest ever? For this, we need to bump our limits up to a more exclusive level and since Tomlin is nearing 850 career innings, 800 seems a fair bar. Without adjusting for era, here are the 10 best home run allowers in MLB history.
| Pitcher | HR/9 | IP |
| Scott Elarton | 1.62 | 1,065.1 |
| Josh Tomlin | 1.61 | 841 |
| Brian Anderson | 1.54 | 1,547 |
| Jose Lima | 1.53 | 1,567.2 |
| Eric Milton | 1.52 | 1,582.1 |
| Bruce Chen | 1.51 | 1,532 |
| Ramon Ortiz | 1.46 | 1,448.1 |
| Rick Helling | 1.46 | 1,526.1 |
| Todd Van Poppel | 1.42 | 907 |
| Allen Watson | 1.40 | 892 |
Now this is exciting. We’ve already shown that Tomlin has allowed more home runs than Elarton’s time with the Indians compared to league average only to find out that he ranks second in all of MLB history to former Indian Scott Elarton! All Tomlin has to do now is allow two home runs to begin his next appearance without recording an out an Tomlin will have given up more home runs per nine than any baseball player ever (with at least 800 IP).
Just to make one final point that relates back to the earlier list, teams almost never stick with a pitcher who allows home runs so often. Of those on the MLB list with at least 800 IP and a career HR/9 above 1.20 (65 pitchers), only Tomlin, Chris Tillman (Orioles, 1.29 HR/9) and Nick Blackburn (Twins, 1.29 HR/9) have played their entire career with one team. While this is a function of the times (more home runs have been hit in the decades since free agency became a thing), it still means that no team in baseball history has ever stuck it out so long with a player who gives up so many home runs.
This is nothing but a statistical exercise and not a commentary on Tomlin’s current status, his potential replacements or his future with the Indians or other teams.
Add The Sports Daily to your Google News Feed!

