
The Columbus Blue Jackets are on fire, and everything seems to be in order as to why. The team’s record has been solid all season, and recent shot differential numbers have turned favorable. It’s an impressive change that I’ve discussed previously on this blog. In fact, the shift toward the positive has only seen a few hiccups since that article’s 11/29 publication date.
But with success has come skepticism toward both the team and head coach John Tortorella. Heck, one of the internet’s biggest hockey clearinghouses decided to hold a roundtable on how to cope with CBJ success. While I think it’s a strange way of phrasing the approach, it is fair to ask big questions about an unexpected story.
Even though I don’t agree with the noted lack of “respect” for the coach, I support part of the spirit of the article: it’s very hard to believe that this coach, and these players are suddenly achieving success in this way. And that’s not because of press conferences or media distaste, that’s because of a lengthy history of mediocre-to-poor results.
To dig a bit further, to actually explore my own skepticism, I’d like to consider two cases. The first is John Tortorella. The second is a longtime target of shot differential criticism: Jack Johnson.
The Coach Who Suddenly Could
Nevermind the past combative press conferences, and the suspension after a fight versus the Flames. For me, the actual perceived problem for Columbus in hiring John Tortorella was the on-ice product.
Over his entire pre-Jackets career, Tortorella held a record of 446-375-37-78 over 939 games (via Hockey-Reference). That translates to a point percentage of 53.8%. On an 82-game pace, that’s worth only 88-89 standings points in a season, below a typical playoff cutoff. Even if we’re being charitable and excluding a poor Vancouver one-off season, the Tortorella-led New York and Tampa Bay teams only managed 54.1% of possible points, which still lands in the 88-89 point range.
The issue deepens when considering team shooting and scoring performances under Tortorella. At TSN, Travis Yost shared “The John Tortorella Effect.” He details the team-wide change in Corsi For % and Goals For % for NHL teams before hiring Tortorella, during their Tortorella eras, and then after moving away from Tortorella. He presents the information in a graph, which I will share below here.
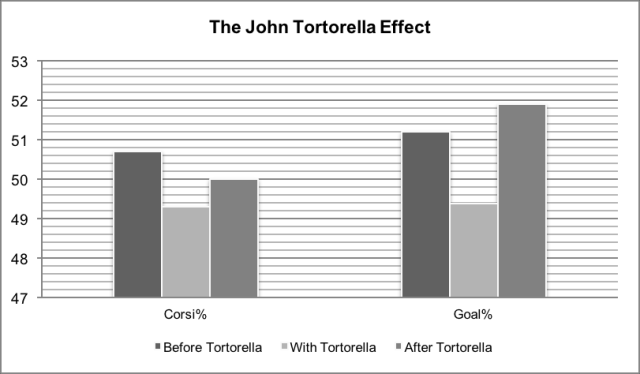
Plot from Travis Yost at TSN, “The John Tortorella Effect.”
The reported impact is stark: when teams bring Tortorella aboard, shot differentials and goal performances both dip. Yost summarizes, “[Tortorella] has his occasional peaks like any other bench boss who has spent time in the league – it’s just that his valleys are much more painful.”
Now, fast-forward to the 2016-17 season and the suddenly strong showing for the Blue Jackets. At Natural Stat Trick, the CBJ still sit above 50% in 5v5 CF% (and near 52% when score- and venue-adjusted). At Hockey Viz, we can explore the shooting change in a visual way (even with a dip after the Kings game on Tuesday). That plot is included below (and I encourage exploring the CBJ page at Hockey Viz to see more great visuals).
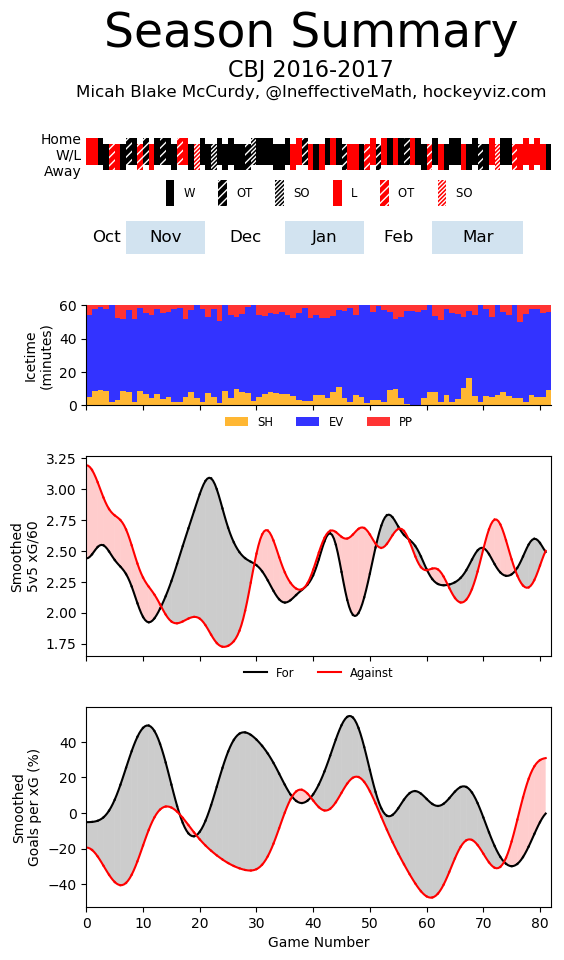
Plots from Micah Blake McCurdy, CBJ Team Overview at Hockey Viz.
Again using Natural Stat Trick, let’s compare to the 2014-15 (47.4%) and 2015-16 Blue Jackets (48.1%). The sudden improvement this year over past versions of the Jackets stands in contrast to Yost’s findings on Tortorella. And thus the skepticism arrives. The CBJ haven’t seen an especially massive roster turnover. Are the slight nips and tucks enough to explain the improvement?
And even roster construction if helps explain part of the improvement, why did the 2016-17 Jackets make a sudden shift in-season? Is level of competition enough to explain the improvement? After all, the Blue Jackets have faced poor Arizona, Colorado, and Islanders teams in the past few weeks. Is Werenski enough to explain the boost? Have team-wide tactics changed to shift the Jackets from lottery-bound to surprisingly strong?
I don’t have answers, and that’s a big part of the problem. At this point, the best I can do is examine the prior performance for both Tortorella and the Jackets, and then compare that to the current showing. The difference between past and present for coach and team is hard to reconcile. Given the relatively short span of success in the new season, it’s entirely reasonable to doubt Tortorella and the Jackets.
The Jack Johnson Situation
A particularly stunning microcosm of the 2016-17 Blue Jackets is the rise of defenseman Jack Johnson. The Columbus d-man has long been considered a poor player by shot metrics. At the time of the Jeff Carter – Jack Johnson trade, Derek Zona at Copper and Blue looked into Johnson’s lackluster play. Similarly, Fear the Fin noted that merely losing Johnson was a big benefit to the Kings. More recently, Sam Page at SI gave an eye-test look at Johnson’s play with Columbus, noting many errors. Even our own Sam Blazer assigned Johnson a poor grade for a below-average 2015-16 campaign.
All of this is to say: Jack Johnson’s NHL performance hasn’t been so rosy. And now, this season, Jack Johnson is only one Corsi event under 50% (as of this writing, he’s at 49.95% at Natural Stat Trick). Johnson was only just bumped below break-even due to last night’s game against Los Angeles (19 CF and 24 CA, again at Natural Stat Trick).
Johnson’s upswing, much like the wider CBJ and Tortorella considerations, represents a strange shift away from past performances. In order to think this through a bit further, I’ve used data from Corsica’s skater pages to explore Jack Johnson’s 5-game rolling average Corsi For percentage in his full seasons with Columbus (2012-13 through 2016-17). I’ve elected to exclude his trade season time with Columbus (but it’s worth noting he didn’t fare well, around a 42% CF% in Columbus during the 2011-12 season according to Hockey-Reference).
In my 5-game average calculation, I’m only considering regular season games and I’ve excluded the first four games of each season (allowing each campaign to be separate, thus avoiding year-to-year overlap).
From the 2012-13 season through the end of 2015-16 season, Jack Johnson had played in 249 5-game spans. So far, in the 2016-17 season, Johnson has been in 26 total 5-game spans. We can take a quick glance at the number of 5-game spans in which Jack Johnson averaged a Corsi For % over 50%.
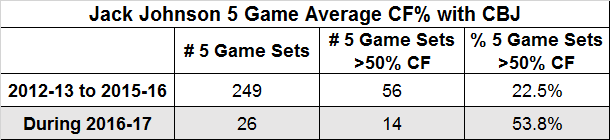
Data from Corsica Hockey
My main takeaway: Johnson’s success this season is out of line with prior performances in Columbus. In fact, it’s worth noting that Johnson’s run of above-water play this year has all happened in a row, and is still happening now (currently sitting on 14 in a row, even after the LA Kings game). The only other time Johnson had a similar run? During the 2014-15 season, in which the d-man had an 11-game stretch during which he held a rolling average CF% over 50 (between February and March of 2015). Yet even in spite of this uptick, Johnson still finished with a 47.4% CF% over the entire season (via Natural Stat Trick).
That 2014-15 example represents a moment for caution and skepticism. Let’s build on that, and consider those Columbus career 5-game CF% averages in the form of a histogram, using bin sizes of 2%. That means we’ll count that number of times Johnson held 5-game average CF% from 0% to 2% and put that in one bin, then 2% to 4% and put that in the next bin and so forth.
I’m going to plot the 2012-13 through 2015-16 data as blue bars, and 2016-17 data (to date) will be with red bars. The x-axis is the CF% bin, and the y-axis is the frequency of events in each CF% bin. Bars are set to overlap in order to help eliminate visual bias of side-by-side bars.
(As a note, binning will obscure the data somewhat. However a histogram is a compelling visual approach to observing distributions. Therefore, I won’t be making any specific claims about the player from this plot and I’ll focus only on general trends.)
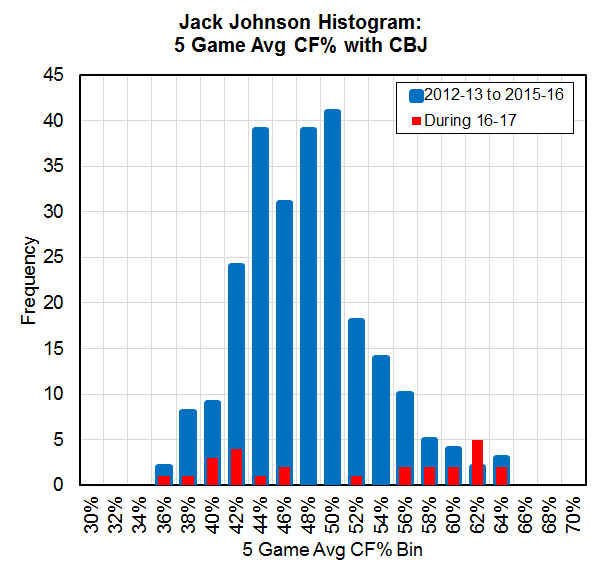
Data from Corsica Hockey
Here, we can start to visualize the current season concerns a bit more. Two factors make me skeptical of the 2016-17 Johnson performance. First: sample size. The red bars are infrequent (as will be the case only 30 games into a season), meaning it’s still sensible to believe that past performance is a more definitive description of Jack Johnson.
The second problem: the dichotomy within the 2016-17 results. You can see, about half the red bars fall below 50%, and half above. As it turns out, the half that sit above 50% all occur from 11/21 onward.
So which is the real Jack Johnson? Do we actually believe that a longtime sub-50% CF% player is now a solid shot-differential contributor after only 14 games?
And even if we reconcile that point, the even more important questions arise: why did Jack Johnson suddenly shift toward the positive? Johnson’s time on ice per game has dropped 2-3 minutes per night (via Hockey-Reference). Is that explanation enough?
What about deployment? At Hockey Viz, we can explore Johnson’s teammates and competition in 2015-16 and then 2016-17. His forward competition profile has shifted slightly (he’s now facing 4th and 5th forwards more frequently), and his teammate profile reflects the shift to lowered time on ice. Is this where the answers sit? Johnson is still logging most of his minutes with Savard. Did David Savard suddenly improve?
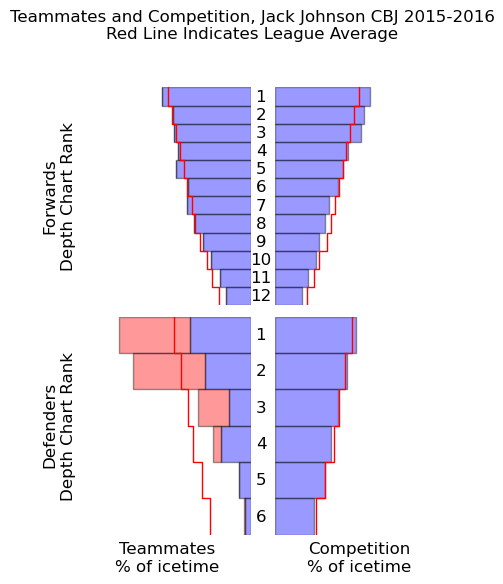
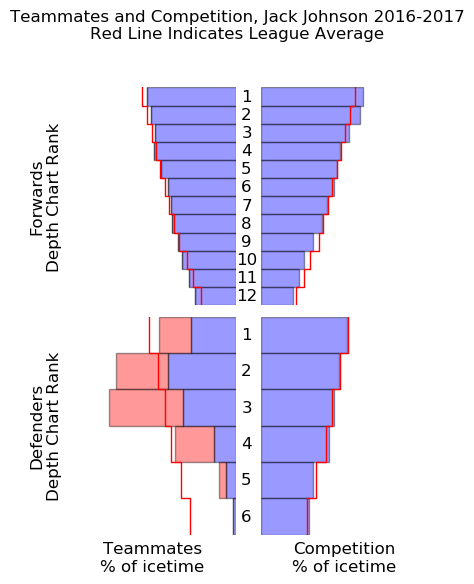
Factoring in all these questions, one has to ask if Johnson simply benefiting from the team-wide improvements? And if that’s the case, what particular changes are causing this big a shift for a traditionally ineffective shot player?
Questions on Questions
I am elated that the Blue Jackets have built up a huge reserve of points, that they’re on a 10-game winning streak. If Columbus finishes the season with a .500 record the rest of the way (let’s say, 26-26-0) they’ll still end up with over 95 points and a solid shot at the playoffs.
My skepticism is raised because of how sudden this change has been, and how the team’s shot results are drastically out of character.
What remains is the “why.” Even aside from a massive powerplay performance, why is a John Tortorella team suddenly so successful at even strength? How long does this last, and can he adapt if other teams can combat the new Columbus style? Why is Jack Johnson now on his longest streak of above-water shooting success? Is this a fluke, and how long will he perform at this level?
I suspect that a proper, objective systems analysis can help decrypt the changes. Are the CBJ focusing on zone entries a different way? Is the team forcing plays in a particular direction to emphasize their strengths?
I don’t have the answers, and it means trying to consider new hypotheses explain the results so far… or just waiting for the games to happen.
Add The Sports Daily to your Google News Feed!