Winters are always long without any baseball, but this one seemed especially long.
Thankfully, the moment we’ve been waiting for since the Chicago Cubs clinched a long overdue World Series title last November is finally upon us — Opening Day is literally right around the corner.
Over the next month or so, plenty of assumptions will surely be made despite the “small sample size” caveat. After all, we know it takes a while for certain trends to actually stabilize.
Still, I was curious as to which hitters put together the best performances in April over the past decade. It could’ve been inspired by that insane month of August Gary Sanchez gave us last year, but who’s been the best through the first month of the season since 2010?
We’ve taken the top-five performances from each season and ranked them by wRC+ to see who gave themselves the best start imaginable. To be eligible for consideration, players had to accumulate at least 90 plate appearances during the month of April in each given season.
Here are the most dominant performances we’ve seen from big-league hitters so far this decade.
2010
| Player, Team | PA | BB% | K% | OPS | HR | RBI | R | ISO | wRC+ |
|---|---|---|---|---|---|---|---|---|---|
| Robinson Cano, NYY | 94 | 6.4% | 10.6% | 1.201 | 8 | 18 | 21 | .365 | 219 |
| Justin Morneau, MIN | 96 | 21.9% | 14.6% | 1.130 | 5 | 17 | 18 | .293 | 205 |
| Paul Konerko, CHW | 92 | 16.3% | 8.7% | 1.197 | 11 | 21 | 13 | .486 | 204 |
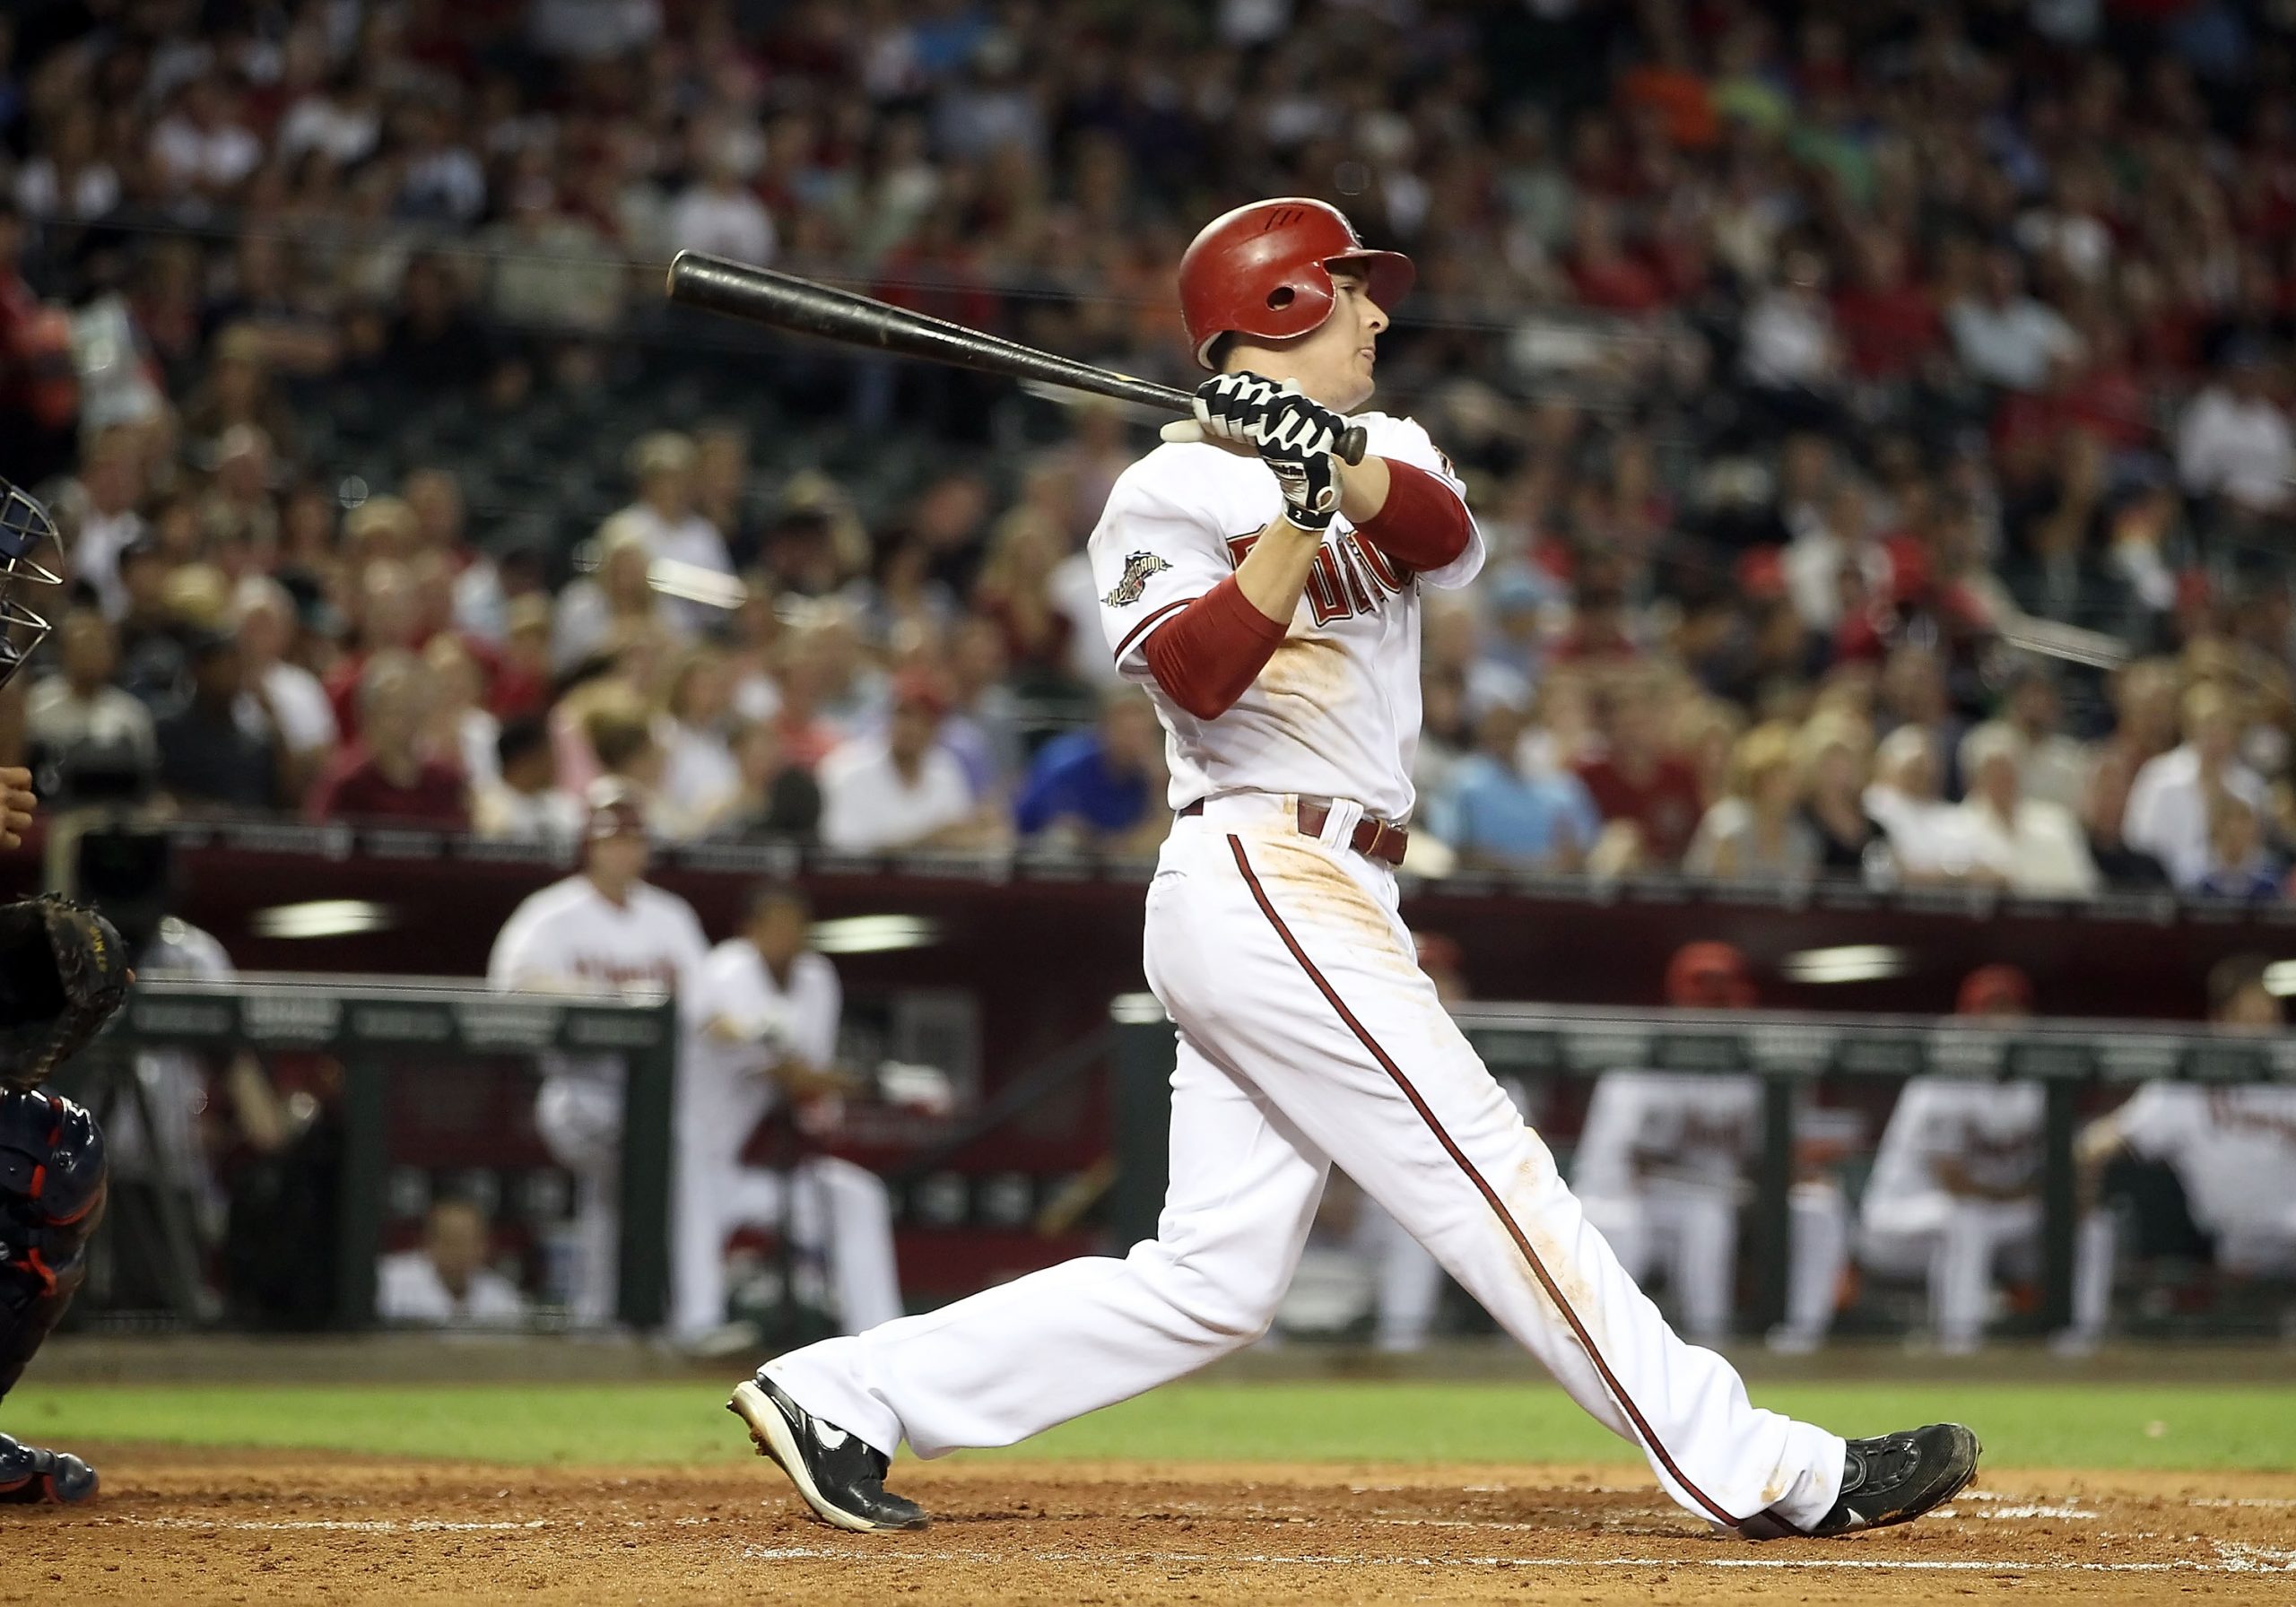
| Kelly Johnson, ARI | 94 | 13.8% | 18.1% | 1.154 | 9 | 18 | 17 | .438 | 196 |
| Vernon Wells, TOR | 101 | 7.9% | 15.8% | 1.113 | 8 | 16 | 20 | .38 | 196 |
Obviously, the name that really jumps out the most here is Kelly Johnson. The 2010 season was his first with the Arizona Diamondbacks, and it ended up being his best all-around performance at the plate.
In a career-high 671 plate appearances, he posted single-season personal bests in OPS (.865), homers (26), RBI (71) and hard-hit rate (37.5%). Despite all that, he was the only one of these five who didn’t earn a trip to the 2010 All-Star game.
2011
| Player, Team | PA | BB% | K% | OPS | HR | RBI | R | ISO | wRC+ |
|---|---|---|---|---|---|---|---|---|---|
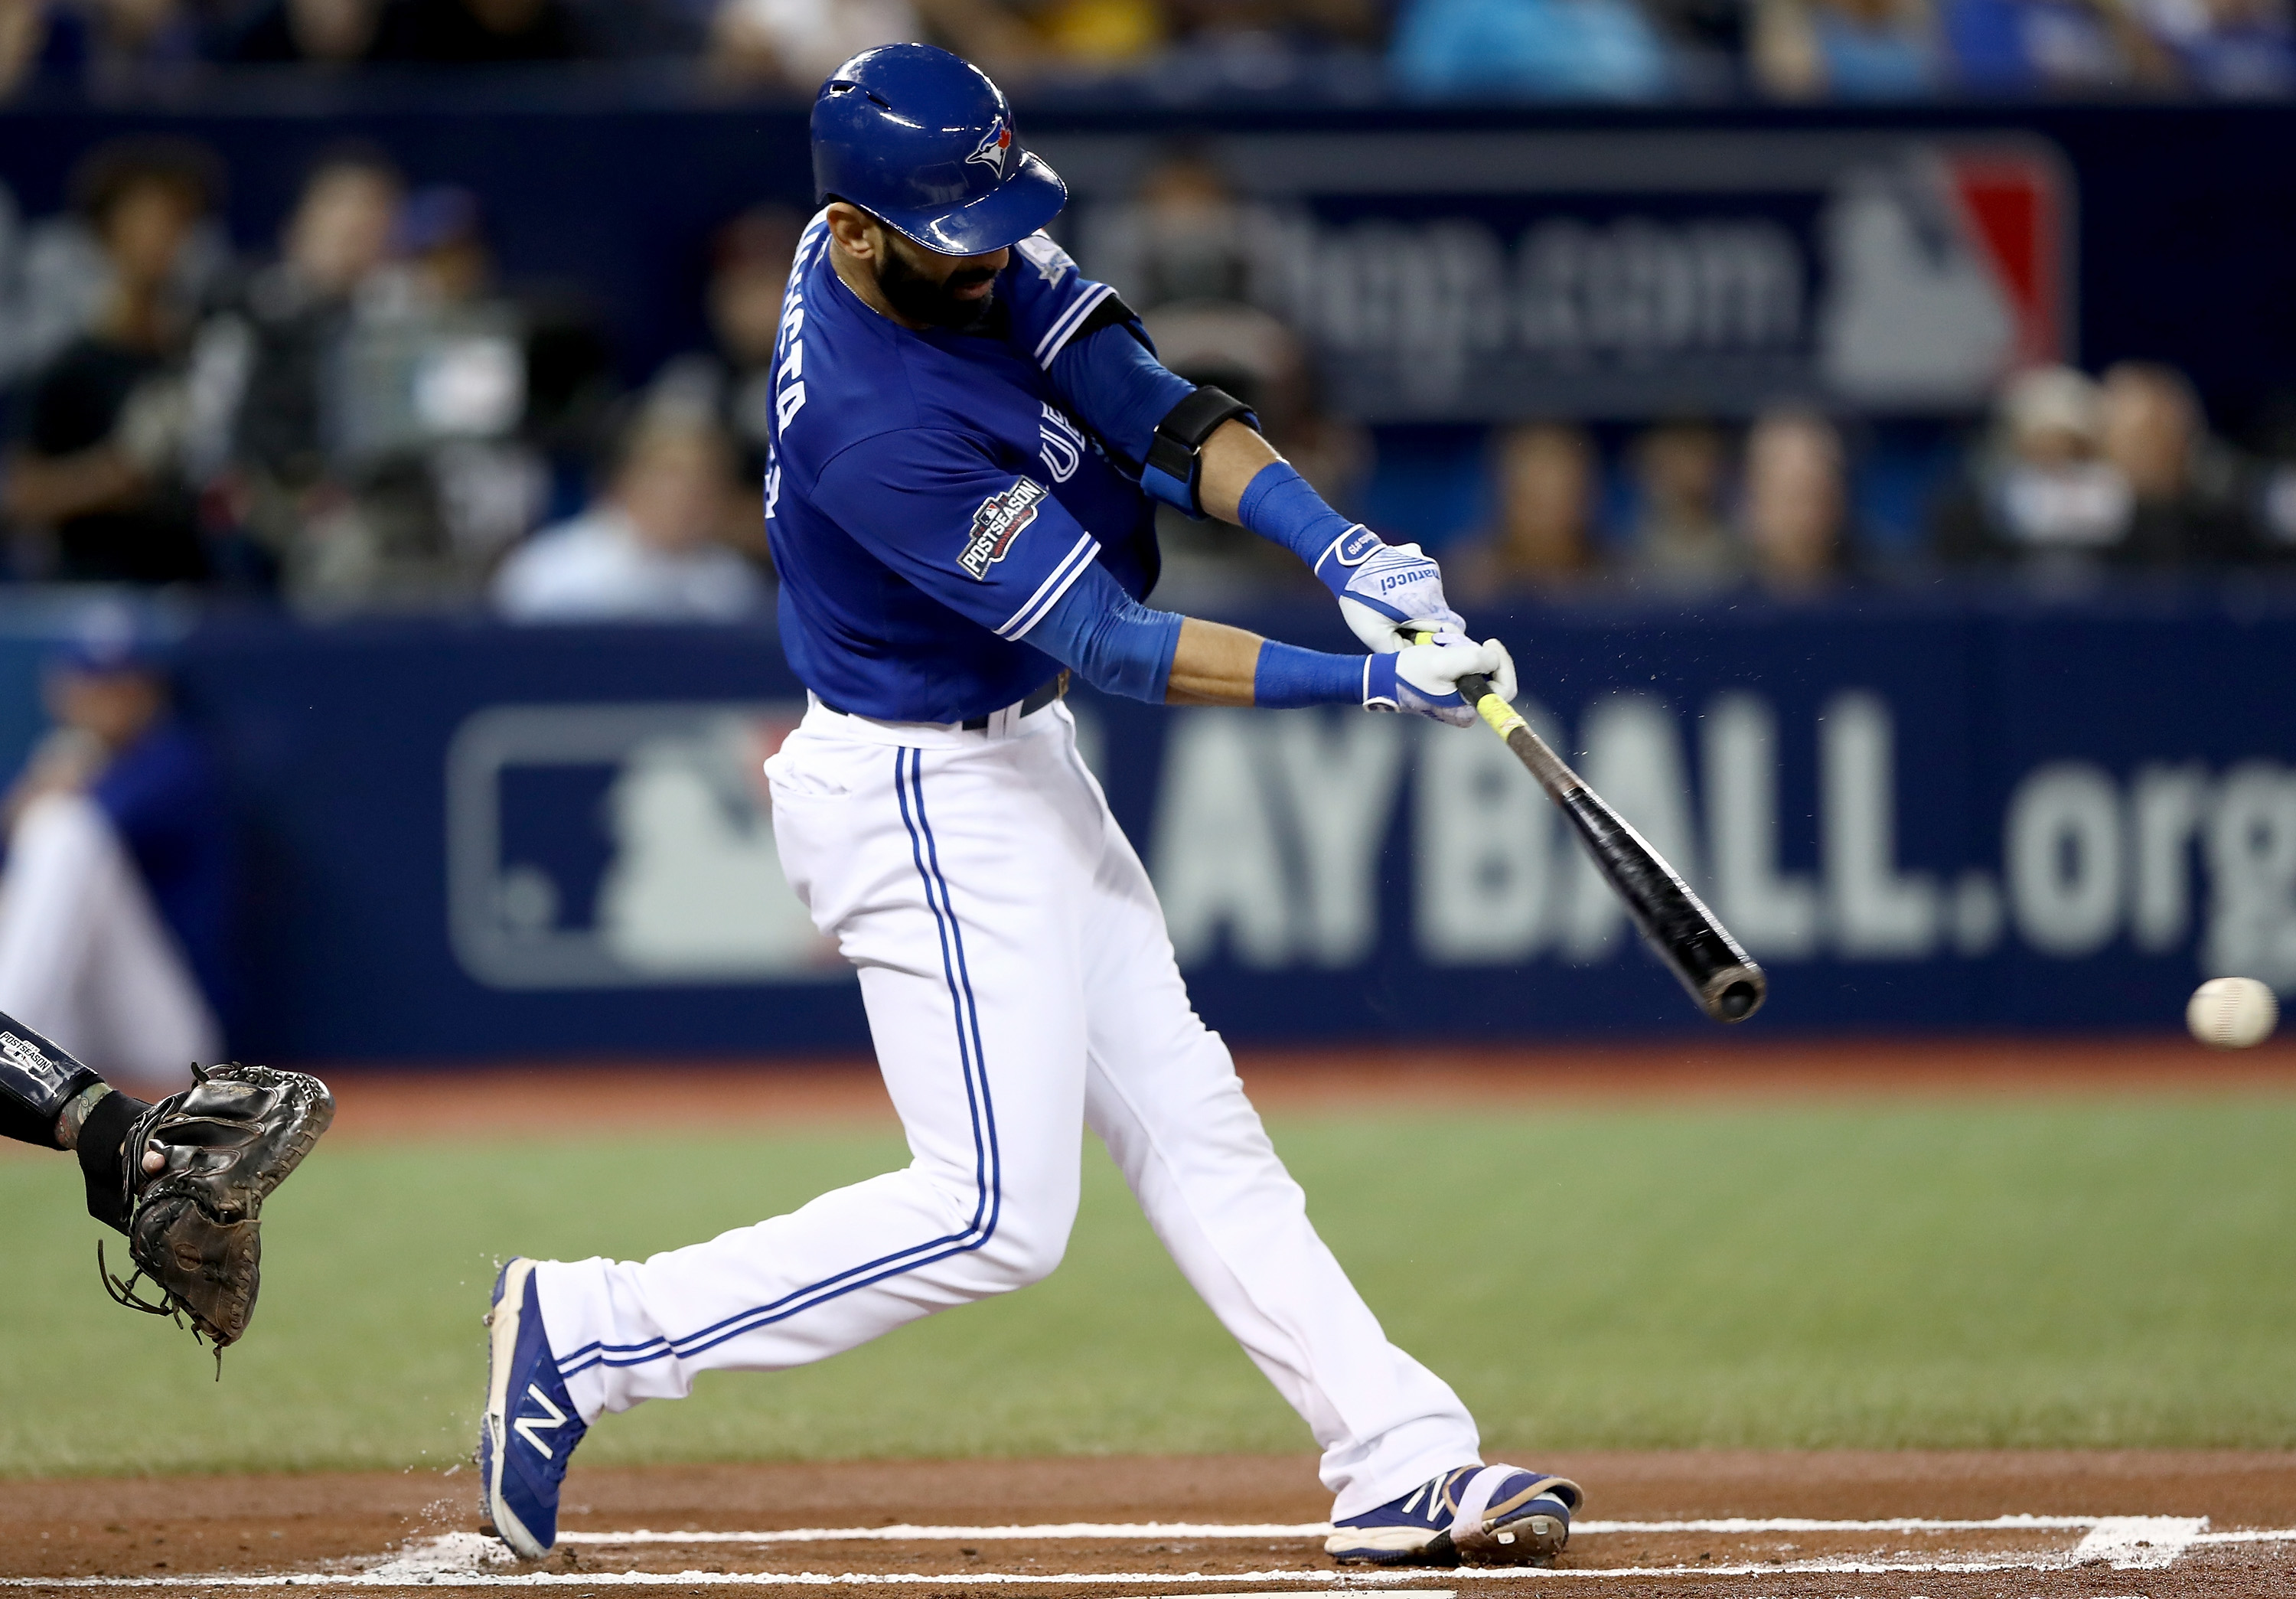
| Jose Bautista, TOR | 111 | 25.2% | 14.4% | 1.312 | 9 | 15 | 25 | .415 | 248 |
| Lance Berkman, STL | 95 | 10.5% | 11.6% | 1.217 | 8 | 22 | 23 | .376 | 234 |
| Ryan Braun, MIL | 111 | 12.6% | 14.4% | 1.136 | 10 | 23 | 24 | .337 | 207 |
| Joey Votto, CIN | 116 | 19.8% | 12.1% | 1.098 | 5 | 16 | 24 | .228 | 202 |
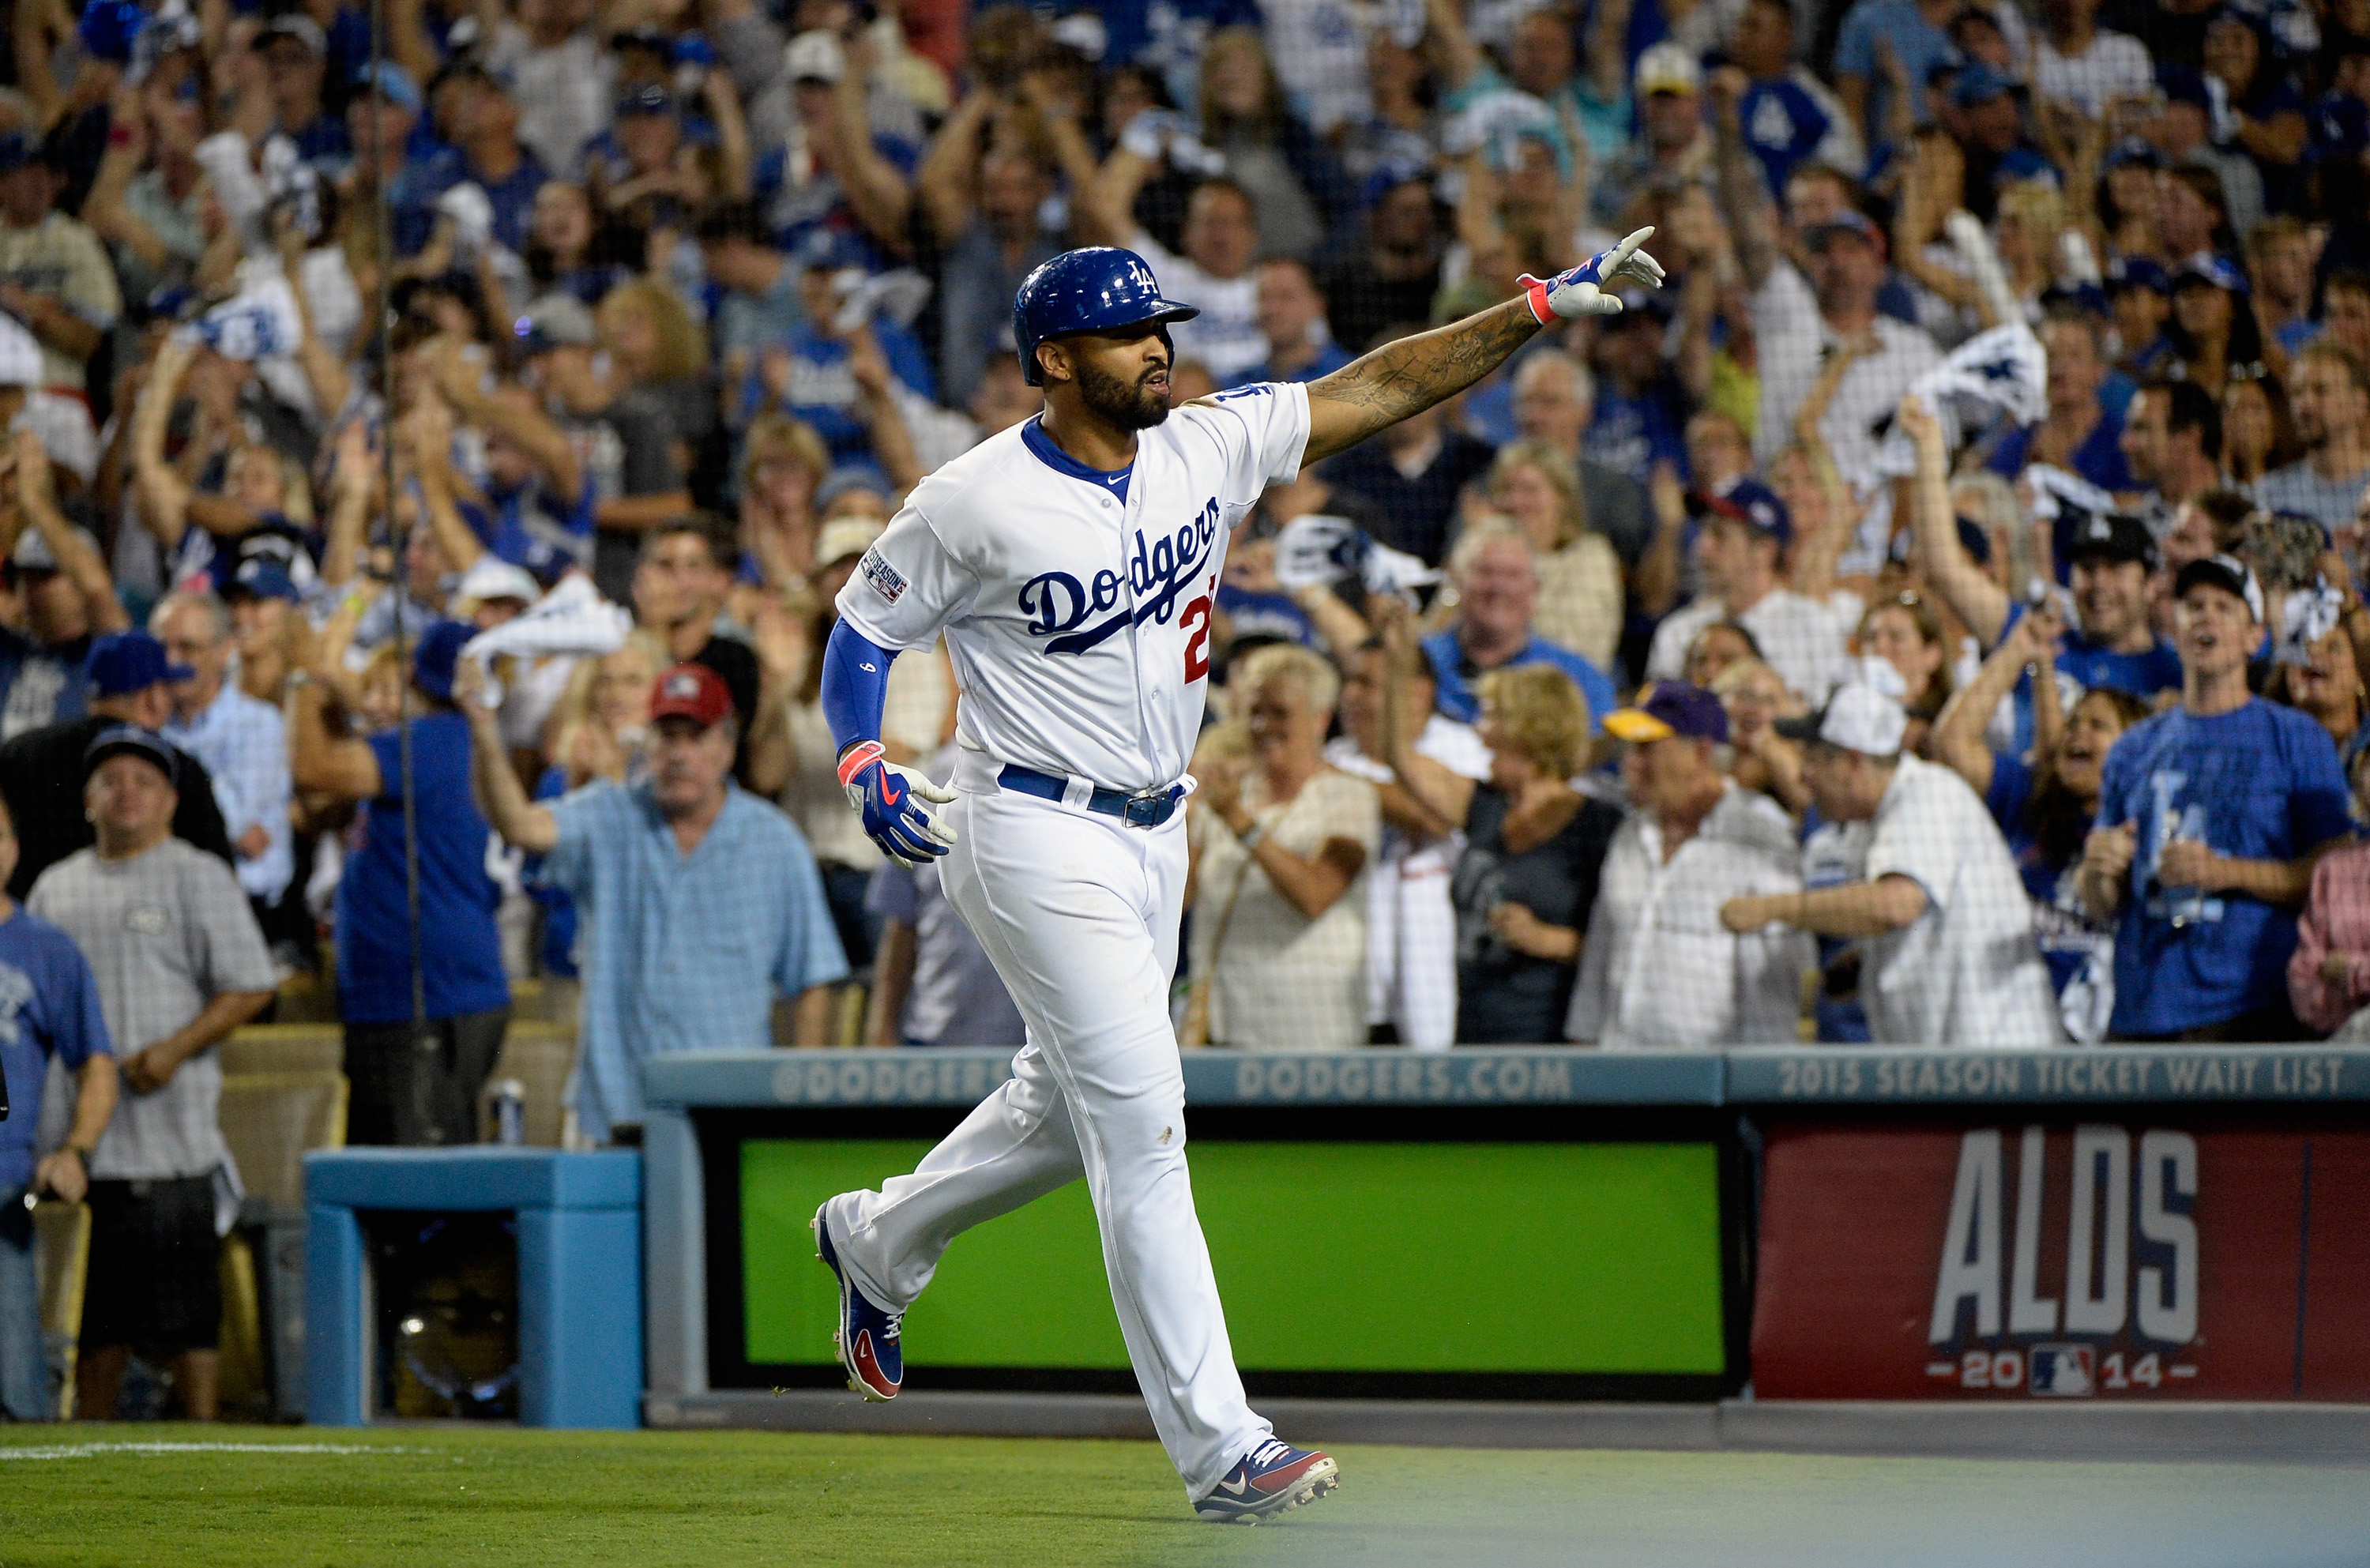
| Matt Kemp, LAD | 117 | 10.3% | 20.5% | 1.037 | 6 | 19 | 20 | .248 | 189 |
After coming out of nowhere the year before to slug 54 homers and 124 RBI off the strength of a 165 wRC+, it wouldn’t have been crazy to be skeptical of Jose Bautista repeating that performance based on his track record up to that point.
Clearly, he took it personally by coming out that next April to wreck havoc on opposing pitchers. One of Bautista’s best characteristics has been his ability to take a walk, but that 25.2% walk rate in April of 2011 is just insane. It did set the tone for the year, though, as his walk rate settled in at a career-high 20.2%.
He also ended up leading the league in homers for the second consecutive year with 43 bombs.
2012
| Player, Team | PA | BB% | K% | OPS | HR | RBI | R | ISO | wRC+ |
|---|---|---|---|---|---|---|---|---|---|
| Matt Kemp, LAD | 98 | 13.3% | 21.4% | 1.383 | 12 | 25 | 24 | .476 | 269 |
| David Ortiz, BOS | 94 | 9.6% | 12.8% | 1.184 | 6 | 20 | 17 | .321 | 217 |
| Josh Hamilton, TEX | 96 | 7.3% | 17.7% | 1.182 | 9 | 25 | 20 | .349 | 210 |
| Paul Konerko, CHW | 90 | 7.8% | 13.3% | 1.123 | 5 | 15 | 13 | .296 | 200 |
| Derek Jeter, NYY | 105 | 7.6% | 11.4% | 1.012 | 4 | 13 | 16 | .189 | 177 |
Just when you’d think Matt Kemp‘s April performance from 2011 was pretty awesome (and the fifth best among qualified hitters), he outdid himself the following year by climbing to the top. While he still posted a 145 wRC+ for the entire year, he was limited to just 106 games and 449 plate appearances due to injury.
Another player worth noting here is Josh Hamilton, who turned this quick start into a season-long line of .285/.354/.577 with 43 homers and 128 RBI in 636 plate appearances. He went to the All-Star game, won a Silver Slugger, finished fifth in AL MVP voting and netted what ended up being an ill-fated five-year deal with the Los Angeles Angels.
In the 1,084 plate appearances since signing that deal, Hamilton has hit just 39 homers while collecting 148 RBI.
2013
| Player, Team | PA | BB% | K% | OPS | HR | RBI | R | ISO | wRC+ |
|---|---|---|---|---|---|---|---|---|---|
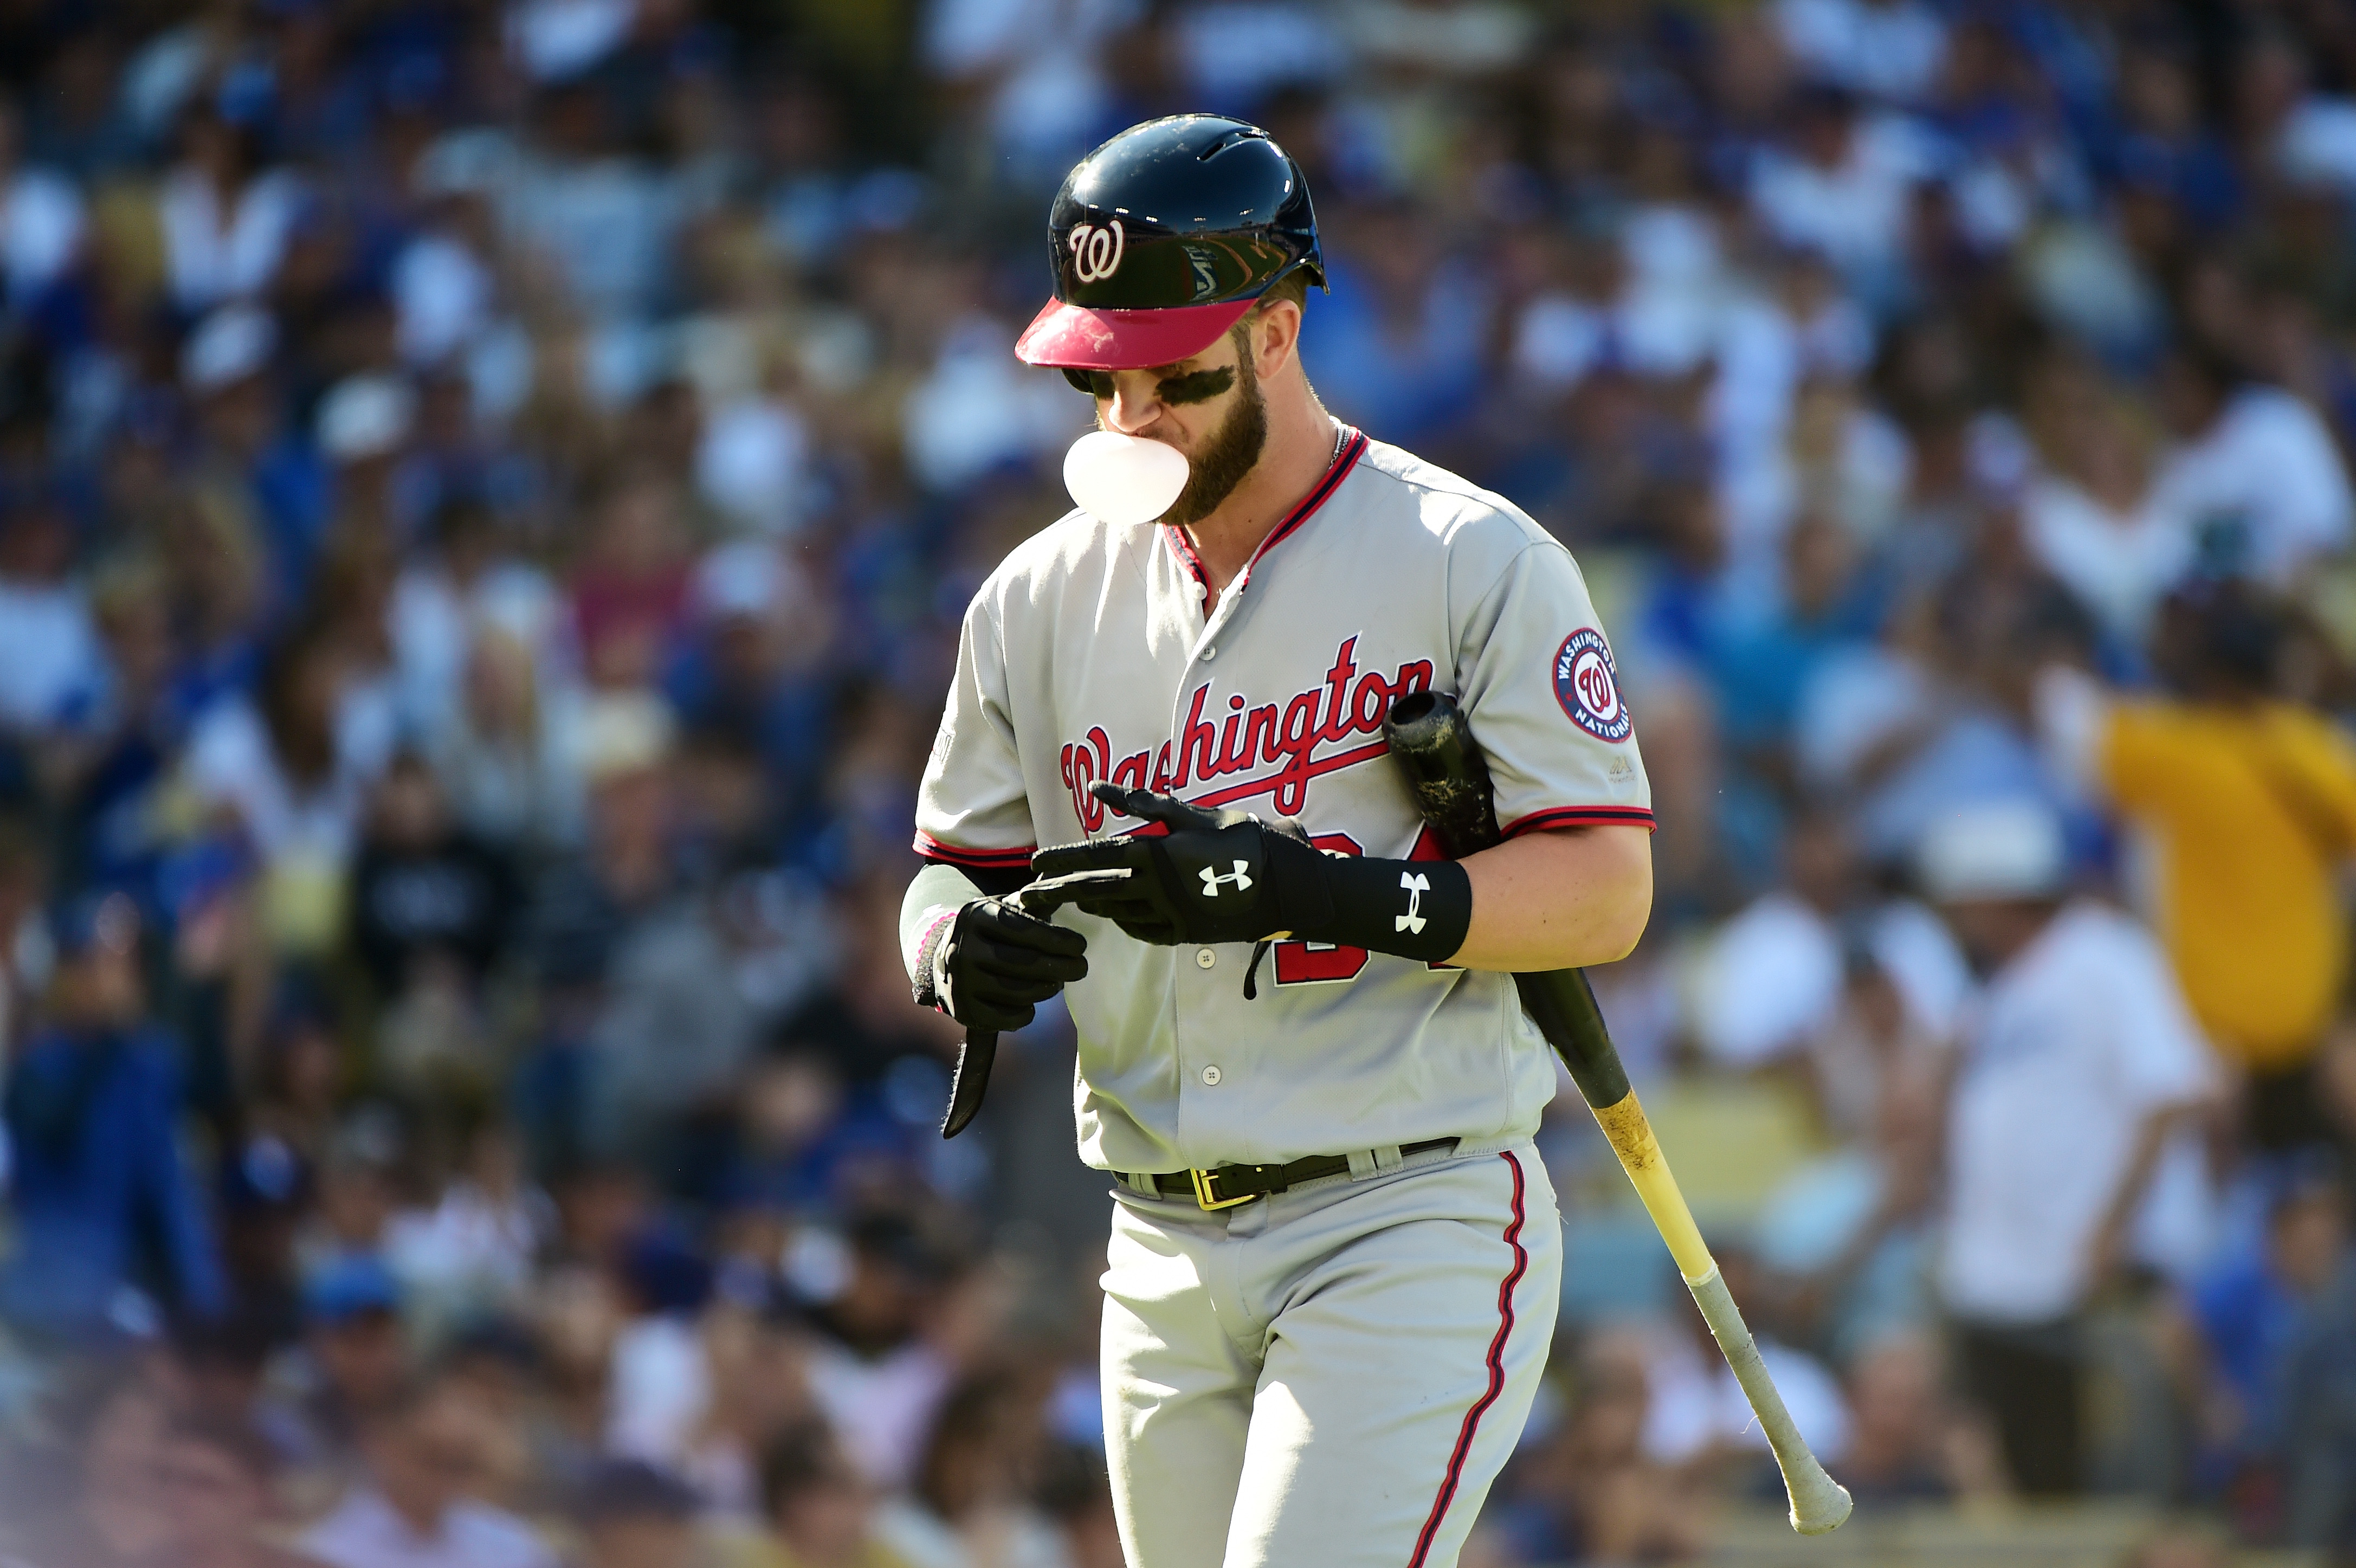
| Bryce Harper, WAS | 107 | 13.1% | 15.0% | 1.150 | 9 | 18 | 18 | .376 | 216 |
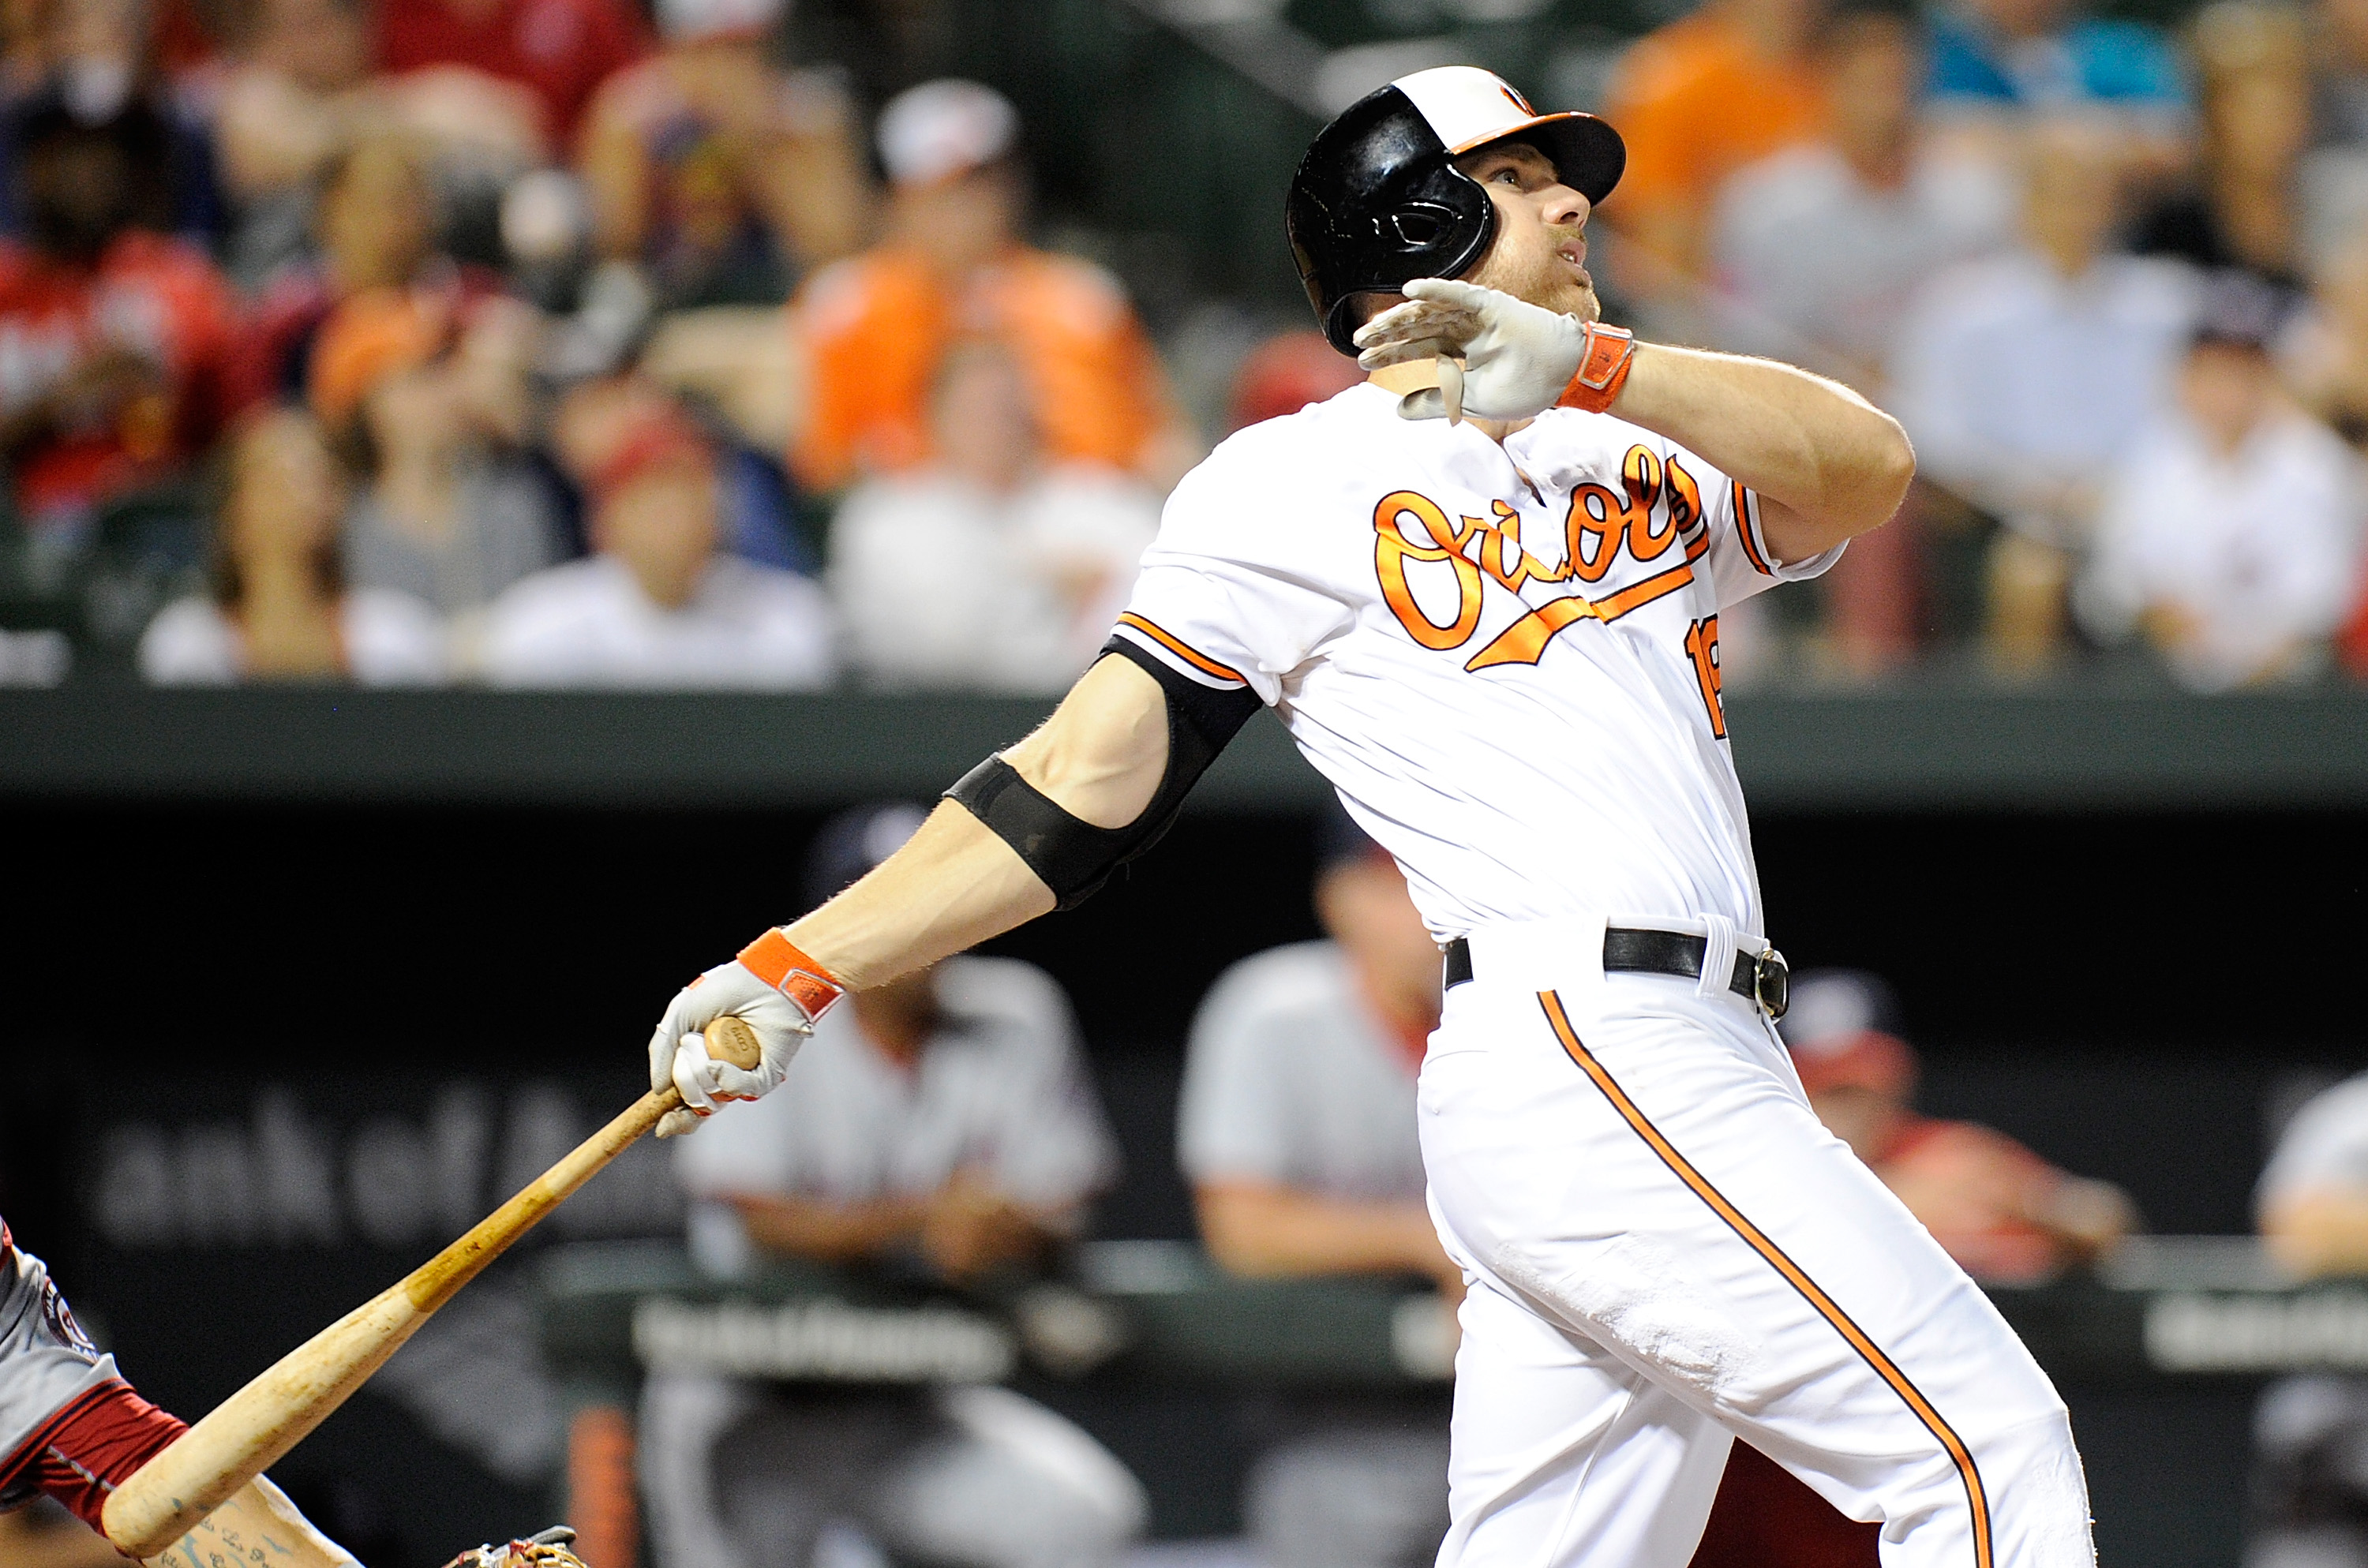
| Chris Davis, BAL | 113 | 14.2% | 23.0% | 1.171 | 9 | 28 | 19 | .380 | 209 |
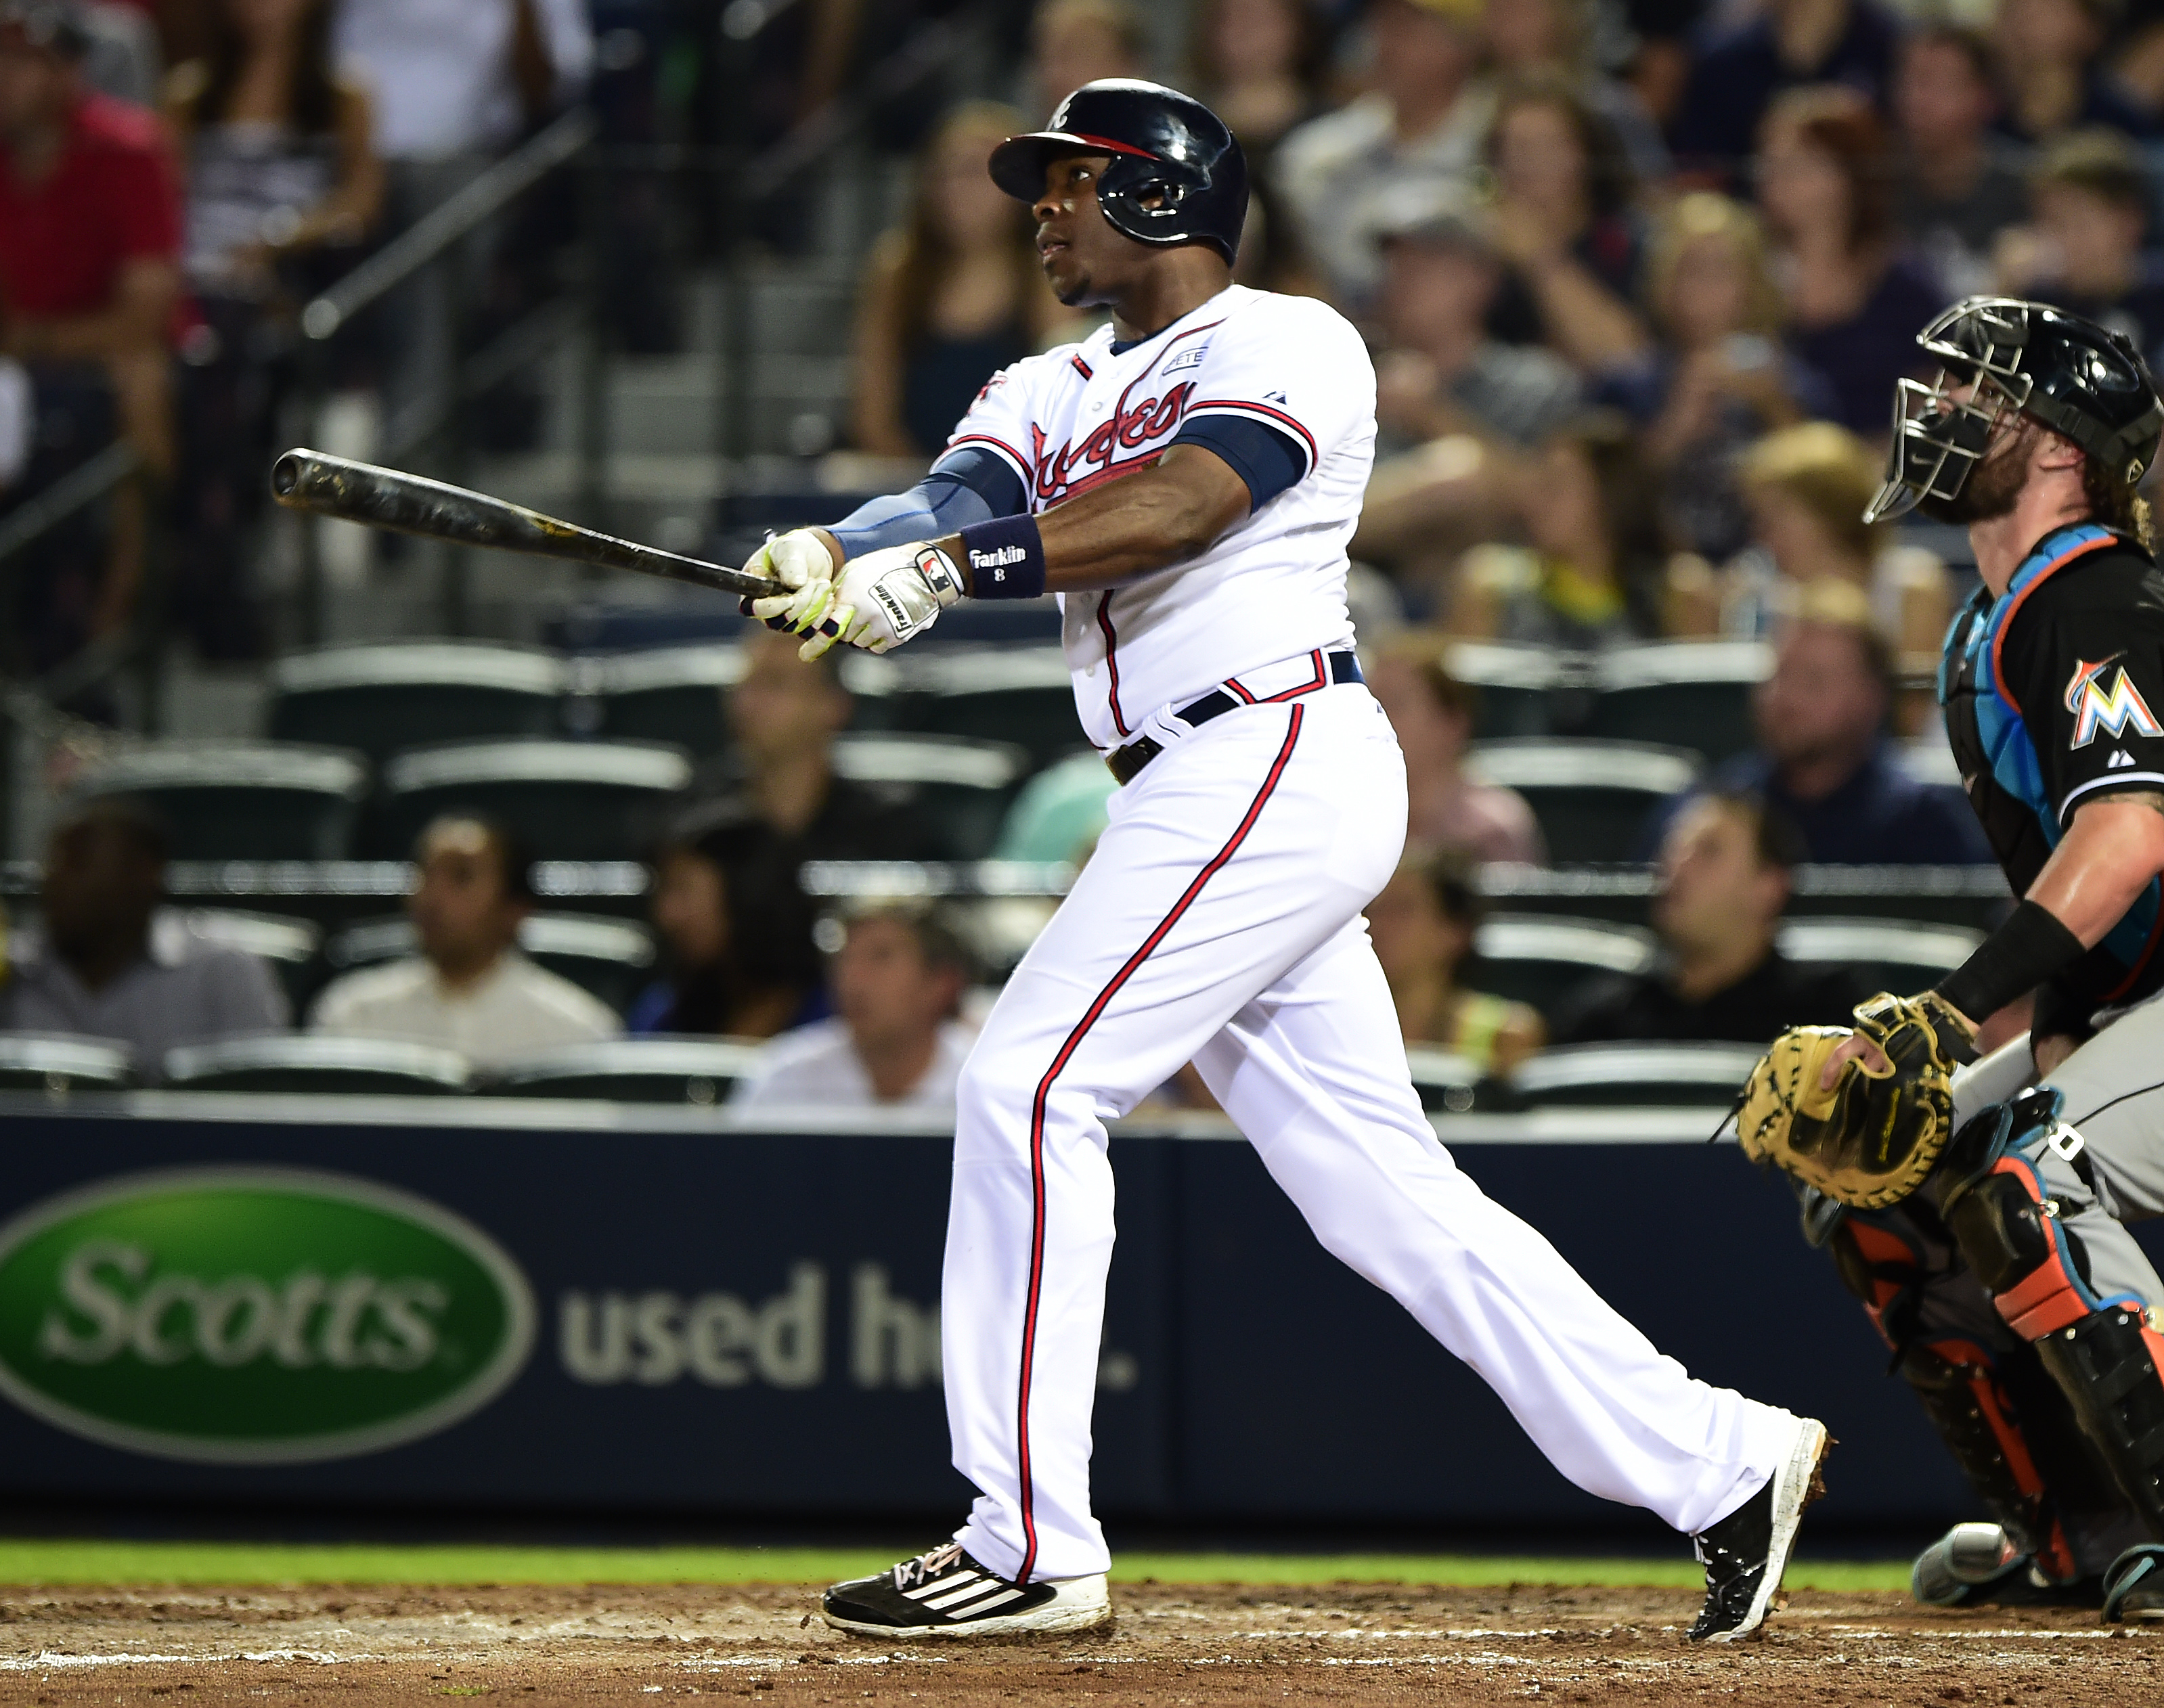
| Justin Upton, ATL | 112 | 14.3% | 26.8% | 1.136 | 12 | 19 | 22 | .436 | 208 |
| Shin-Soo Choo, CIN | 129 | 13.2% | 14.7% | 1.031 | 4 | 11 | 20 | .218 | 190 |
| Carlos Gomez, MIL | 94 | 5.3% | 16.0% | 1.031 | 4 | 9 | 17 | .256 | 185 |
This looked like it was going to be Bryce Harper‘s true breakout campaign so many had been waiting for. While his 137 wRC+ for the season isn’t anything to be ashamed of, he was still a couple years away.
However, it was the breakout some had been waiting for with regard to Chris Davis. While he did slug 33 homers and drove in 85 runs the year before, it doesn’t compare to the monster 53-homer, 138-RBI performance he put up in 2013. His ISO had never been higher than .264 in a single season before this, so the .348 mark he posted blew everything else out of the water.
2014
| Player, Team | PA | BB% | K% | OPS | HR | RBI | R | ISO | wRC+ |
|---|---|---|---|---|---|---|---|---|---|
| Troy Tulowitzki, COL | 107 | 19.6% | 10.3% | 1.257 | 7 | 22 | 24 | .381 | 223 |
| Jose Bautista, TOR | 118 | 25.4% | 16.9% | 1.088 | 8 | 18 | 24 | .318 | 206 |
| Adrian Gonzalez, LAD | 101 | 7.9% | 19.8% | 1.071 | 8 | 24 | 18 | .348 | 197 |
| Justin Upton, ATL | 101 | 9.9% | 32.7% | 1.048 | 8 | 18 | 17 | .326 | 191 |
| Charlie Blackmon, COL | 108 | 6.5% | 6.5% | 1.076 | 5 | 18 | 23 | .253 | 183 |
Bautista finds his way onto this list again with another absurd walk rate, but it’s also the second consecutive season Justin Upton experienced a hot start with the Atlanta Braves. It’s a pretty unique performance given his strikeout rate — this is the only instance noted here where a player produced one north of 30.0%.
What’s also interesting is that Upton’s hard-hit rate spiked significantly from one year to the next. After producing the lowest one of his career in ’13 (29.9%), it jumped up to 38.2%, which is currently the second best of his career. He got himself off to a good start in that department in April of 2014, when his hard-hit rate was an eye-popping 50.0%.
2015
| Player, Team | PA | BB% | K% | OPS | HR | RBI | R | ISO | wRC+ |
|---|---|---|---|---|---|---|---|---|---|
| Nelson Cruz, SEA | 94 | 7.4% | 19.1% | 1.096 | 10 | 22 | 14 | .402 | 198 |
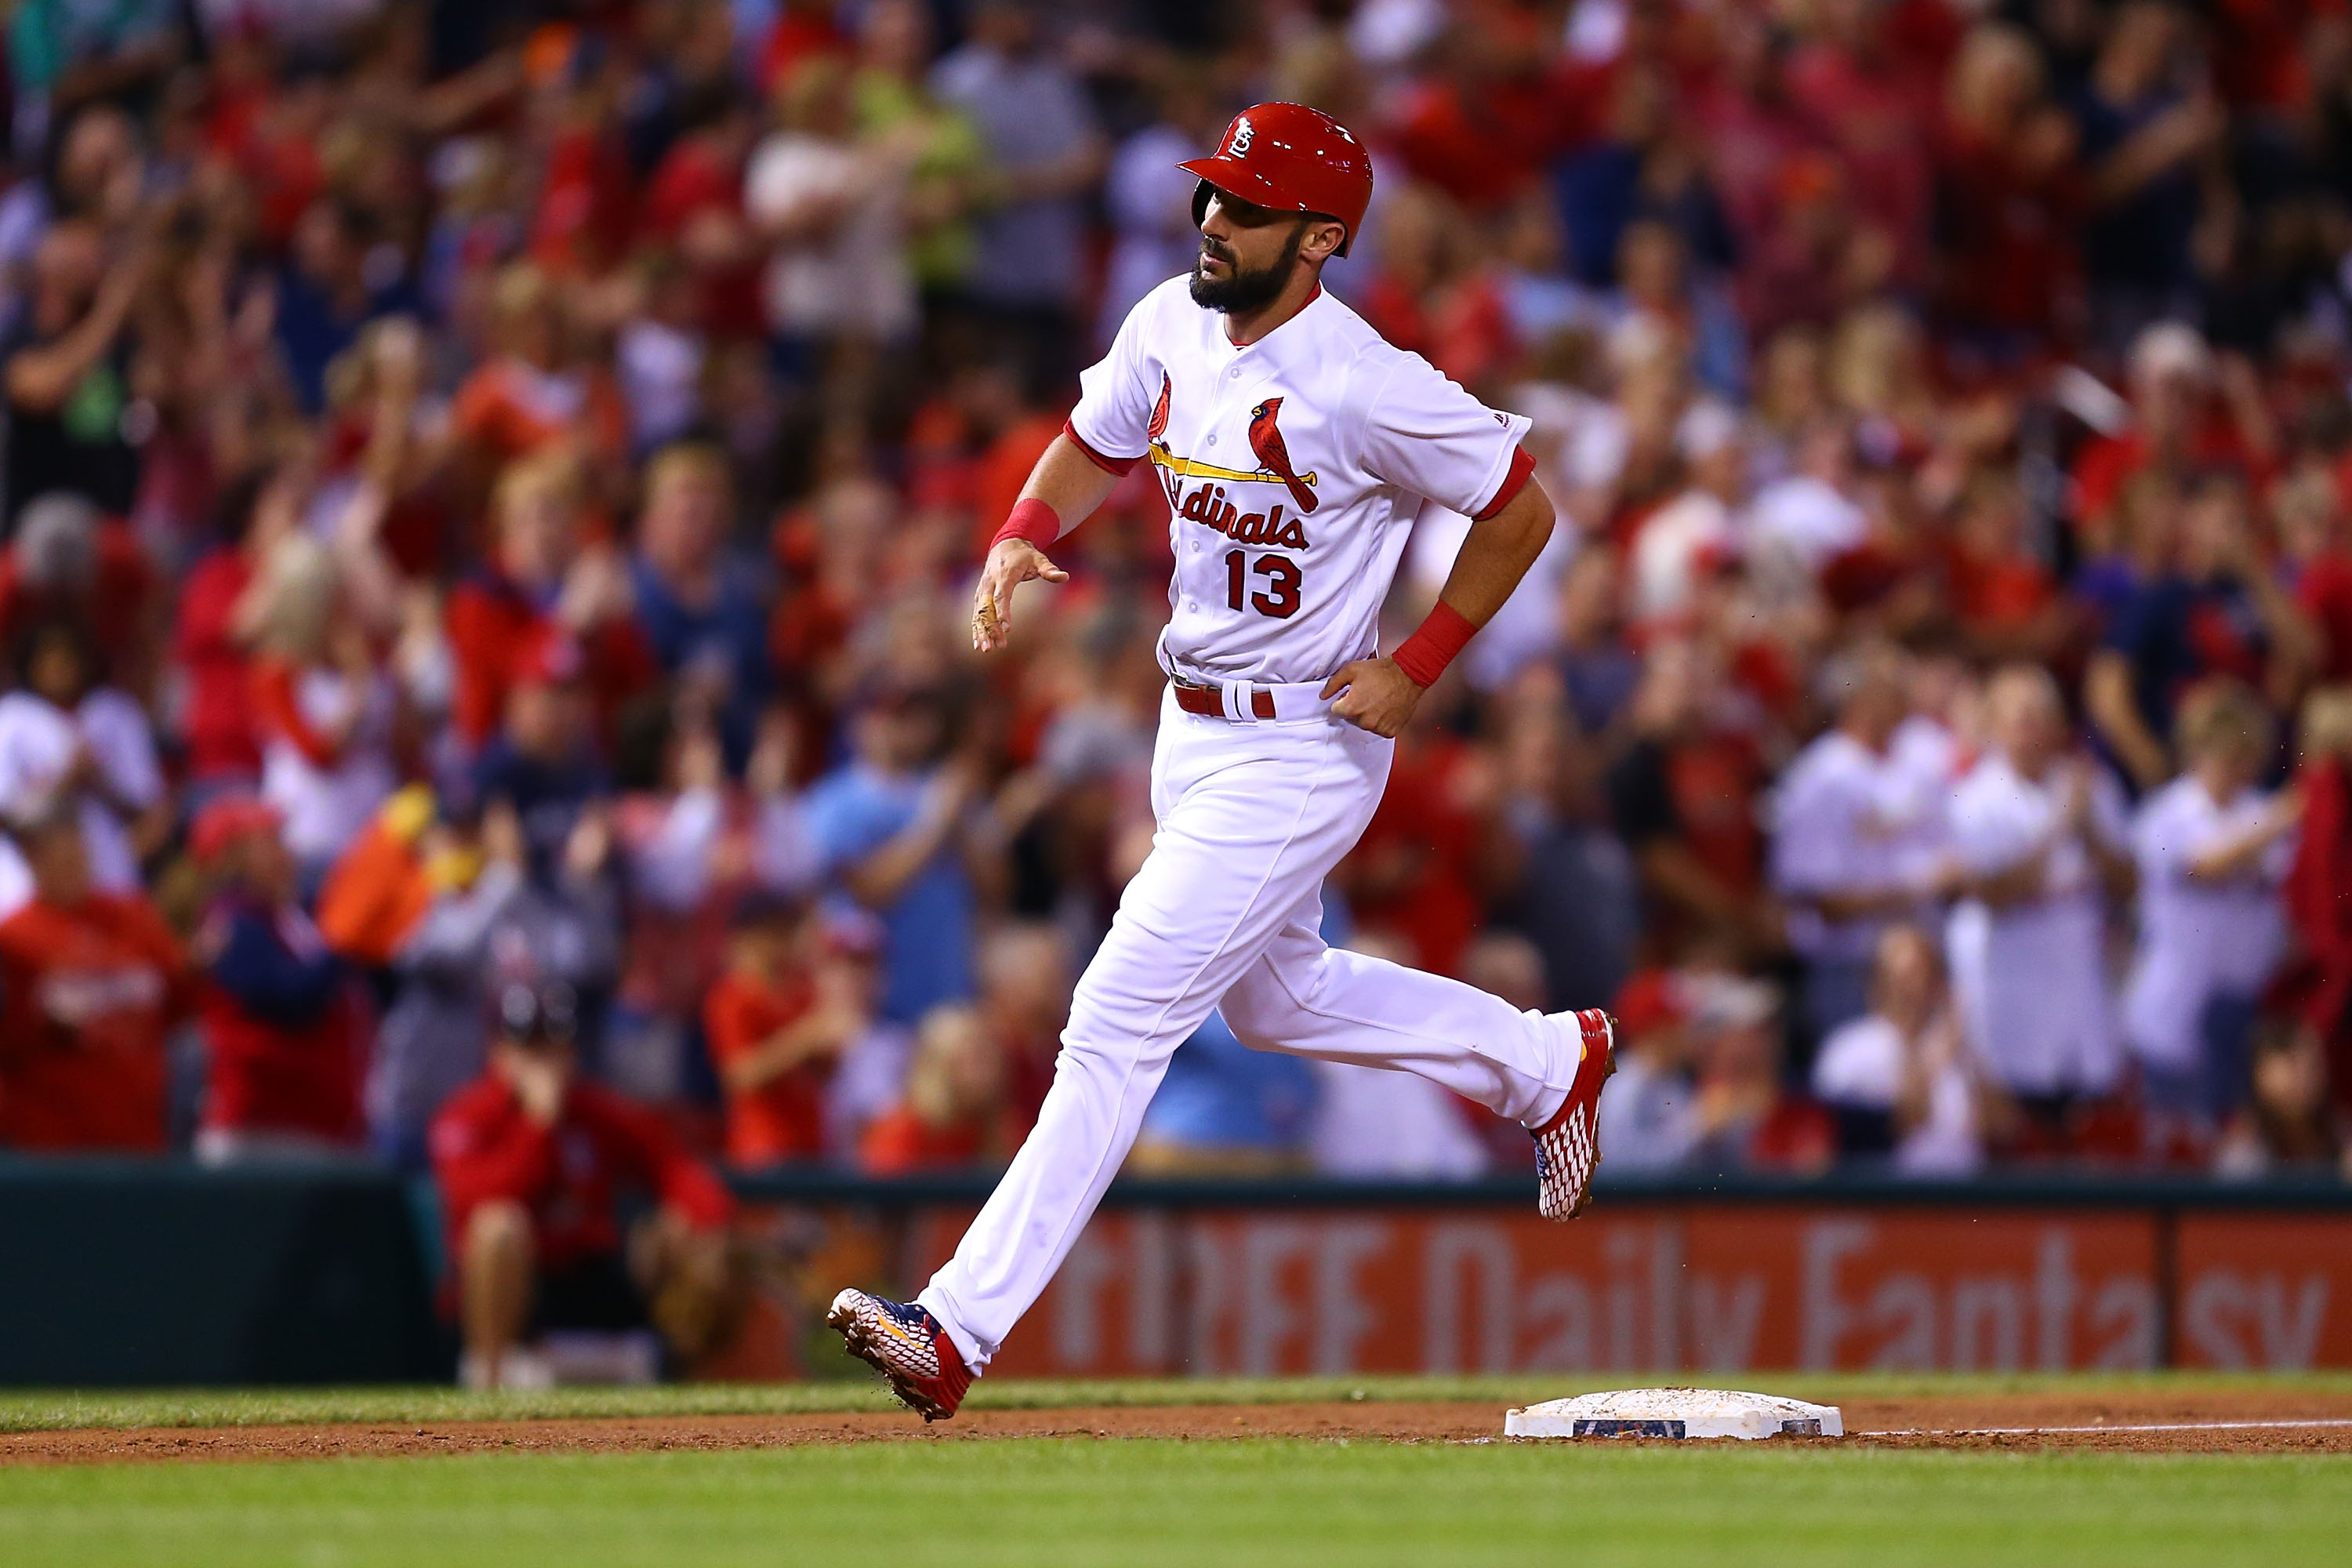
| Matt Carpenter, STL | 96 | 10.4% | 11.5% | 1.089 | 3 | 14 | 21 | .279 | 197 |
| Miguel Cabrera, DET | 99 | 15.2% | 16.2% | 1.091 | 5 | 17 | 12 | .253 | 193 |
| Joey Votto, CIN | 97 | 15.5% | 19.6% | 1.069 | 7 | 17 | 13 | .329 | 186 |
| Mike Trout, LAA | 94 | 17.0% | 22.3% | 1.039 | 5 | 14 | 20 | .263 | 185 |
This group includes a lot of predictable names, so we want to focus on the one that doesn’t necessarily fit upon first glance, which is Matt Carpenter.
The 2015 campaign was significant for Carpenter because it’s when his power emerged. He only hit 3 homers in April, but finished with a career-high 28. After never posting an ISO higher than .169 to that point as a big leaguer, it settled in at .233. That was made possible by a rise in line-drive rate (23.8% to 28.5%) and fly-ball rate (35.2% to 41.7%), along with a drastic decrease in ground-ball rate (41.0% to 29.7%).
2016
| Player, Team | PA | BB% | K% | OPS | HR | RBI | R | ISO | wRC+ |
|---|---|---|---|---|---|---|---|---|---|
| Dexter Fowler, CHC | 94 | 17.9% | 20.0% | 1.087 | 3 | 15 | 19 | .267 | 189 |
| Logan Forsythe, TB | 94 | 11.7% | 21.3% | 1.035 | 4 | 10 | 14 | .268 | 182 |
| Manny Machado, BAL | 104 | 6.7% | 16.3% | 1.061 | 7 | 16 | 20 | .323 | 180 |
| Bryce Harper, WAS | 96 | 17.7% | 13.5% | 1.121 | 9 | 24 | 16 | .429 | 179 |
| David Ortiz, BOS | 91 | 14.3% | 15.4% | 1.071 | 5 | 19 | 12 | .333 | 177 |
The most interesting part of last season’s fast starts is that only two of the five players will be suiting up for the same team once Opening Day rolls around. David Ortiz retired, Logan Forsythe got traded to the Los Angeles Dodgers and Dexter Fowler signed with the St. Louis Cardinals as a free agent.
Harper followed up his 2015 NL MVP campaign with a torrid April, but that was about as good as it’d get for him. He posted an ISO above .200 just once over the next five months, with his monthly wRC+ exceeding 130 only once, too.
Conclusion
Obviously, the MLB regular season isn’t a sprint — it’s a marathon. That’s tough to deny when the grind of 162 games in about 180 days stares every organization in the face upon lining up for the national anthem on Opening Day.
As we’ve seen many times, a quick start doesn’t necessarily mean a tremendous overall year. However, there is no ballplayer on Earth that would say they don’t want to start their season on a hot streak.
Which hitters do you think have the best chance at producing the most dominant offensive performances over the next month?
![]() About Matt Musico
About Matt Musico
Matt Musico currently manages Chin Music Baseball, contributes to The Sports Daily and is also an editor for numberFire. He has written for FanDuel Insider and Bleacher Report in the past. He’s a lover of all baseball, especially the Mets.
Add The Sports Daily to your Google News Feed!