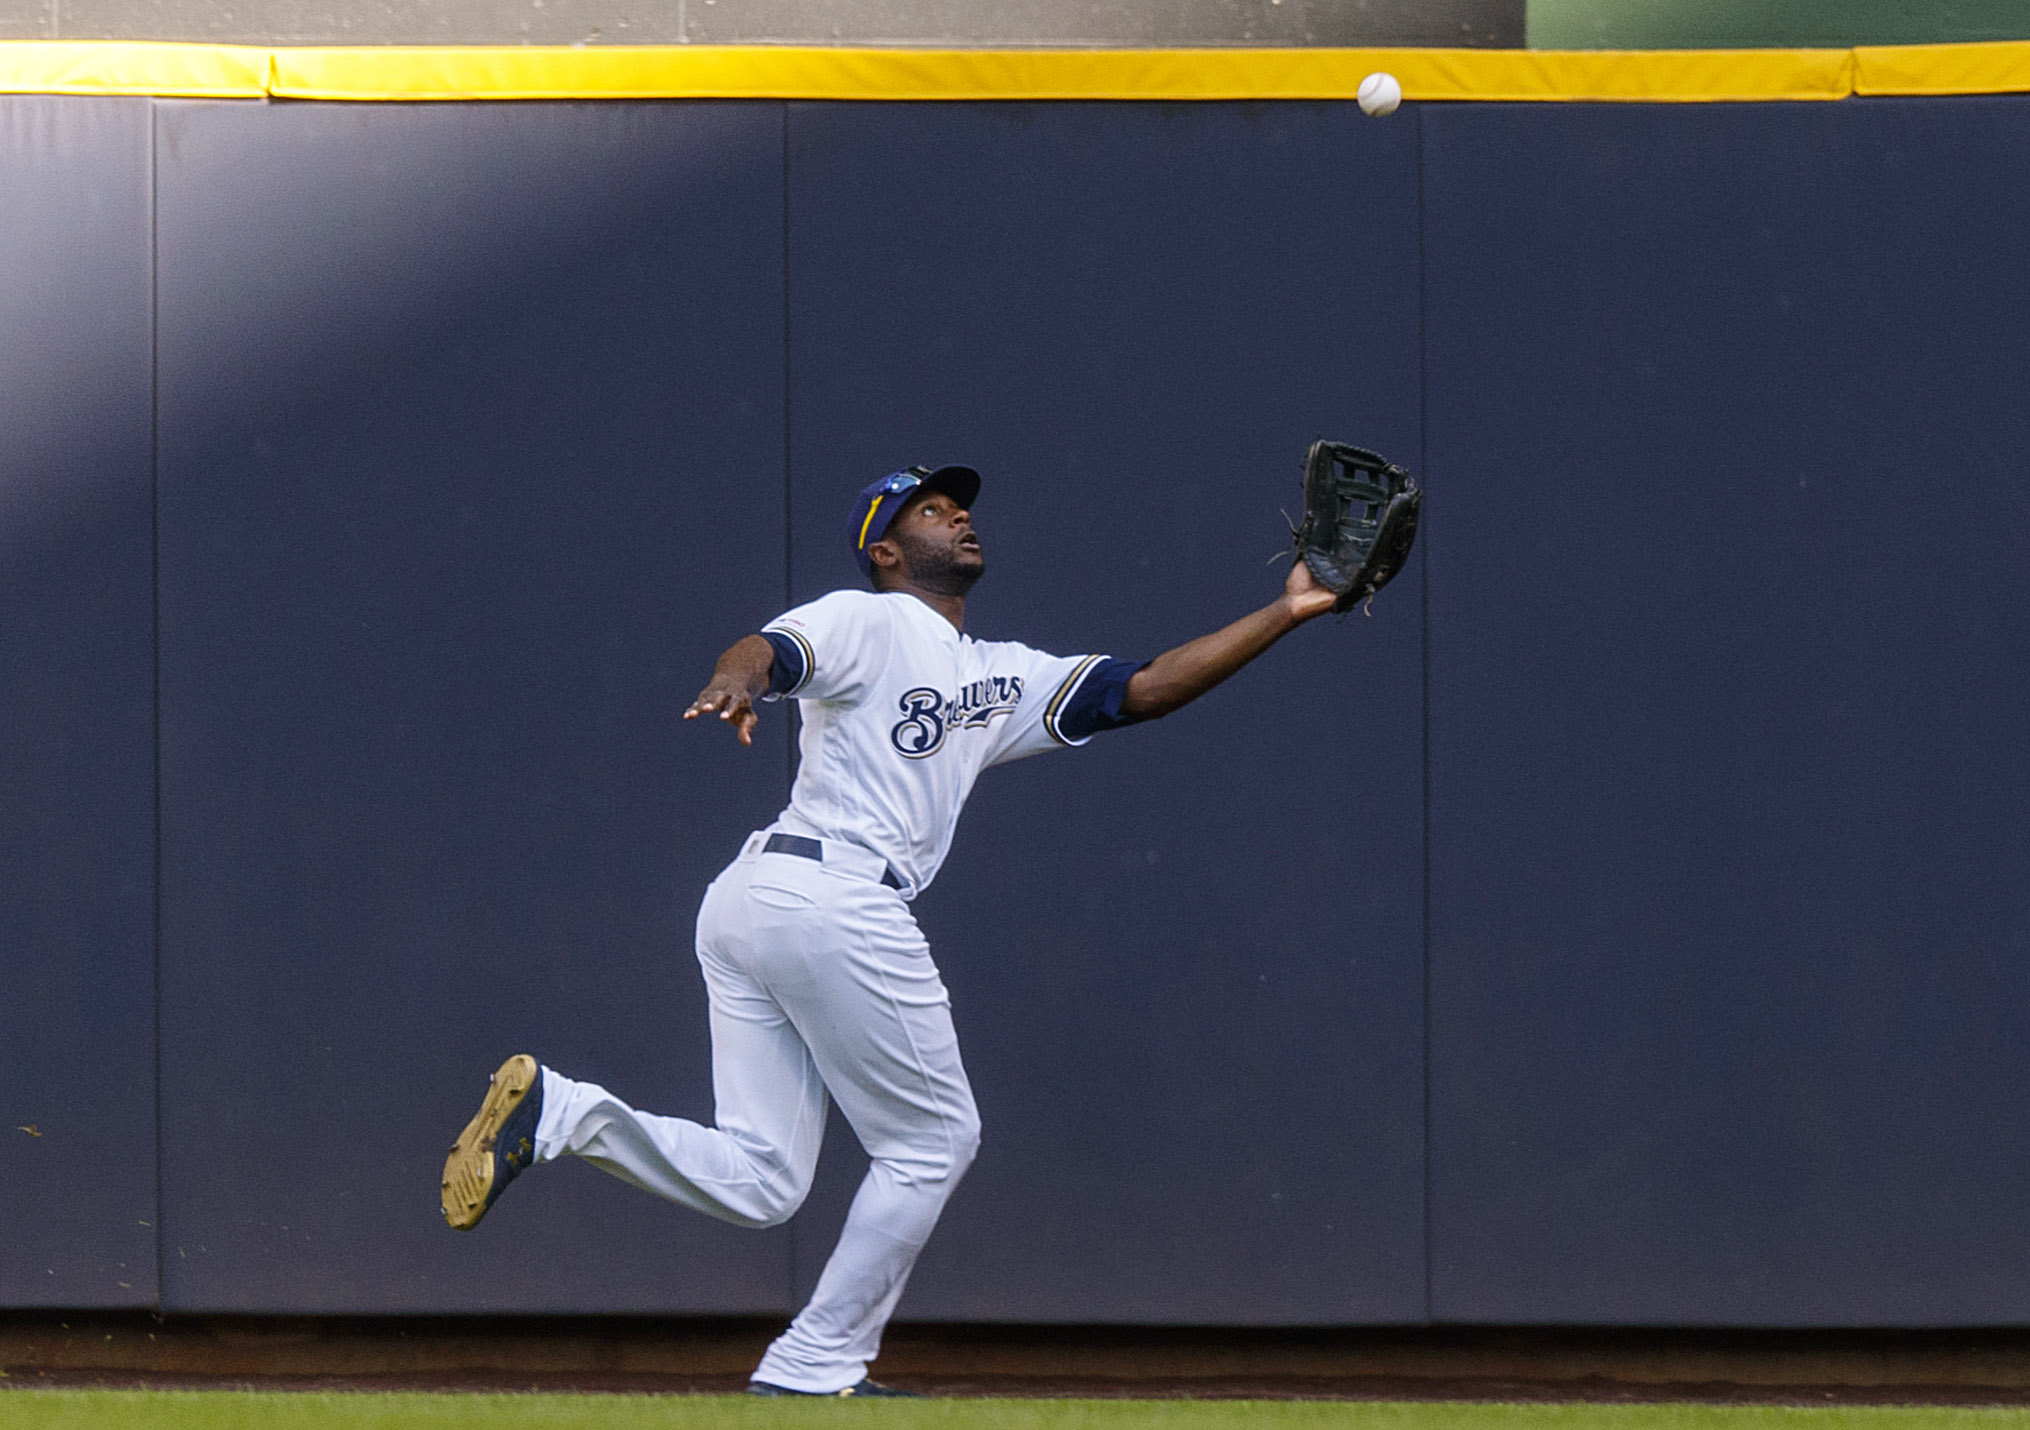
I attempted to answer these questions through looking at the 118 cases from 2016 to 2018 in which an outfielder played the minimum number of innings in the outfield to qualify for the leaderboards in two consecutive seasons. The short answer when it comes to directional outs above average is that it doesn’t help much.
First, I checked how one year’s OAA going back correlated to the next year’s OAA when going back. It had a solid correlation coefficient at 0.70, showing that it has solid reliability. OAA on balls in was 0.56, not as good but still a decent correlation. Even if at first that seems like these metrics are good for showing whether or not a particular fielder is good at balls hit over their heads or at balls shallower than where they started, in truth they are no better than just total outs above average. The correlation coefficient for total OAA in one year to OAA on balls back and balls the next year are 0.69 and 0.56, respectively, no better or worse than the previous numbers. On the flip side, neither back OAA nor in OAA did a better job at predicting the following season’s total OAA than the total OAA of that season.

So if these numbers are skewed by whether a player is just a good defender or not, that doesn’t mean directional OAA can’t still accurately determine a defender has a preference of going back or crashing in. But once again, there’s nothing significant to back that up either. When taking the back OAA minus the in OAA (essentially a number that shows if a player is better going back or forward), it’s correlation coefficient from one season to the next is 0.37, or in other words, not very strong.
So ultimately, while directional OAA can be better in describing in what events a fielder did better or worse than average in for a particular season, they do not tell you anything worthwhile in terms of a player’s skill level or overall talent, and so they should not be used as if they do.
One more thing I wanted to check out was if a player would improve in a particular direction based on positioning. I took every case in which a player improved by 5 or more outs going back and checked to see if their average change in depth (as also tracked by Statcast) for the season at their main position told us anything. However, outside of one outlier (Carlos Gomez), the average change in depth for an outfielder that improved significantly on balls over their heads was a grand total of 0. I did the same thing for players that improved on OAA in, and the average change in depth was a little over 2 feet further back, although that was also carried by 2 outliers.
Baseball Savant has been publishing an influx of new metrics that have been tracked by Statcast in the past year. As interesting as some are in terms of how they describe the game of a player, several of them do a poor job of actually predicting how a player will do, or helping a player know how to improve. Directional Outs Above Average definitely seems to fit in that category.
Add The Sports Daily to your Google News Feed!
