The Columbus Blue Jackets are off to their second best start through 20 games in franchise history (thanks to Aaron Portzline for the factoid). On a surface level, that’s reason for joy. The 11-5-4 CBJ were in a playoff spot at Thanksgiving and continue to hold that spot (the first Eastern Wild Card) as of this writing. Unfortunately, not all has been shining bright for the Jackets. While the points accumulated won’t go away, there has been some reason to worry.
Over at Puck Daddy on November 21, Greg Wyshynski poked at parts of the Columbus campaign to date. The big issues? An unsustainable powerplay and a wildly high PDO. On November 22, Travis Yost discussed similar issues in an article at TSN. Yost observed the lack of Corsi performance across the roster and remarked, “If and when that [powerplay] dries up … this team’s going to be exposed.”
These shot differential issues are real. Without an improved effort at generating and preventing shots, the Blue Jackets sit at the mercy of shooting and save percentages. The former is tricky, the latter is familiar (and worryingly dependent on Sergei Bobrovsky’s health).
Or perhaps that should read, “these shot differential issues were real.” Or maybe they are still real. You see, the last stretch of games for Columbus have become complicated (in a good way).
A Jackets Turning Point?
Just prior to the 11/15 game against Washington, the Blue Jackets were the second-worst NHL team in 5v5 CF% (using data from Corsica, with no score adjustments). What followed was the jam-packed seven game stretch between then and now. The schedule? Vs Washington (then, 8th best CF%), vs NY Rangers (25th), at Washington (8th), vs Colorado (20th), vs Calgary (9th), at Tampa (13th), and at Florida (5th).
By comparison to the then-poor Jackets, any schedule would be tough. To pack in 4 games versus top-10 shooting clubs, and then add 3 others with only two days off in that same stretch? A nasty run.
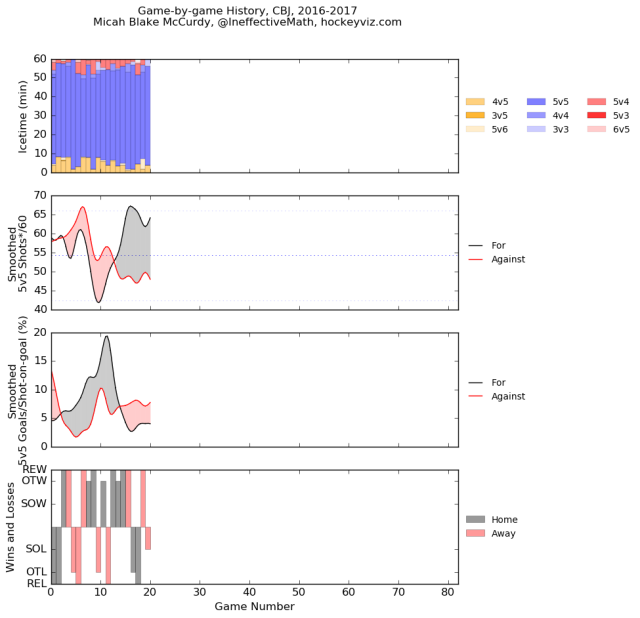
And wouldn’t you know, the Blue Jackets accepted the challenge and out-attempted every team during those seven games (via Natural Stat Trick). Over at Hockey Viz, Micah Blake McCurdy (@IneffectiveMath) makes the stark change a visual event.
It’s the second of the history strips we should examine. Suddenly, instead of bleeding shots against, the Blue Jackets were winning the shot battle. In fact, they had completely flipped their script. Instead of offering minimal shooting prowess and porous defensive acumen, both parts changed for the better.
The swap is exceptionally confusing. How does a team make a 180 so suddenly? Which part of the season are we to believe, the first 13 games or the last 7?
Considering CBJ Skater Improvements
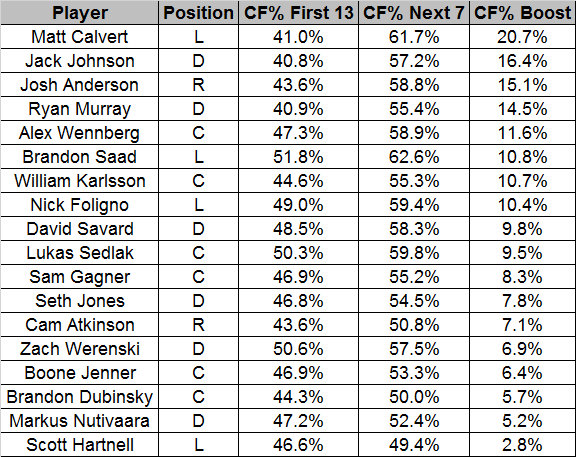
While I don’t have the answer to either question, I did want to dig around and think about the improvement. Let’s approach the questions a different way: which CBJ players have improved the most in the last seven games compared to the first thirteen? To evaluate, I used data from Corsica, using 11/14 as the cutoff (performance up to 11/14 for the first 13, performance after 11/14 for the next 7).
(Data in the table is a picture file. If you’d like access to a table with numbers you can copy, just let me know.)
For this table, I’ve only included players that appeared in both sets of games (the first 13 and the next 7). This means Prout, Harrington, Milano, and Bjorkstrand are all omitted.
The first takeaway: every player had a boost, so this is a team-wide change. The biggest improvements? Matt Calvert, Jack Johnson, Josh Anderson, and Ryan Murray who all picked up a positive 14-20 percentage point swing from their initial run.
In total, 8 different skaters jumped 10+ percentage points over their starting performance. Of those changes, only two are defensemen, the remaining 6 all forwards. Curiously, those forwards are all from two lines: Calvert-Karlsson-Anderson, and Saad-Wennberg-Foligno. (You can view linemate data by , checking out Calvert’s summary page on Hockey Viz, and Wennberg’s also at Hockey Viz. Calvert does come with an IR caveat tacked onto the end of the games to-date.)
This is a tidy way to consider the biggest forward changes, being able to focus on two lines. But big questions remain: what happened to these lines?
Looking at one player, in the case of Josh Anderson, reviewing his individual games on Natural Stat Trick reveals a big outlier: Colorado. In just 9:34 of 5v5 ice time against the Avs, Anderson was on with 20 shot attempts for the CBJ, and only 4 against. Even if we remove that game, Anderson’s CF% over the last 7 games changes to 54.0%. That’s still an impressive showing, and a +10 percentage point jump over his early-season woes.
That Colorado game was a sterling effort for most of the CBJ. Again looking to Natural Stat Trick, 14 different CBJ players were above the 60% mark on 11/21. Is it bad to find that only one game resulted in drastic upward movement? Is it good that the team had at least one dominant performance in their arsenal? How to interpret that finding is up to you.
Is there a similar one-off game issue for Wennberg’s line? Isolating again at Natural Stat Trick, this trio doesn’t have an obvious outlier. Removing the 19-7 show versus Calgary still yields a 56.6% CF% for Wennberg, a slightly dip from his double-digit gains when including the Flames game.
The reality for both forward lines: even the single supergames don’t account for the complete shift into the positive, leaving uncertainty about what to expect.
Columbus’ Twofold Change
Let’s pull apart the improvements a little more. What was more improved, shot generation or shot suppression? The answer: both.
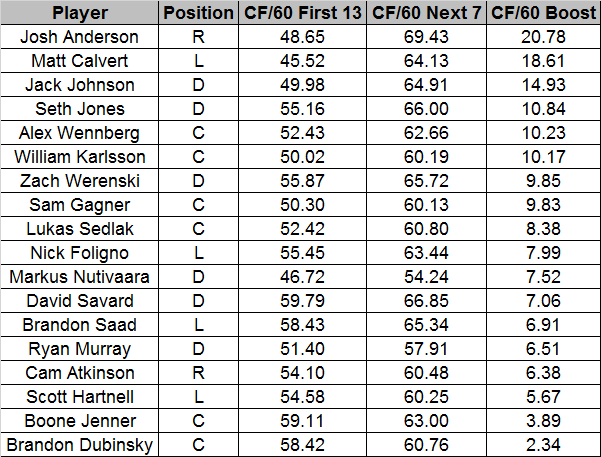
First, let’s look at the CF/60 in the first 13 compared to the next 7 games for all the Blue Jackets (again, data from Corsica). This represents shot rates for the CBJ per time on ice. A higher number means more shot attempts generated.
Here, we see that every single CBJ skater had a boost in their on-ice shot generation. Anderson-Calvert-Karlsson again show some of the biggest gains, pushed by the aforementioned Colorado game. Seth Jones also had a huge run against the Avalanche (almost 97 CF/60 that day, via Natural Stat Trick).
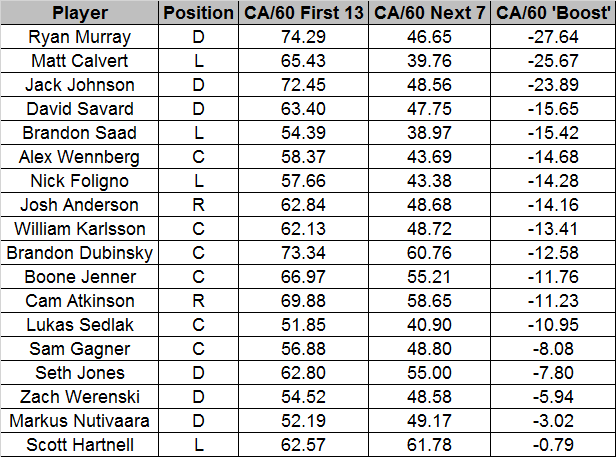
Next, let’s look at CA/60. This is shot attempts against the CBJ per time on ice. Here, lower is better and indicates shot suppression. The CA/60 ‘boost’ is sorted by most improved suppression, so more negative is better.
Again, it’s a team-wide improvement with similar names popping near the top. However, it’s three defensemen that see the biggest change in this metric: Ryan Murray, Jack Johnson, and David Savard.
The Caution and the Wait
Here’s the bad news: the shots against numbers you see above are well out of line with prior performances for the three d-men. Murray’s 3-year average CA/60 from 2013-2016 is around 54.67 (via Hockey Analysis). Johnson’s 3-year average CA/60 over the same span is 56.29 (via Hockey Analysis), and Savard’s is 56.19 (via Hockey Analysis).
Unfortunately, that information becomes the real sticking point: we have little reason to expect Murray, Johnson, and Savard to continue the level level of defensive play we see in the past seven games if they’ve never been up to the same level over the past several seasons. Unless something drastic has been enacted within the team, it’s hard to believe that this run continues much longer.
On the other hand, the early schedule was not kind to Columbus. In those first 13 games, the Jackets played current top-10 CF% teams 7 times. (Those teams: 1st place Los Angeles, 2nd Boston twice, 3rd St. Louis twice, 6th San Jose twice.) Maybe this really is a schedule correction, with Columbus landing as a midway team when all is finished.
And that’s where the waiting game begins, and the answers continue to elude. What’s next for the Blue Jackets? On the schedule, it’s a less arduous run: over the next 7 games, only Edmonton and Tampa rank in the top half of the league in current CF%. This means it’s a chance to see if the changes are real, if Columbus can really outshoot the opposition with consistency. If the CBJ come out well versus a (relatively) weak schedule, perhaps the improvements might stick a bit longer.
Add The Sports Daily to your Google News Feed!
