What makes a player so valuable?
The answer to this question varies depending on the person asked. However, it always becomes a hot-button topic of debate in baseball throughout the latter part of every season when discussing potential National League and American League MVP candidates.
We’re not here to discuss the definition of Most Valuable Player, though. We want to know which players have put together the best overall seasons while earning the award since 2000.
The best way to figure this out is by using Wins Above Replacement (WAR). While the statistics shown below focus on offense, WAR takes a player’s offensive and defensive contributions into consideration before providing an overall value for their performance.
FanGraphs’ version of WAR (referred to here as fWAR) will be the metric used to create our rankings. The definition of “Most Valuable Player” may forever be up for debate, but there’s no debate in figuring out which MVP winners have enjoyed the most success since the turn of the century (there was a tie at no. 10, so wRC+ was used as the tiebreaker).
Honorable Mentions
The following five performances were certainly enough to bring home some hardware at the end of their respective seasons, but they weren’t quite enough to crack our top 10.
| Year | Player | PA | OPS | ISO | HR | RBI | wRC+ | fWAR |
|---|---|---|---|---|---|---|---|---|
| 2015 | Josh Donaldson | 711 | .939 | .271 | 41 | 123 | 154 | 8.7 |
| 2009 | Albert Pujols | 700 | 1.101 | .331 | 47 | 135 | 180 | 8.4 |
| 2010 | Josh Hamilton | 571 | 1.044 | .274 | 32 | 100 | 175 | 8.4 |
| 2013 | Andrew McCutchen | 674 | .911 | .190 | 21 | 84 | 156 | 8.4 |
| 2016 | Kris Bryant | 699 | .939 | .262 | 39 | 102 | 149 | 8.4 |
It’s interesting to see Albert Pujols dominate every category amongst this group except for fWAR, while all five players are tightly packed together. The days of watching Pujols and Josh Hamilton contend for the award are long gone, but Josh Donaldson and Kris Bryant are far from done.
And obviously, Andrew McCutchen probably feels as though he also belongs in that “not done yet” category. He’s got a lot to prove after a rough 2016, but a strong finish after a slow start proved he at least won’t go down quietly.
The Top 10
There’s a lot of repetition – and probably a few questions – regarding the players who occupy the top 10. However, we’re going strictly by stats, and they tell us that a couple ballplayers performed better overall than the rest.
| Rank | Player | Year | PA | OPS | ISO | HR | RBI | wRC+ | fWAR |
|---|---|---|---|---|---|---|---|---|---|
| 1 | Barry Bonds | 2002 | 612 | 1.381 | .429 | 46 | 110 | 244 | 12.7 |
| 2 | Barry Bonds | 2001 | 664 | 1.379 | .536 | 73 | 137 | 235 | 12.5 |
| 3 | Barry Bonds | 2004 | 617 | 1.422 | .450 | 45 | 101 | 233 | 11.9 |
| 4 | Barry Bonds | 2003 | 550 | 1.278 | .408 | 45 | 90 | 212 | 10.2 |
| 5 | Alex Rodriguez | 2007 | 708 | 1.067 | .331 | 54 | 156 | 175 | 9.6 |
| 6 | Bryce Harper | 2015 | 654 | 1.109 | .319 | 42 | 99 | 197 | 9.5 |
| 7 | Mike Trout | 2016 | 681 | .991 | .235 | 29 | 100 | 171 | 9.4 |
| 8 | Alex Rodriguez | 2003 | 715 | .995 | .301 | 47 | 118 | 151 | 9.2 |
| 9 | Alex Rodriguez | 2005 | 715 | 1.031 | .289 | 48 | 130 | 174 | 9.1 |
| 10 | Albert Pujols | 2008 | 641 | 1.114 | .296 | 37 | 116 | 184 | 8.7 |
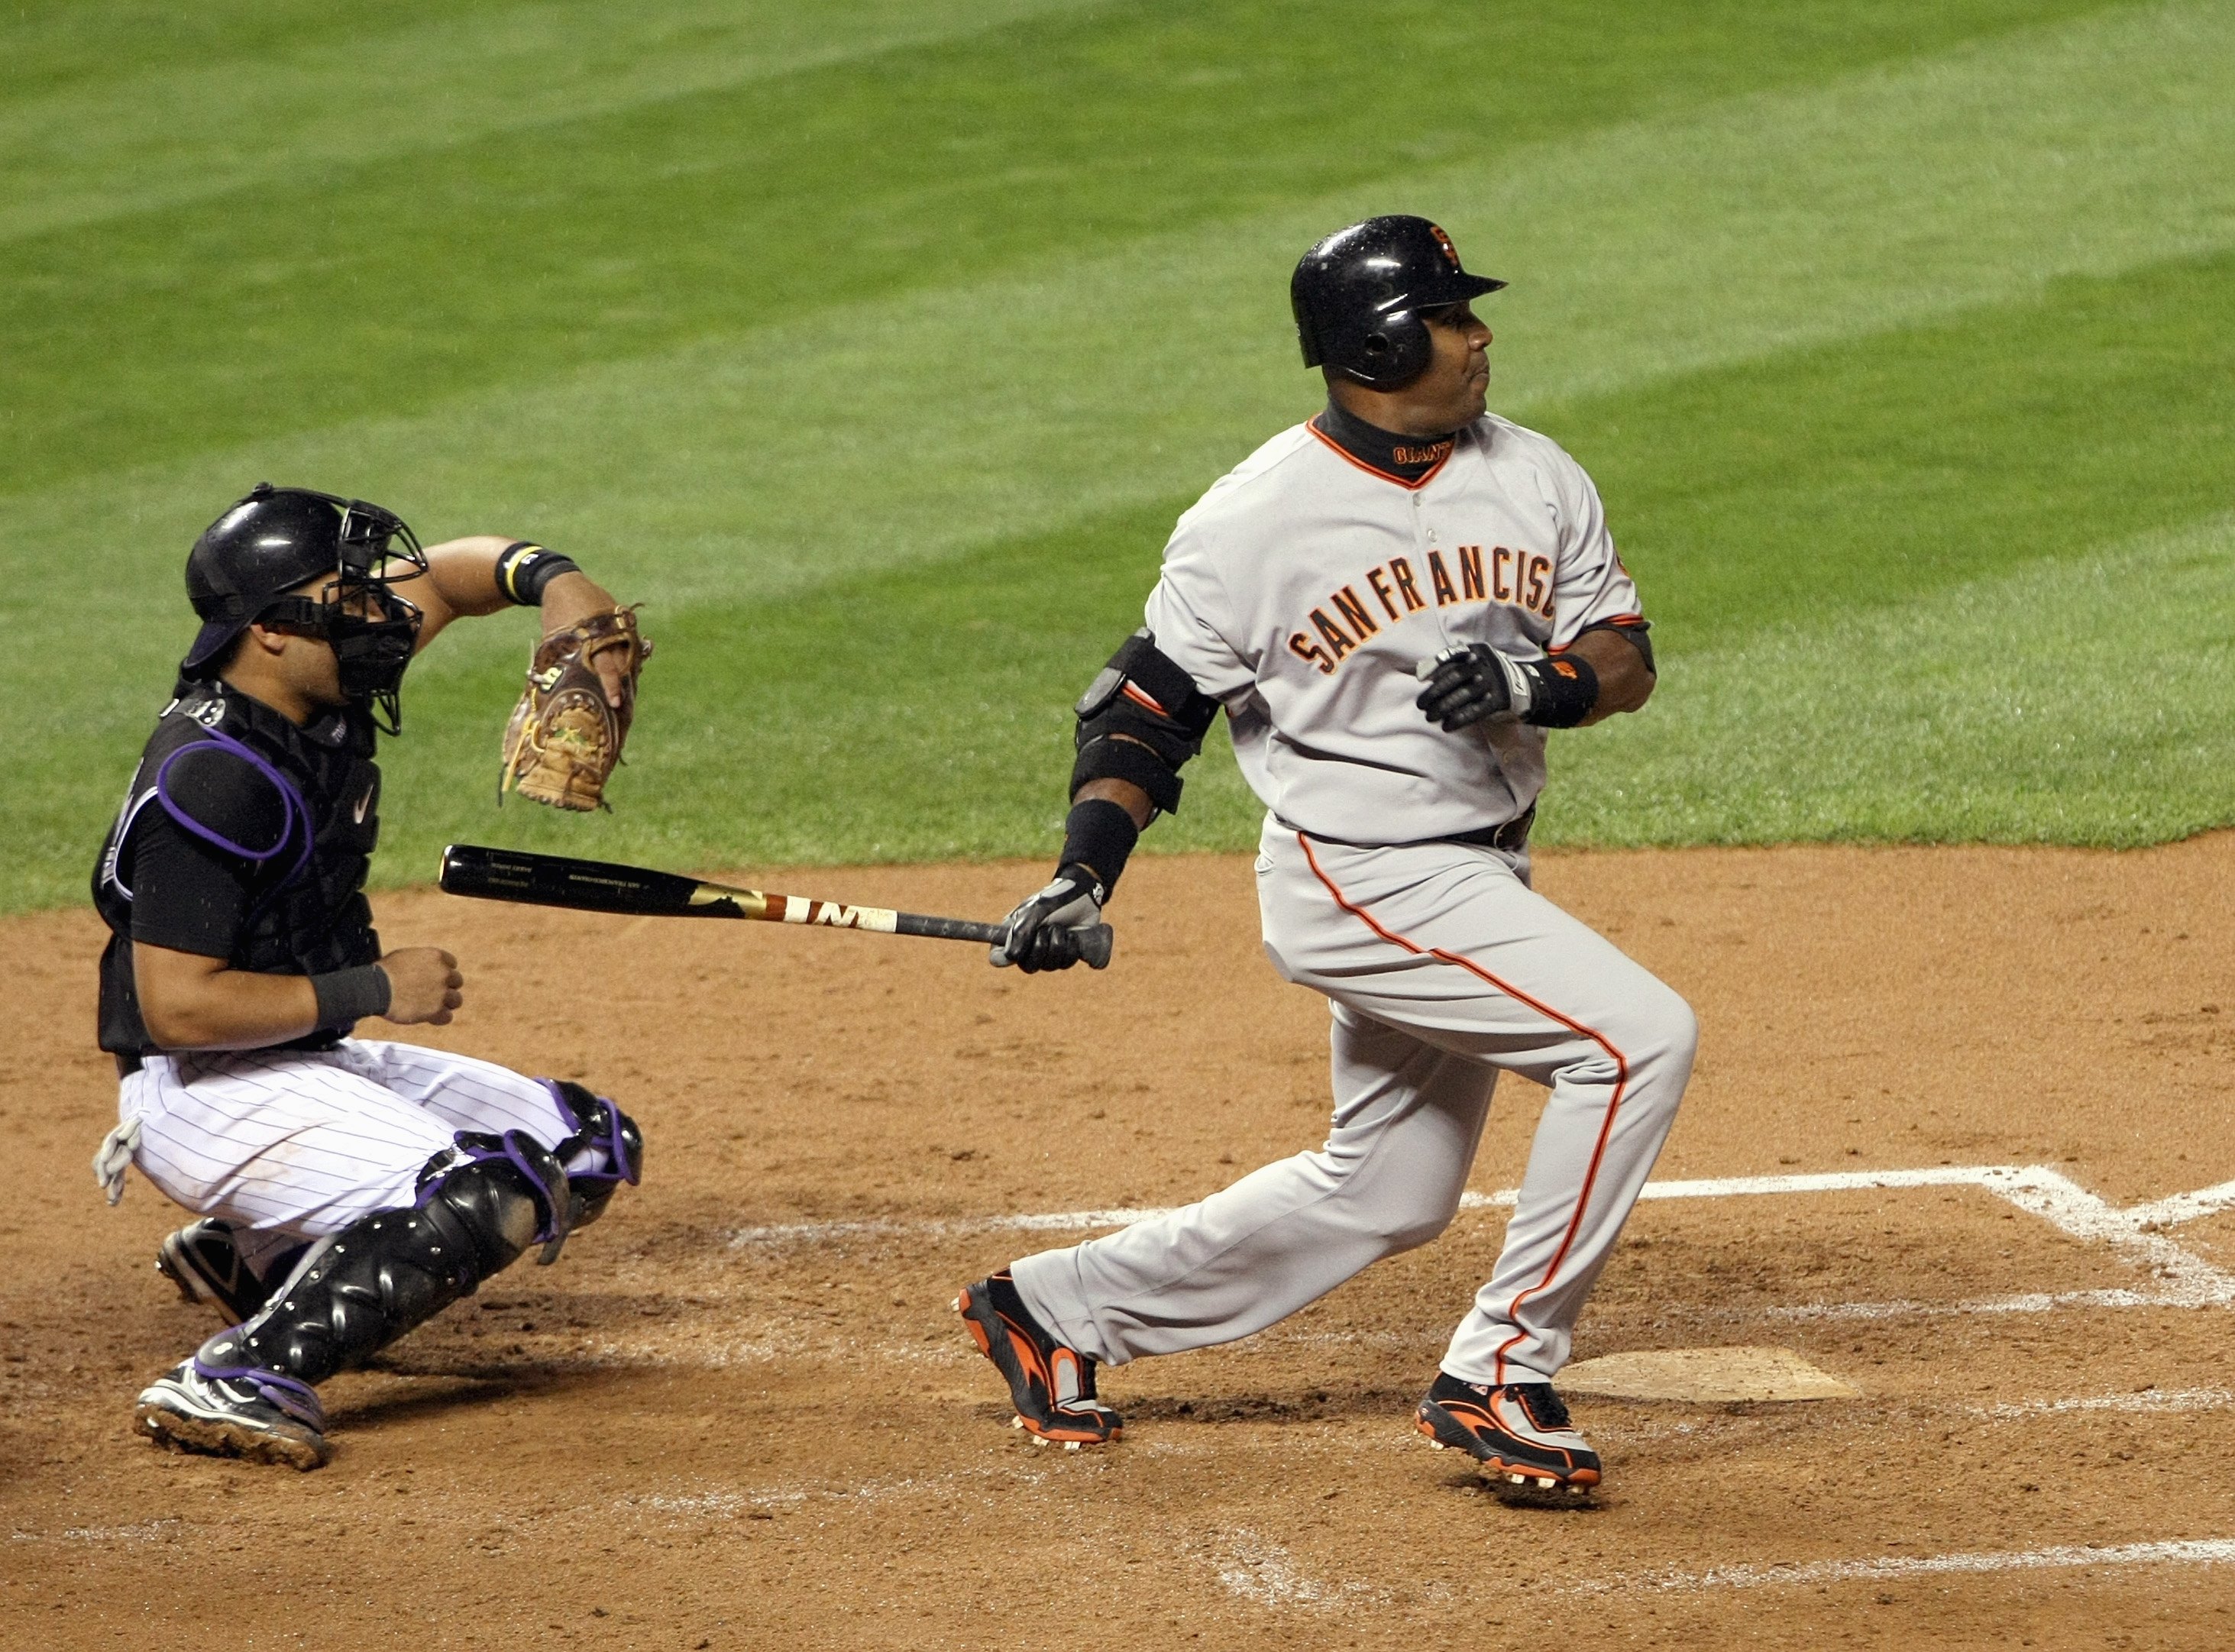
Performance-enhancing drugs or not, the four-year tear Barry Bonds went on between 2001-04 is just insane any way you slice it. He accumulated a ridiculous 47.3 fWAR during this time, which is just behind the career total of Hall of Famer Ralph Kiner (47.6).
The other player taking up multiple spots here is Alex Rodriguez, who also must deal with his own PED stigma. In the three 9.0-plus fWAR campaigns highlighted here, he hit at least 47 homers while never compiling a walk rate below 12.2% or a strikeout rate above 19.4%.
Byrce Harper’s 2015 performance was the kind people had been waiting for since he debuted as a 19-year-old in 2012. Although he produced one of the two seasons that failed to reach the 100-RBI plateau, his 197 wRC+ is the highest on this list of any player not named Barry Bonds. So, that’s definitely an accomplishment.
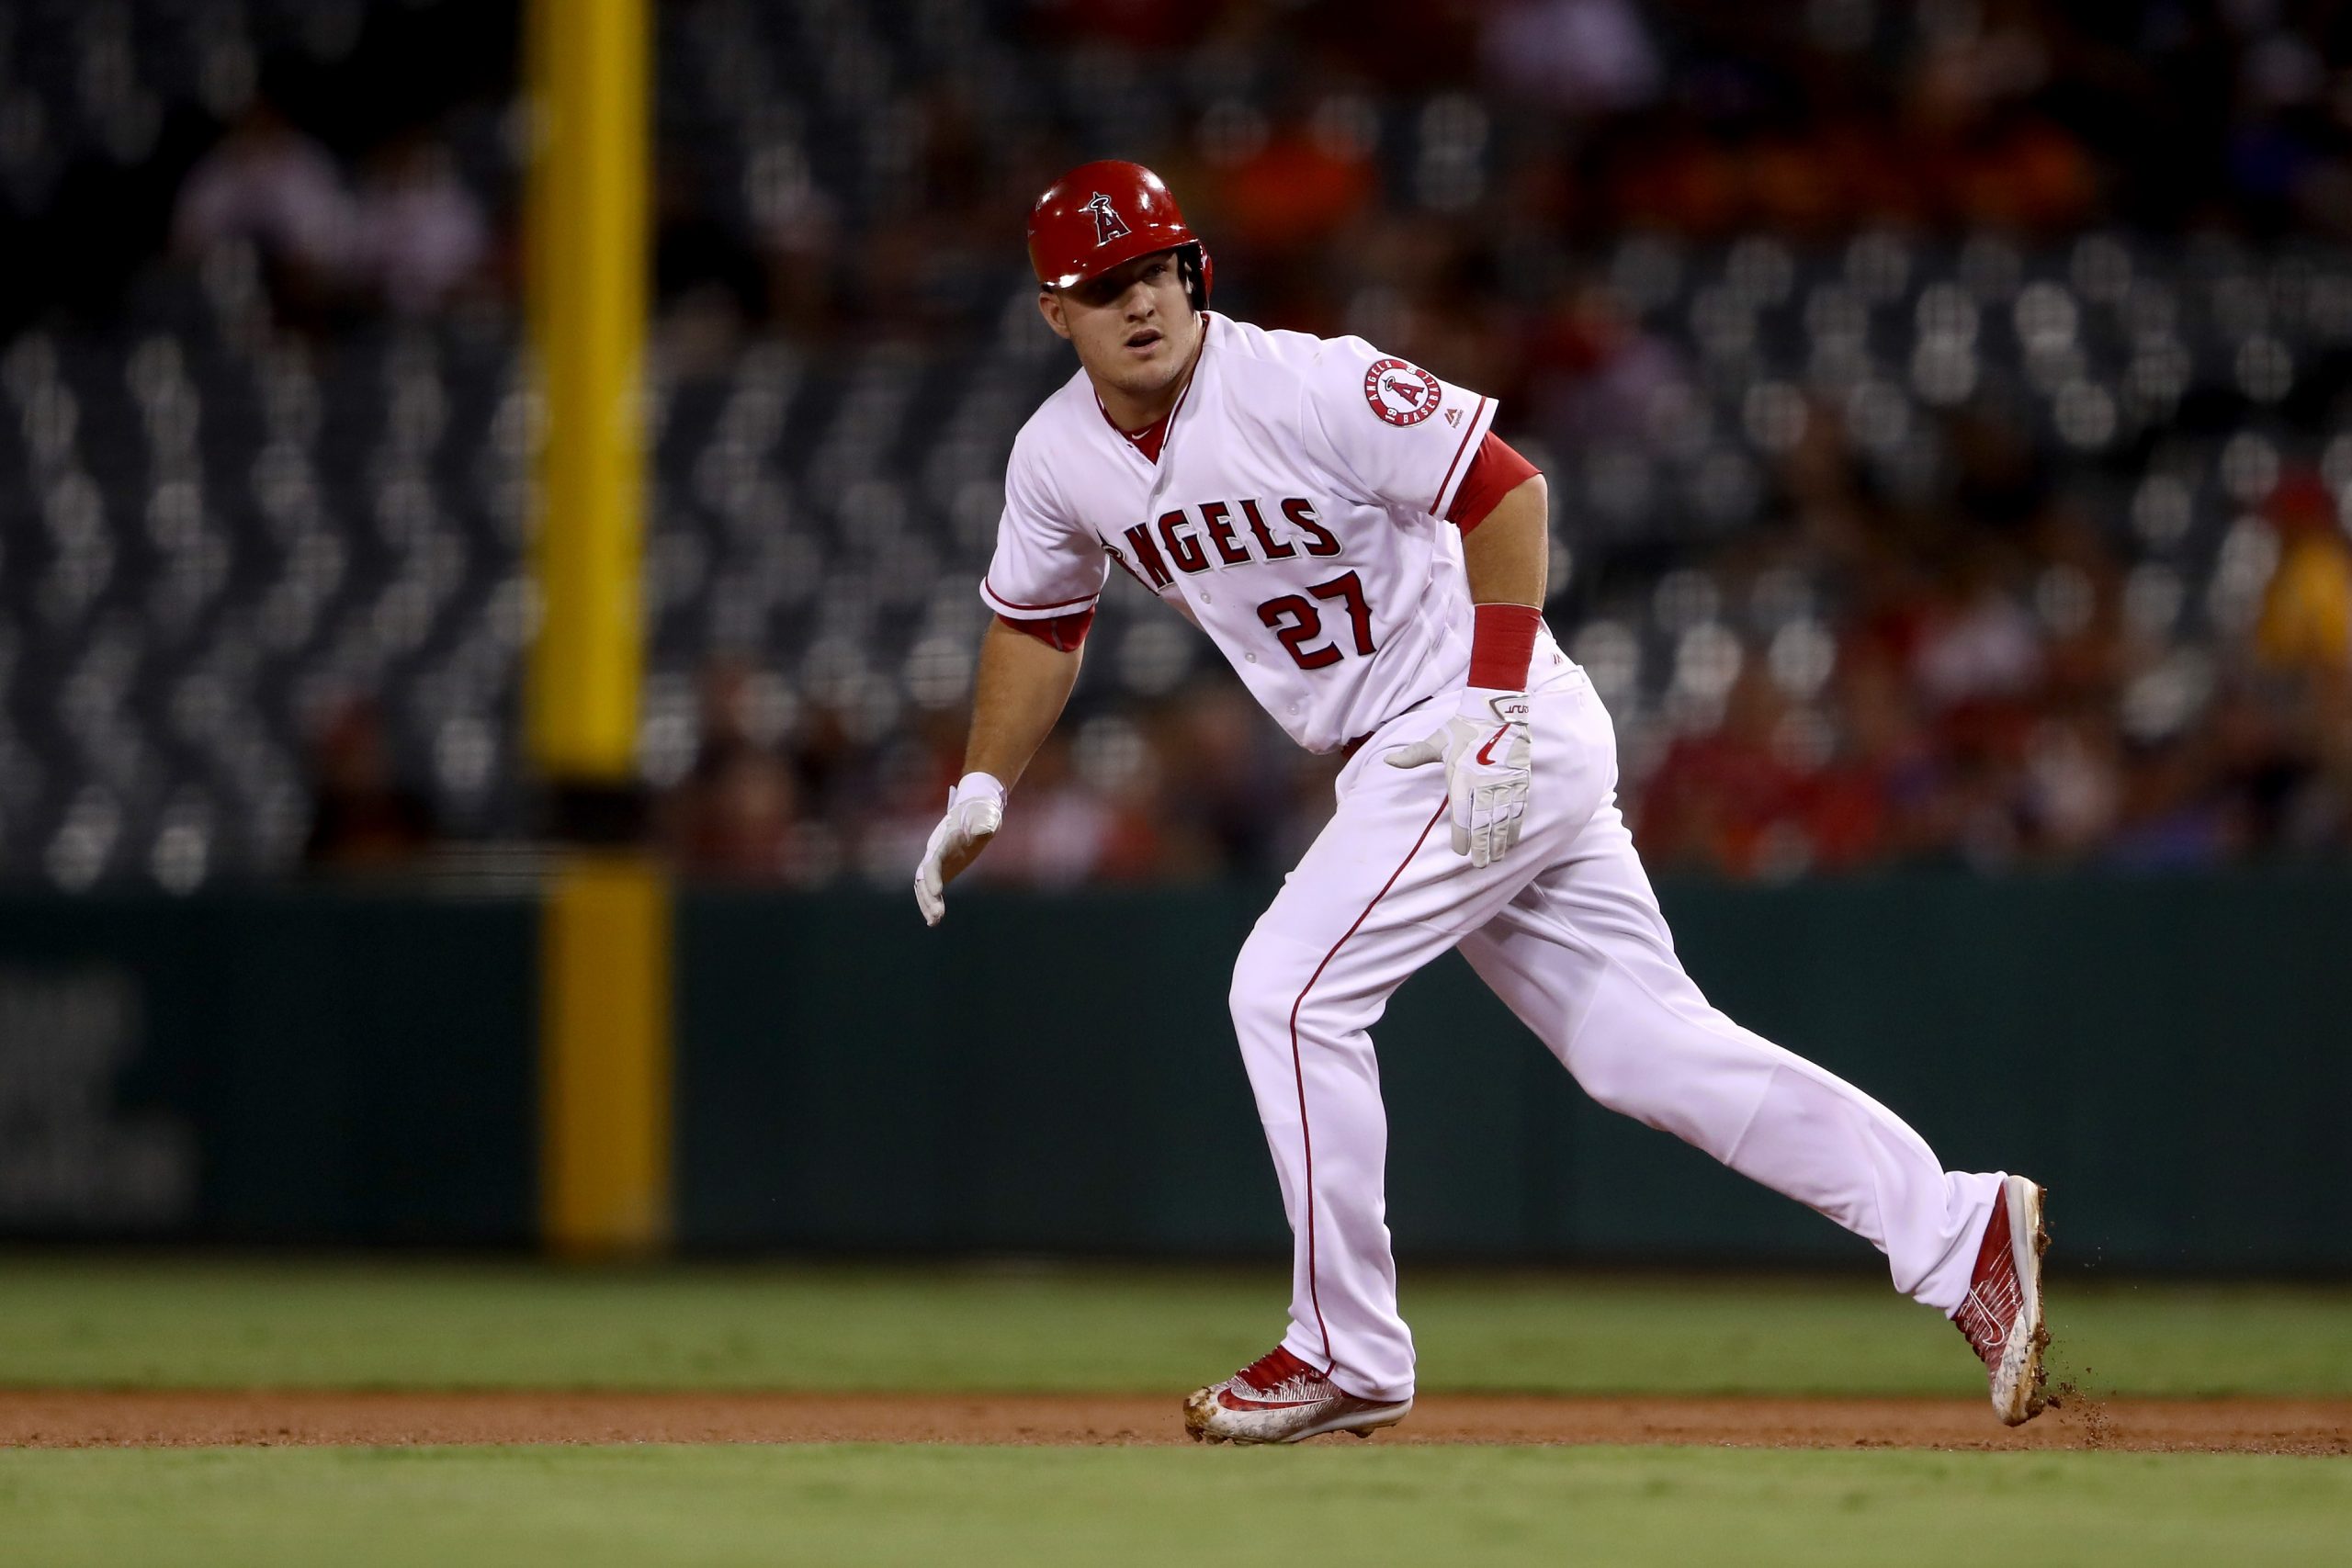
It just wouldn’t be a “Best of” MLB list without Mike Trout, right? He’s put together some ridiculous numbers throughout his young career, but a bunch of advanced stats show he could actually be getting better. Despite having the lowest ISO, fewest homers and third-fewest RBI of the group, he was aided by terrific baserunning (9.3 BsR), which included 30 stolen bases.
Pujols is the only other player to appear here multiple times, and it makes sense since he was a hitting machine earlier in his career. After all, he did walk twice as often (16.2% BB rate) as he struck out (8.4% K rate) in 2008.
He’s not the hitter he used to be, but Pujols still doesn’t strike out as much as the standard power hitter – he’s amassed an 11.5% walk rate and 10.0% strikeout rate throughout his career entering 2017.
Conclusion
Even though many will want to put asterisks by Bonds and Rodriguez above – especially in the top five spots – looking at the pure stats they produced is pretty crazy. It would be much more impressive if their performances didn’t have that PED stench.
But they do, and that discounts their performances quite a bit. However, this kind of comparison also helps further put Harper’s 2015 campaign into perspective.
Will one of MLB’s eventual MVP winners in 2017 crack this list? Will it be a familiar name or a fresh face? The bar has been set pretty high, and we’ll find out which players are up for the challenge soon enough.
Statistics courtesy of Baseball-Reference. Advanced statistics courtesy of FanGraphs, unless otherwise noted.
Thanks for reading! If you’d like to jumpstart your sportswriting career and aren’t sure how, check out my eBook. Don’t forget to follow me on Twitter so we can chat about baseball: @mmusico8.
Add The Sports Daily to your Google News Feed!

