As we count down the days until Selection Sunday, everyone will be inundated with talk of who is “in” and who is “out” of the NCAA Tournament field. Of course, we won’t know for sure who is in or out until Selection Sunday, and the only way to ensure a spot in the field of 68 is to win your conference tournament. The rest is all projection, but thanks to some great tools like CBS Sports’ Team vs Team Comparison and the Team Sheets on Warren Nolan’s site, it has become increasingly easy for the common fan to try their hand at bracketology. Since ESPN has the broadcasting rights to most major conference games, the airwaves will be flooded with analysts citing Joe Lunardi’s Last Four In / First Four Out. To make matters worse, in-game analysts will proclaim a team “definitely in” after winning a single game. As The Bracket Matrix has shown, Lunardi is a slightly-below average bracketologist, he is just fortunate to have a bigger platform than the rest of us. One of the other drawbacks of ESPN is that they routinely force the BPI metric as a system for rating teams. BPI is useful, but like the KenPom rankings, it is not a metric that the NCAA Tournament Selection Committee uses. Therefore, any time someone cites BPI or KenPom in relation to a team’s bubble chances, it should be taken with a grain of salt.
The RPI is not a perfect metric of analysis, and many statisticians have developed better models for quantitatively ranking teams. That said, the NCAA Selection Committee uses the RPI as one of their metrics, not just as a way to rank teams, but as the framing for the entire tournament selection discussion. Every discussion of a team’s Top 50 wins, record against the Top 100, or losses outside the Top 100 is all framed by the RPI. Those data points are inherently tied to the RPI because “Top 50 wins” really means “Wins over teams in the RPI Top 50” and “losses outside the Top 100” really means “losses to teams with an RPI over 100.” Love it or hate it, the RPI frames the entire tournament discussion, so it has to be taken into consideration when discussing potential tournament teams. For the last few years, the NCAA released their RPI calculations on a weekly basis as part of an effort to bring some transparency to the Selection Committee process. I have been tracking the RPI of Tournament teams for the last 9 years (since the 2008 Tournament) and compiled data on how RPI compared to the probability of a team making the tournament.
The NCAA Tournament has evolved in the 10 years since 2008. In 2008, the field was comprised of only 65 members and there was only one play-in game. In 2008 there were 31 Automatic Bids and 34 At-Large bids that were handed out by the Committee. In 2011 the field was expanded to 68 teams with 37 teams receiving At-Large bids and 4 Play-in games occurring – 2 between the bottom 4 teams in the field and 2 between the lowest seeded 4 At-Large teams. In 2014, with the breakup of the Big East and the formation of the American Athletic Conference, 32 Automatic Bids were awarded and the At-Large qualifiers shrunk to 36. Over the last nine years, there have been 321 At-Large bids awarded by the Selection Committee. Of those 321 bids, 251 (78%) were awarded to teams from Major conferences and 70 (22%) to teams from smaller conferences.
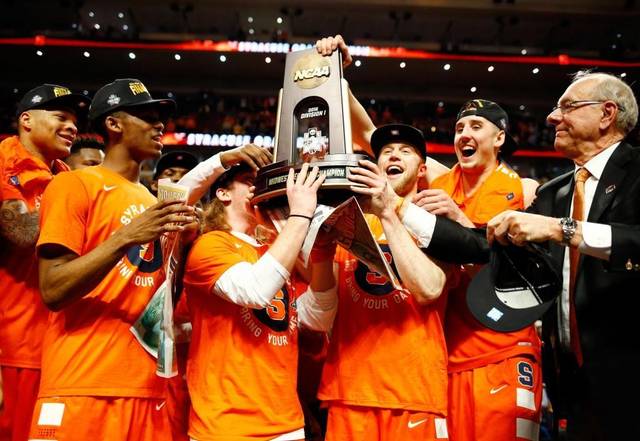
For purposes of this article, I’m defining the “Major” Conferences as the “Big Six” from 2008-2013 (Big Ten, ACC, SEC, Big XII, Pac 10/12, and Big East). “Mid-Major” Conferences are the other 25 leagues that receive automatic bids to the NCAA Tournament. For 2014, I kept the Big East as a “Major” Conference and defined the AAC as a “Mid-Major” conference. As I will note later, this trend was followed in the seeding of AAC teams in 2014 and 2015 but the Committee broke from that tradition and treated the AAC more like a Major Conference in 2016. During the last nine years the highest RPI of any team to receive an At-Large bid was USC’s 73 in 2011. The only other team with an RPI over 65 to get an At-Large bid was Syracuse (RPI 70) in 2016. It should be noted that Syracuse’s worst losses did occur while Jim Boeheim was serving a suspension, which was not accounted for by the RPI but may have been taken into consideration by the Committee. The Committee was rewarded with their selection of the Orange last year, who made a run to the Final Four. Given that the highest RPI for an at-large team in my data set was 73, my analysis focuses on teams with Top-75 RPIs. As you may expect, the committee has been much more forgiving of Major Conference Schools for lower RPIs than they are of Mid-Major schools.
The Top 30 Guarantee
Over the last nine years, 268 teams have entered Selection Sunday with a Top 30 ranking in the RPI (2 Top 30 teams were ineligible for the Tournament because of NCAA violations). Of those teams, 88 were conference champions that received automatic bids to the Big Dance. For the other 180, all except two received invitations to the Tournament. The only two to miss were Colorado St in 2015 and St Bonaventure in 2016 who both had RPIs of 30. All 175 at-large eligible teams with RPIs under 30 received bids. Major Conferences accounted for 137 of the 178 at-large bids and Mid-Majors for 41. Currently, there are a few Mid-Major situations where this guarantee should come into play. Gonzaga has been an absolute force this year and is the only remaining unbeaten team at 28-0. The Zags should feel comfortable, even if they somehow don’t end the season undefeated or fall in the West Coast Conference Tournament. St Mary’s should also feel confident in their current position with a Top 15 RPI and no losses outside the Top 40. As long as the Gaels avoid any bad losses the rest of the season they should be in good shape to make the Tournament. In the AAC, Cincinnati and SMU are the front-runners, both having Top 20 RPIs. The dangerous situations that will test this Guarantee is in the Atlantic 10. VCU and Dayton have been the best teams all season but both have questionable resumes – VCU has two sub-100 losses and Dayton’s best win is over Vanderbilt (RPI 47).
Major Conference Surety: Be in the Top 50
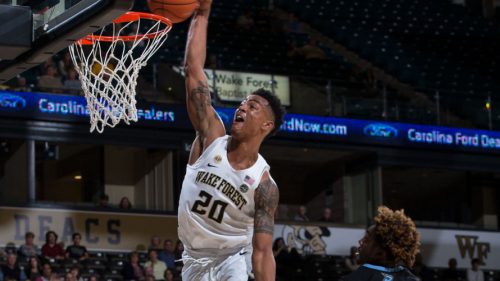
Major Conference schools with Top 50 RPIs have fared very well on Selection Sunday. All 43 schools that had an RPI between 31 and 40 were awarded At-Large bids. Only four Major Conference schools have missed the Tournament with Top 50 RPIs (Ole Miss and Ohio State in 2008 who had RPIs of 48 and 49 and Missouri and Minnesota in 2014 who had RPIs of 49 and 50). This means that 91% (38 of 42) of Major Conference schools with an RPI between 41 and 50 have gone dancing and the only ones that have missed have had RPIs of 48 or higher. There are some interesting cases this year that will put this theory to the test. The most interesting scenario is Wake Forest who has great computer numbers (RPI 39, SOS 19, NCSOS 16) and has no losses outside the Top 75. However, the Deacons have just 1 win in the Top 60 (vs #38 Miami). Similarly, California (RPI 46) has just 1 Top 50 win (vs USC) and has a questionable loss to #102 San Diego St on a neutral floor. Their second best win is against Princeton and they have just 4 Top 100 victories. Vanderbilt (RPI 47) has a road win over Florida (which is a better win than many on the bubble can boast) but have lost 13 games, including 6 to teams ranked between 51 and 85.
Major Conference Gamblers: 51 to 60
There is a clear delineation between the Top 50 and those outside the Top 50 in the RPI for Major Conference schools. After the Top 50, only 56.5% (26 of 46) of schools have received At-Large invitations. Most famously, Virginia Tech has been shut out twice (2008 and 2010) with an RPI of 52. In 2014, Missouri (RPI 49), Minnesota (RPI 50) and Florida St (RPI 54) were the highest ranked Major Conference schools not to receive a tournament bid while Kansas St (RPI 51), NC State (RPI 55) and Iowa (RPI 57) were the lowest rated schools to get in. Interestingly, NC State and Iowa were among the Last 4 In and played in Play-In games while Kansas St received a 9-seed (and Missouri, Minnesota and Florida St went to the NIT). Having an RPI in the 50s is a gamble and brings other factors such as strength of schedule and strength of victories into question. Teams with RPIs in this range are a mixed bag and incredibly resume-dependent. In 2009, Boston College received a 7-seed with an RPI of 60 while Florida, Baylor, Georgetown and South Carolina were left out, despite having RPIs between 54 and 58. Last year, a trio of SEC teams were the highest-ranked major conference schools to be left out. Florida (RPI 54), Georgia (RPI 60), and South Carolina (RPI 62) all went to the NIT while Vanderbilt (RPI 63) and Syracuse (RPI 70) both got at-large bids.
How did they get in?
For Major Conference schools with RPIs between 61 and 70, only 6 out of 35 possible teams (17.1%) have been awarded At-Large bids. In 2009, Arizona was one of the last teams in with an RPI of 62 and a 12-seed in the tournament. The Wildcats then proceeded to defeat 5th-seeded Utah and 13th-seeded Cleveland State en route to the Sweet 16 In 2012, West Virginia was awarded a 10-seed despite and RPI of 64 and subsequently got pounded by Gonzaga in a game that I attended at the CONSOL Energy Center. As I already mentioned, USC received a bid in 2011 with an RPI in the 70s and last year Syracuse got a bid with an RPI of 70 and made a run all the way to the Final Four.
The Mid-Major Disadvantage
Even though every team with an RPI under 30 has made the Tournament in the last 9 years, there is a sharp drop-off for Mid-Major schools after the 30th spot in the RPI. For Mid-Majors with an RPI between 31 and 40, only 14 of 29(48.3%) have received At-Large bids. Besides the two teams mentioned earlier (2015 Colorado St and 2016 St Bonaventure) who missed the field with RPIs of exactly 30, 2013 Southern Miss (RPI 31), 2016 San Diego St (RPI 32), 2014 Southern Miss (RPI 32) and 2008 Dayton (RPI 32) squads were the highest ranked teams not to receive an At-Large bid. Illinois State was also shut out in 2008 with an RPI of 33 and San Diego State with an RPI of 34 was shut out the following year in 2009. Temple was left out in 2015 with an RPI of 34. As RPIs increase to the 40s, the liklihood of a Mid-Major team receiving a bid remains about the same as 13 of 28 (46.4%) have received bids. It is worth noting that 9 of these 13 came from either the A-10 and Mountain West, two of the biggest Mid-Major Conferences. Within the same RPI range of 41-50, Major Conference teams have nearly double the rate of at-large bid awards as Mid-Majors (90.5% to 46.4%). This is a clear disadvantage for Mid-Major schools.
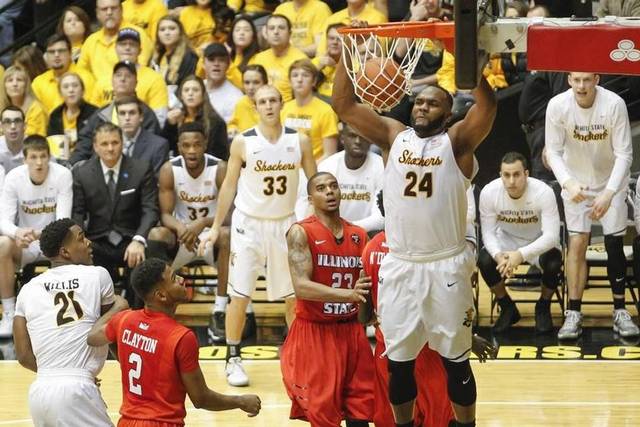
The biggest discrepancy for Mid-Majors comes in the next segments. Between 2008 and 2015, no Mid-Major school with an RPI over 50 was awarded an At-Large. The 2016 bracket was a bit of an anomoly as two teams from the American Athletic Conference with RPIs over 50 received at-large bids. At the outset I mentioned that I categorized the AAC as a mid-major, which fit their trends in 2014 and 2015. In 2014, SMU (RPI 53) was left out while UConn (RPI 21) was drastically under-seeded as a 7-seed. The Huskies defied that seeding and went on to win the NCAA Tournament. In 2015, Temple (RPI 38), and Tulsa (RPI 45) were both left out of the field while SMU received a 6-seed despite an RPI of 12 (the only team in the Top 13 of the RPI not to be at least a 4-seed). However in 2016 the Committee reversed course. Cincinnati (RPI 47) was awarded a 9-seed, Temple (RPI 59) was awarded a 10-seed, and Tulsa (RPI 61) was the last team in the field. Those numbers do not at all match up with the other mid-major trends and are certain outliers, much more in line with the Major conference RPI trends. It is hard to say how the Committee will treat the AAC this year, though it may not matter much as only Houston has an RPI between 50 and 70. There is a long way to go until Selection Sunday, but teams like Middle Tennessee (RPI 31), UT-Arlington (RPI 34), UNC-Wilmington (RPI 37), Nevada (RPI 41), Wichita St (RPI 42), and Monmouth (RPI 45) will be sweating it out come Selection Sunday if they fail to win their conference tournaments. Only three mid-major teams, Dayton (RPI 27), Illinois St (RPI 33) and Rhode Island (RPI 49), are currently ranked in the Top 50 of the RPI and are not leading their respective conferences.
Obviously there are a lot of other factors that go in to the Selection Committee’s decision-making process, but when looking at the rough percentages of teams that have been awarded At-Large bids, there are clear delineations for which teams have increased probabilities of making the Dance. Major Conference teams with Top 50 RPIs are almost guaranteed to get a bid while Mid-Major schools basically need to be ranked 20 places higher than their Major-conference counterparts to feel a similar level of comfort. While RPI can be used for roughly determining who should or should not be in the field of 68, it is not a good indicator for where teams will be seeded. In conclusion, RPI isn’t the be-all-end-all for the Committee, but keeping a close eye on a team’s ranking in the RPI should give a good indication of their chances to make the field. Of course, every school in the country has the opportunity to receive an automatic bid to the Dance by winning their conference tournament and taking the decision out of the Selection Committee’s hands entirely.
Add The Sports Daily to your Google News Feed!