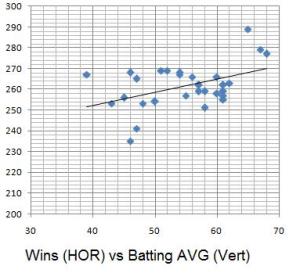
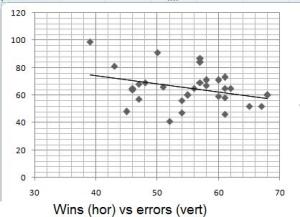
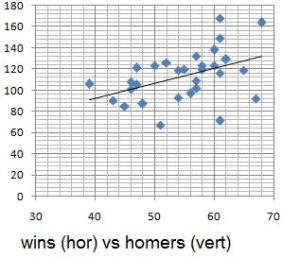
So, I wanted to do some research to find out exactly what was the most important thing in baseball, statistically. I didn’t really break it down with overall trendlines or anything. I just plotted the graphs and eyeballed it. Science! The 4 stats I used were errors, ERA, home runs and batting average. First, some scatter plots, using this seasons stats:

If I had to judge, looking at these graphs (and a few more I made but didn’t post out of laziness), the most important things when building a baseball team are:
Pitching
Power hitting
Contact hitting
Defense
There is a big gap between Power and Contact, of course. Rudimentary research, of course, but I still find it interesting.
Add The Sports Daily to your Google News Feed!


