By Coug-A-Sutra
Hello Followers. Hope you’re doing great.
Well, we’re now one week away from the season opener against Rutgers. And so, after today’s practice, Game Week will finally be upon us!
Normally, the excitement of the upcoming season is palpable. And this year? Well, it seems to have gotten a tad bit gloomy.
For example, yesterday, WSU announced that a paltry 25,000 tickets have been sold for the Seattle game.
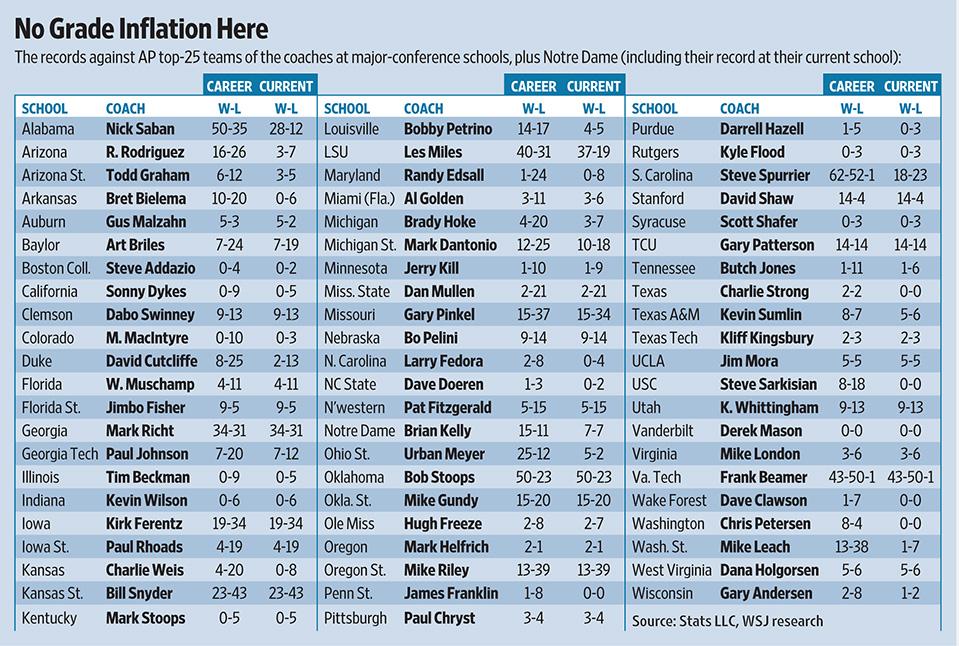
Then, later in the day, the Wall Street Journal released a pretty cool graphic that depicts how current major FBS coaches have fared against top 25 opponents.

As you can tell from this graphic, Mike Leach’s overall record against ranked teams isn’t very good (and neither is Mike Riley’s, FWIW).
So, that graphic started a bit of chatter on the Twitter universe about how Mike Leach may not be a very good coach. Once that started, a few others in the Twitterworld started tweeting about the disaster-ridden tenure of Paul Wulff.
And then, if that wasn’t bad enough, others began to doubt about whether this team is even good enough to return to a bowl game!
And me? Well, I’ve said for a some time now that I think this team is going to be pretty darn good. In fact, I think that this team has the potential to be special. And by “special,” I mean that I fully expect this team to win at least 8 regular season games this year.

So, the question facing all of us right now is which expectation is more (or less) realistic? Should I and the rest of Cougar Nation dare to dream? Or, should we brace ourselves for a let-down season a la 2012?
So, in light of these questions, I wanted to take a few (very quick) moments to stroll down memory lane and take a look at some key statistics from those Cougar Football teams that enjoyed a regular season mark of .500 better (excluding the 1994 team because they were representative of nothing due to that insane defense)
As you will see, the first table below presents the season totals for the quarterbacks.
| Season | QB | Comp | Att | Comp% | Yards | TDs | Int |
| 1992 | Bledsoe | 241 | 432 | 55.7 | 3246 | 20 | 15 |
| 1997 | Leaf | 227 | 410 | 55.4 | 3968 | 34 | 11 |
| 2001 | Gesser | 185 | 335 | 54.9 | 2729 | 25 | 10 |
| 2002 | Gesser | 236 | 402 | 58.7 | 3408 | 28 | 13 |
| 2003 | Kegel | 218 | 394 | 55.3 | 2947 | 21 | 15 |
| 2006 | Brink | 241 | 396 | 60.9 | 2899 | 24 | 13 |
| 2013 | Halliday | 449 | 714 | 62.9 | 4597 | 34 | 22 |
Mindful that the game has changed a whole lot over the past 22+ season, a couple of things stood out to me when I looked at these numbers. The first was how stinking great Ryan Leaf’s 1997 season was relative to the other notable WSU quarterbacks of the same era. Second: I was surprised by how comparably low the completion percentages were for Leaf, Bledsoe, and Gesser—I expected each to have been well above 60%. Third: I was surprised to see how comparable Kegel’s numbers were to Gesser’s—especially Gesser’s first 10 win season in 2001. Finally, I found myself surprised to see how historically great Connor’s numbers were last year, and especially, the mind-numbing nature of his pass attempts. Incredible.
The second Table provided below presents the rushing leaders for each of those teams (for the 2006 and 2013 seasons, I included the top 2 in rushing yards, since they were both RB-by-committee type teams). This statistic is important because while WSU has been a pass-first program since the Price era, the only time we’ve ever been any good was when we could run the football. In fact, with the notable exception of 2005, WSU has NOT had a losing record when its top RB has exceeded 1,000 yard mark.
| Season | RB | Att | Yards | Yards Per Carry | |
| 1992 | Wright-Fair | 264 | 1381 | 5.2 | |
| 1997 | Black | 242 | 1181 | 4.88 | |
| 2001 | Minnich | 175 | 765 | 4.37 | |
| 2002 | Green | 150 | 829 | 5.5 | |
| 2003 | Smith | 224 | 961 | 4.3 | |
| 2006 | Tardy/Woolridge | 223 | 997 | 4.47 | |
| 2013 | Mason/Caldwell | 137 | 700 | 5.1 |
For me, this Table includes a few interesting bits of information. First, I found it noteworthy that last year’s team was right up there with the greats with respect to yards-per-carry. Second, it seemed significant that, even though our YPC was excellent for us historically, neither Mason nor Caldwell is slated to see the field much this year—even though both are returning. So, as we look forward to how Wicks/Morrow/West might fare this season, I think we can be pretty confident that we’re going to see an uptick in those numbers.
Of course, absent from both Tables are defensive statistics. So, with that in mind, the next Table shows the average points per game scored and allowed by each team that was mediocre or better in the last 22 years (in case you were wondering, the 1994 team allowed 11 points a game).
| Season | Avg. Pts Scored | Avg. Pts Allowed | |
| 1992 | 27.1 | 23.4 | |
| 1997 | 40.2 | 24.7 | |
| 2001 | 35 | 22.4 | |
| 2002 | 33.2 | 22.8 | |
| 2003 | 30.3 | 19.8 | |
| 2006 | 24.6 | 23.1 | |
| 2013 | 31 | 32.53 |
As you can see, last year’s team was clearly the worst defensive Cougar team that has achieved a .500 mark or better in the regular season. What’s even more shocking is the fact that we averaged more points allowed than points scored, even when non-conference blow-outs against Southern Utah and Idaho are included in the total.
For that reason, my Final Table emphasizes three statistics. The first is our average points scored in conference games. The second is the average number of points the OFFENSE scored in conference games. And the final is the average points per game our defense allowed in conference games.
| Season | PPGScored | Off. PtsScored | PPGAllowed | |
| 2013 | 27.1 | 23.3 | 37.1 |
Clearly, this last Table is the one which could ignite the arguments of the naysayers, while sending optimists like myself to the oxygen tank. Because when you take away those defensive touchdowns, we were outscored by nearly two touchdowns a game in conference last year.
So, as we look forward to the 2014 season, one could argue that with the loss of Buchanan, we might expect to see this team’s defensive numbers worsen this year. And boy would that be bad!!!
But, the flip to all that is to wonder about how those defensive numbers might change if the offense actually starts scoring some points and if the Defensive Line is able to remain fresh for four quarters!
And so, just like every year, it seems like the big question facing this year’s team is whether we will finally witness the emergence of a Cougar team that lights up the scoreboard. If we do, then the optimists like yours truly will be able to stand tall, knowing that “we told you so” in the face of low-to-bland expectations. And if not…
Go Cougs!!!!!!!!!
Add The Sports Daily to your Google News Feed!


