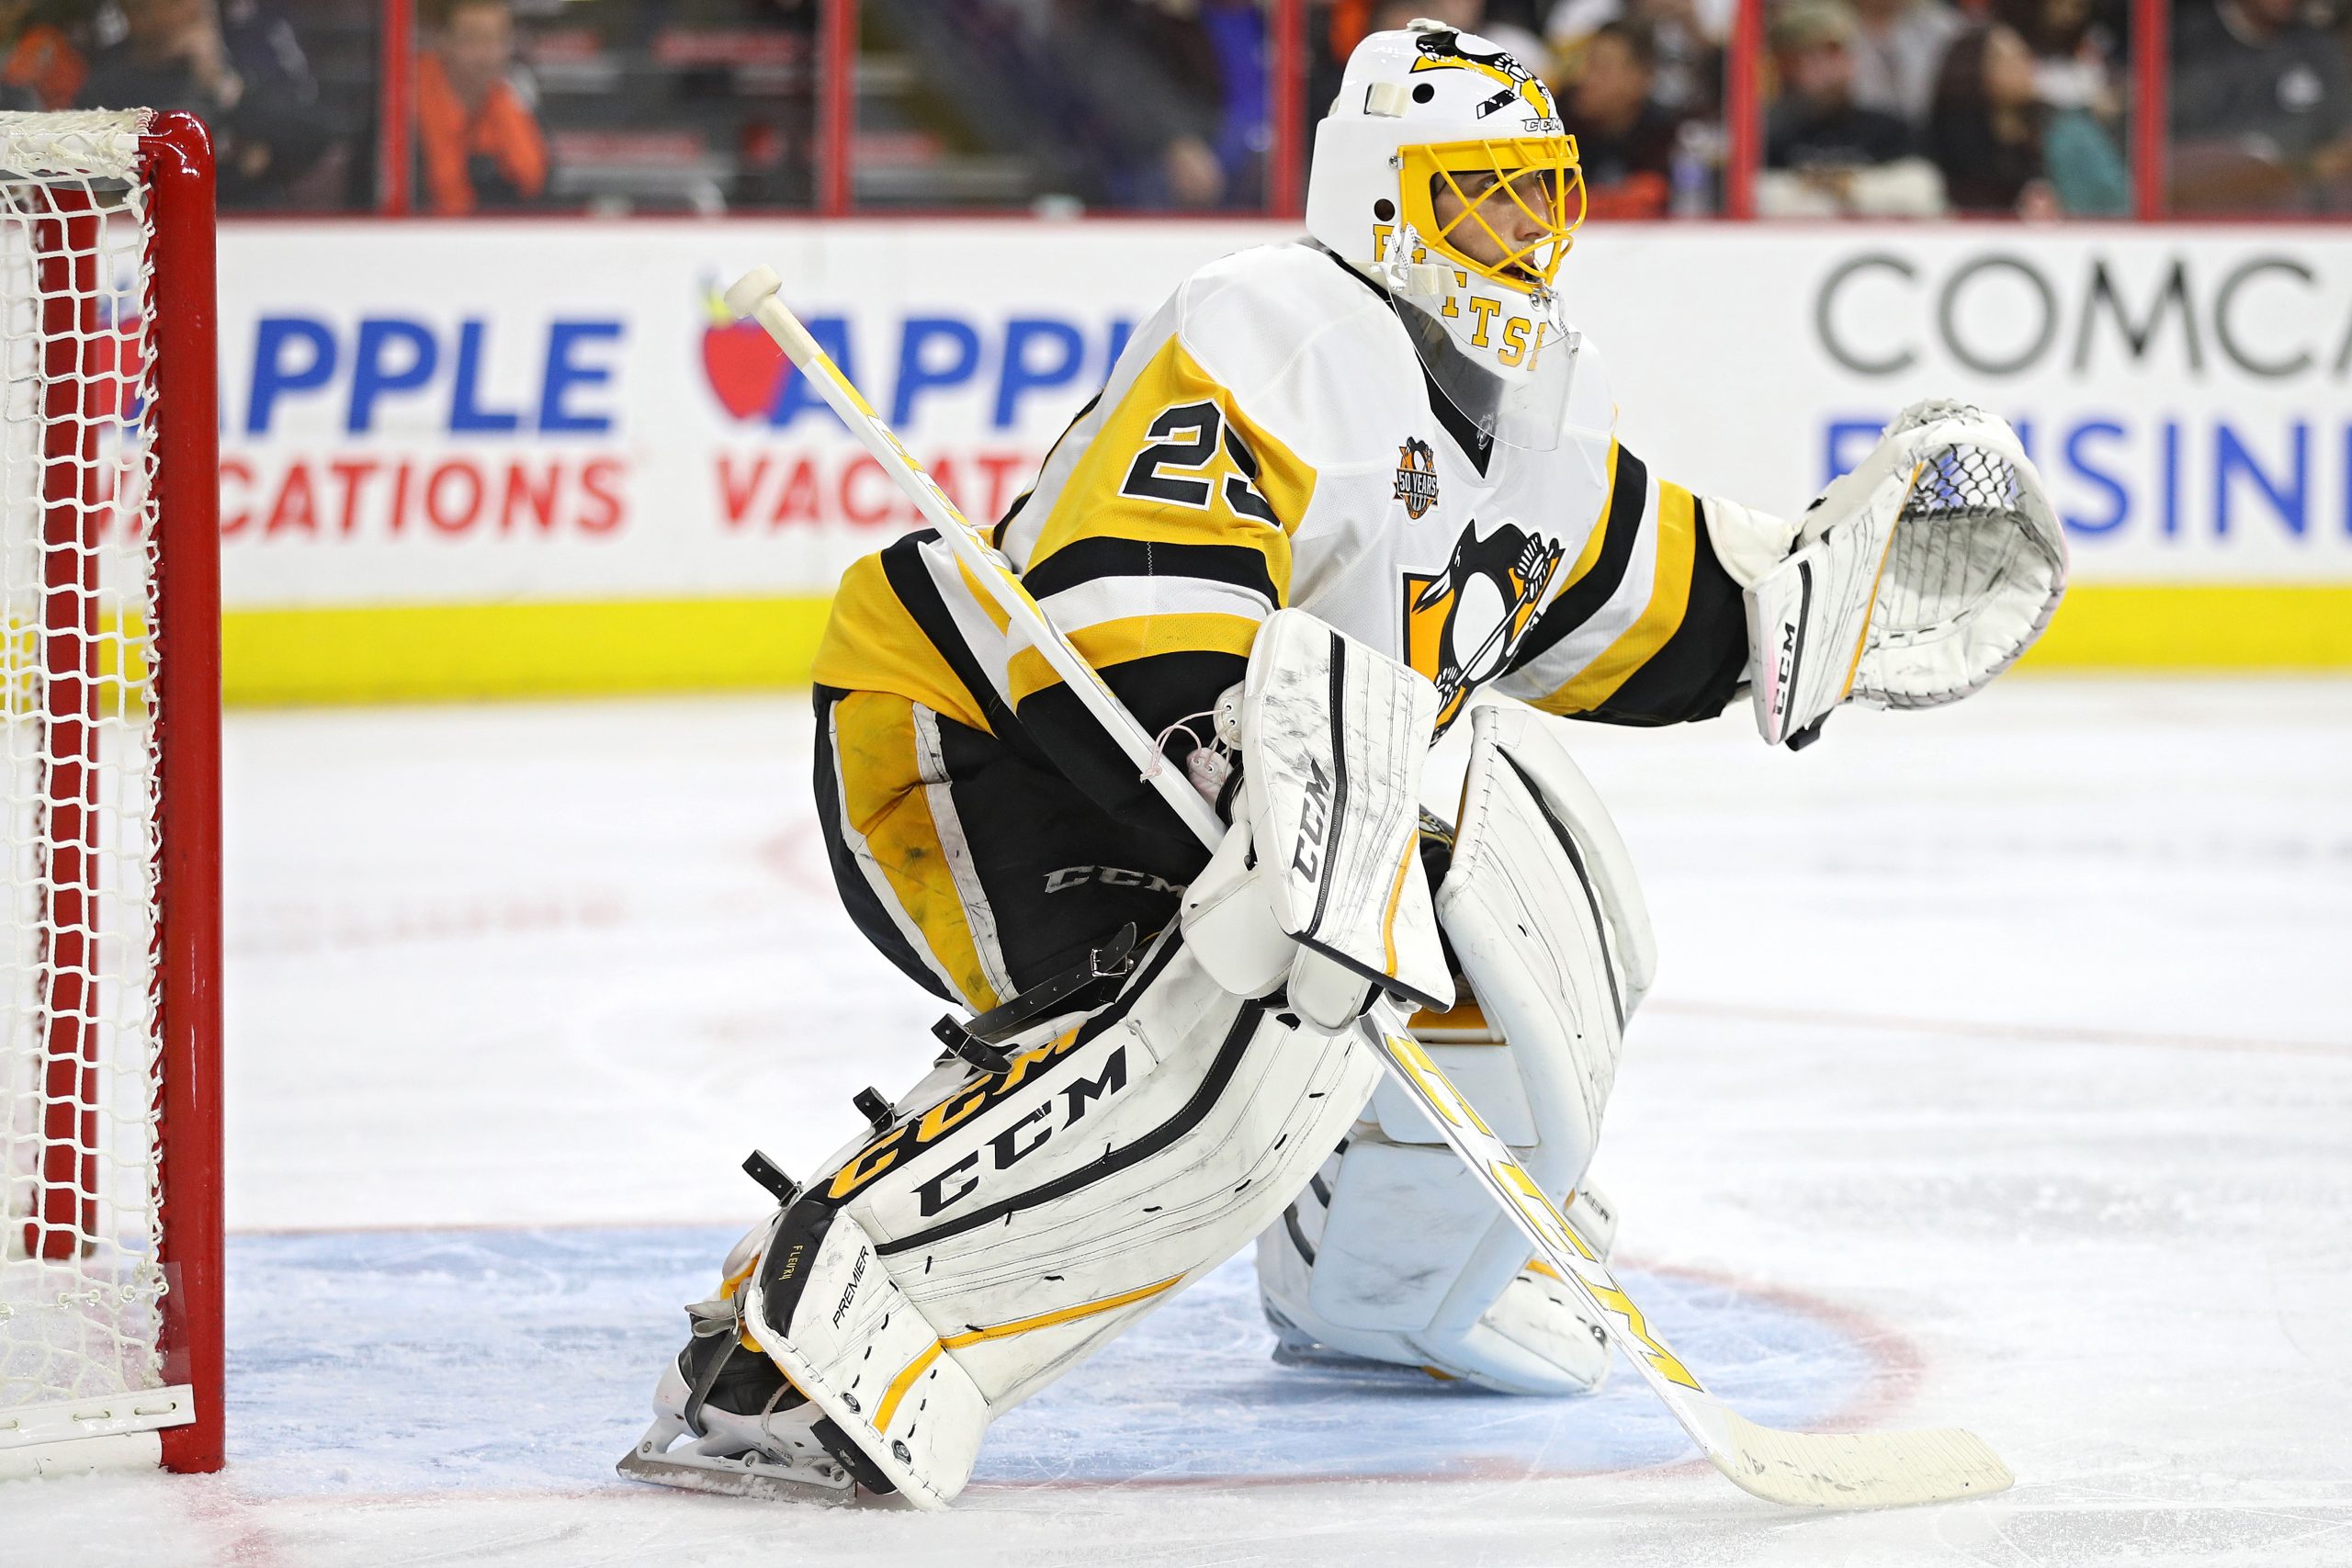
To date, I’ve tried to stay as far away from the raging goaltender debate in Pittsburgh as I possibly can.
Whether it be discussions around potential expansion draft protections or simple game-by-game debates about who should be the starter, there’s been a great deal of focus between Marc-Andre Fleury and Matt Murray as the season has progressed.
However, I have noticed a trend within these discussions that I wanted to take the chance to address in this article.
More and more, I’ve seen people on the vast expanse of the internet start to make the following suggestion:
“X goaltender gets hung out to dry more! The Penguins play differently when X is in goal.”
These types of claims piqued my interest.
At surface level, those claims struck me as excuse-making. Let’s face it, each of these goaltenders has won a Stanley Cup in Pittsburgh. There’s an emotional attachment to each of these players. For Fleury, that admiration is long-standing. For Murray, that admiration was developed during the 2015/16 Stanley Cup run. People are obviously passionate about this topic, and rightfully so.
The good news is that we have data that can help us solve for this narrative. Structurally speaking, the Penguins play the same system regardless of who is in net. But are the claims of the team tightening up in front of one goaltender and playing fast and loose in front of another goaltender true?
Let’s check the numbers and find out.
Let’s start with shots.
Obviously, Murray and Fleury haven’t played the same amount of minutes this year. For that reason, everything we’re going to look at today is broken down a rate of 60 minutes per even-strength TOI to account for the differences in ice time.
The best place to start our study is in the most basic of offensive departments: shots and shot-attempts.
For those that aren’t a fan of the “fancy-stats” and prefer to look at raw shot totals, we’ll head that direction first.
Shots Against Per 60 Minutes of Even-Strength TOI
Fleury: 32.49
Murray: 29.92
Marc-Andre Fleury does have to make a few more saves over a 60 minute time frame than Matt Murray does, but I wouldn’t exactly call this a world breaking difference, and certainly not one that lends itself to a narrative that indicates the Penguins play worse in front of Fleury than they do Murray.
Let’s expand our data set here and move on to Corsi-Against/60. This time, we’re looking at all shot-attempts. This is a better gauge of a goaltenders workload. We’re including blocked shots, shots that hit the post, deflected shots that go into the netting, etc.
Corsi-Against Per 60 Minutes of Even-Strength TOI
Fleury: 58.78
Murray: 56.59
Over the course of an hour at even-strength, Fleury faces 2.22 more shot-attempts his direction than Murray does. This data aligns with our shot based totals above. There’s not a significant enough difference here to make me believe that the team plays any different depending on who is in goal on a specific night.
Let’s move on to scoring chances.
Now that we’ve established that there isn’t a significant difference in the number of shots these goaltenders face, let’s evaluate the scoring chances allowed by the Penguins with each goaltender in net.
We’ll start with raw numbers, and then (for the purpose of the argument), we’ll move into high-danger numbers.
Scoring-Chances Against Per 60 Minutes Even-Strength TOI
Fleury: 20.44
Murray: 18.95
Over the course of an hour of even-strength ice time, Fleury faces 1.49 more scoring chances against than Murray does.
Sticking with the theme of this article, that’s not enough of a difference for us to make this narrative a reality. It’s not as if Fleury is significantly more busy in the scoring chance department and has to stand on his head all night.
But let’s get even more meta with this. What about the type of scoring chances that each goaltender faces? Let’s see how the team is doing in terms of allowing high-danger chances with each goaltender between the pipes. In this scenario, we’re going to look shot-attempts that came within/around the crease area itself.
High-Danger Corsi Against Per 60 Minutes Even-Strength TOI
Fleury: 9.96
Murray: 13.90
In this scenario, we actually have our first semi-significant difference. Matt Murray actually faces more high-danger shot-attempts against than Fleury does. Despite that fact, Murray boasts a 82.79% high-danger save percentage over Fleury’s 75.95%. Murray has been consistently better than Fleury in the high-danger areas, despite the fact that he faces more chances from that location.
Results?
I think we can look at this data and unequivocally say that the Penguins do not play any different with Fleury in net than they do with Murray in net.
I’ve read a lot of narratives across the internet that won’t be happy about this information, but if we can’t quantify it, it doesn’t exist.
In talking with Ex-Pensblog affiliate Meesh, he mentioned that the existence of this narrative might be due to the fact that Fleury tends to be more flashy than Murray is. I think that’s a great point and something to consider within the context of this discussion. Fleury, for all intents and purposes, has always relied on his athleticism. We see a little bit less of the spin-o-rama and the big glove movements from Matt Murray.
Whatever the case, the Penguins have been on an even-keel this season regardless of who has been their goaltender.
Add The Sports Daily to your Google News Feed!
