Heading into the Penguins first-round playoff series against the Columbus Blue Jackets there was one defense pairing that made every single fan and pundit around the Penguins nervous. That was the duo of Olli Maatta and Trevor Daley. Well, hindsight is 20/20 and the pairing fared pretty well in the first round. And I decided to look at the numbers behind their performance. These stats came from (their listed names are their twitter handles click the links for their respective sites): @TempoFreeHockey, @IneffectiveMath, and @404ResponseCode/@NatStatTrick. If you like any of the beautiful charts you are about to read, you should go follow them/read and support their work.
Now, let’s get down to business.
First, we will look at arbitrary and un-fancy stats. Let’s begin with goals allowed. The pairing we all held our breaths over (myself included) were both on the ice for three even strength Blue Jackets goals while Maatta was on for seven even strength Penguins goals and Daley was on for six. This makes them one and two respectively in plus/minus for defensemen on the team. Now, I’m not a huge fan of plus/minus but, some people still like to talk about it so I figured we would start there.
Next, we will talk about deployment because I had at one point thought that perhaps the Penguins were just sheltering the 3/6 pairing. This wouldn’t be unheard of and considering their spotty play plus the fact they’re both just back from injury would make sense. But I was wrong. The Penguins, according to the following shift chart, weren’t really sheltering or depending on anyone:

Edit: This chart in this tweet was actually from NaturalStatTrick. You can check out their work here.
This illustrates that while none of us would have been fussed by it, Sullivan and Martin chose not to shelter anyone or try to lean heavily on any one pairing. They just rolled their three lines. Fluctuations in ice time, shift length, and other abnormalities can be attributed to game situations. I did decide to take a look at where, in the process of the line rolling, the shifts for the pairing did begin at. I got the deployment stats from one Micah Blake McCurdy at @IneffectiveMath. I chose just to include games two and four here. You’ll see why later:
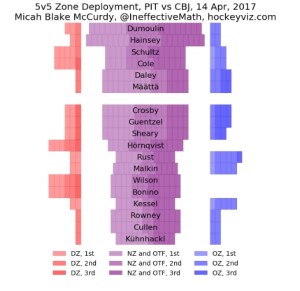
Game Two Deployment:
Game Four Deployment:
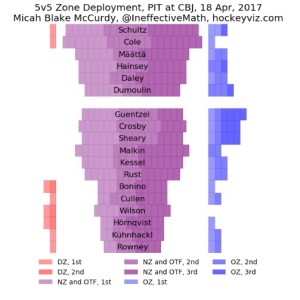
As you’ll see the bulk of the entire team’s zone deployment involved the neutral zone (which is typical). Of the 21 zone starts listed for game two, 16 of the pairing’s deployments began in the neutral zone. The only thing that may speak to any sort of sheltering would be four deployments in the offensive zone to just one in the defensive zone. Remember this is the second and third game back from injury for this pairing. However, it doesn’t seem to be a high enough number to be an intentional trend. Meanwhile, in game four, Maatta had 21 deployments with 18 of them coming in the neutral zone, three in the offensive, and none in the defensive zone. This seems weird but only Cole and Schultz had any starts in the defensive zone so it was just what the game gave them, clearly. Daley had one less deployment overall with 20. For him, 17 of his deployments began in the neutral zone, three began in the O-zone and again, none in the D-zone.
This is also important when one looks at microstats (compliments of @TempoFreeHockey). Microstats measure individual, small moments in a game to gain ideas about larger ones. For example, rebounds, turnovers, and passes. But not only do they measure these things at the base level but break them down by zone and percentage of total possesions a player had. This is why I focused on games two and four above because the microstats I’ve got are also pulled from games two and four.
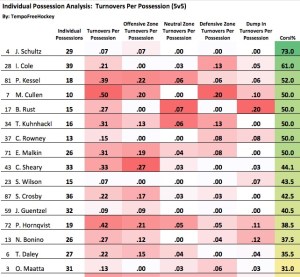
So let’s look at the microstats for this pairing starting with turnovers per possession (mostly because I have these numbers from both games two and four).
Turnovers Per Possession Game 2:
Turnovers Per Possession Game 4:
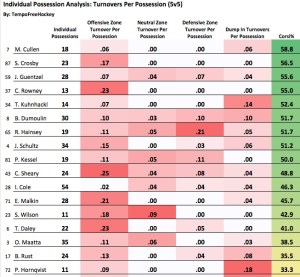
Individual possessions are where we should begin here because individual possessions are not the same as deployment or shifts. Possessions marks every single time a player has control of the puck. In the case of Olli Maatta in game two of the series, he had 31 individual possessions. Daley had 27. Maatta’s 31 was enough to give him the second highest number of individual possessions. Now, this is important because the percentage of turnovers looks worse or better based on the number of possessions as well as deployment. For example, in game two Maatta led the way offensive zone turnovers per possession in the offensive zone along with Ian Cole with zero. This, coupled with the fact he started the second highest number of his deployments in the offensive zone, means that he did what you’re supposed to do. Not turn the puck over at your offensive blueline causing an odd-man rush. On the other side of the pairing, Daley had 0 turnovers per possession in the defensive zone which is obviously a good thing. In game four, also known as the Penguins absolute worst game of the series, Maatta again was second on the team in individual possessions by a defender. In this game, however, he committed not a single defensive zone turnover. Meanwhile, both Daley and Maatta along with the rest of the team served up fresh turnovers all over the offensive zone.
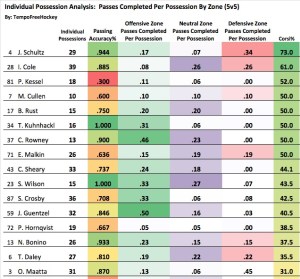
In this chart, we see how well players completed their passes in game two of the series. The big takeaway here is Schultz’s passing being absolutely brilliant but with concern to Maatta and Daley both completed over 80% of their passes with Maatta completing 85% of his successfully. The interesting note here to look at though is defensive zone completion percentage. Maatta’s numbers are second on the team for completion in this zone with 45% just behind Dumoulin whose 50% was the best in the defensive zone (his numbers got cut off when I cropped the chart, feel free to explore all the data here). Daley, on the other hand, was pretty consistent in each zone. He was able to make about 1/4 of his passes in all three zones while Maatta specifically struggled with neutral zone passing in this game.
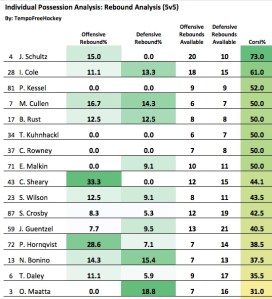
One of the big keys to being successful in the NHL in 2017 is clearing rebounds. Whether that’s through the goalie deflecting rebounds to the corner or not giving them at all it’s very important to cut down on second chances in the defensive zone and finding a way to pounce on them in the offensive zone. This chart shows the rebound data from game two. The pairing shows here why they were put together in the first place. Maatta paced the entire team in defensive rebound control meaning he was getting rebounds out of Fleury’s face quickly. On the flipside, he didn’t gather in a single offensive rebound but not to worry. Daley, his partner, was tied for second in offensive rebounds among defenders. This shows that Daley was playing the role of the jump-in player while Maatta played the defensive defenseman. In game two, it worked pretty well as the pairing was on the ice for 1 goal for, 0 against and were first and second in ice time.
In conclusion, the Maatta-Daley pairing proved to us throughout the first round that while they won’t be taking top-dog status from the other pairings anytime soon they aren’t a liability. Hell, in the clinching game Maatta actually saved a goal for Fleury in the crease. Let’s just enjoy this pairing that after try number 34532304 seems to have worked better than any of us expected in round one. Now, let’s just get more of this success moving forward and we’ll all be happy.
Add The Sports Daily to your Google News Feed!