
Back in November, the Penguins were in the midst of a poor run of form, much of which was being laid at the feet of the goaltenders and, more specifically, Matt Murray. It sparked a lot of debate and even led to speculation that the Penguins could be interested in bringing in Jimmy Howard to try to solve their woes.
Murray’s struggles before going on IR with a lower body injury were well-documented. Some of the frustration around Murray’s early season problems were justified, too.
Others were not.
In his first 11 games of this season, he posted a .877 SV%, while stopping just 75% of the high danger shots he faced. He wasn’t winning games and wasn’t making those anecdotal, unquantifiable “timely saves.”
Additionally, as was covered in this space on November 30th, the Penguins were playing far differently in front of Matt Murray than they were in front of Casey DeSmith.
To say the pressure was on Matt Murray to come back from his injury and return to Two Time Stanley Cup Winner Matt Murray form would be an understatement.
To say that Matt Murray has answered the bell in his 8 games since coming back from injury, too, would be an understatement.
Bearing all of that in mind, let’s take a look at how Matt Murray’s last 8 games compare to that of his first 11, both in the context of his individual performance as well as the team performance in front of him, just as we did in November.
Note: All stats herein courtesy of NaturalStatTrick.com and Corsica.Hockey unless otherwise noted.
First, let’s again go back and establish our baseline here based upon your standard statistics you find by just going to NHL.com, which of course factor in ice time at all strengths.
| Goaltender | Games Played (Started) | Minutes | Wins | Losses | OT Loss | GAA | SV% | Shutouts |
| Matt Murray (pre-injury) | 11 (11) | 574 | 4 | 5 | 1 | 4.08 | .877 | 1 |
| Matt Murray (post-injury) | 8 (8) | 483:16 | 8 | 0 | 0 | 1.24 | .963 | 2 |
| Matt Murray (combined 2018-19) | 19 (19) | 1058 | 12 | 5 | 1 | 2.78 | .917 | 3 |
| Matt Murray (career) | 130 (124) | 7305 | 80 | 33 | 9 | 2.61 | .917 | 9 |
What stands out here is the stark difference between Murray’s basic numbers before and after his stint on IR. In the 483 minutes and 8 games he’s played since returning, his lights out play consisting of 8 wins and a .963 SV% has brought his overall numbers for the year back right in line with his career average, as you’d expect to happen.
What you can also expect is that Murray will likely not continue to stop 96%+ of the shots that he faces, despite him having done so in 5 of his last 8 games. But even when regression does take hold, stopping ~92% of the shots he’ll face on a regular basis will still be a good day at the office.
What’s more, we’ve seen his Goals Against Average drop from a remarkably high 4.08 down to 1.24. I mentioned back in November that GAA is not a great way to evaluate goaltender performance and that has not changed in the last month and a half, but it’s worth acknowledging when we want to consider how the team is playing in front of its goaltender:
A helpful resource as to why that is comes from a 2015 article in In Goal Mag from Greg Balloch (emphasis below is my own):
Goals against average is important, there is no discrediting that. The basis of the game relies on keeping the puck out of the net, and scoring on the other one.
What’s wrong is how it is applied to individual goaltenders.
Goals against average is altered by a variety of factors, and it cannot realistically tell us anything about an individual goaltender. It is simply a team stat. Nothing more, nothing less.
Goaltenders have no control over how many shots they face. They have little control over how many penalties their teams take. They have little control over where the shots they face are coming from, or how plays develop.
To that end, let’s take a look at some of the team-based data buckets and how the team is functioning as a whole in front of Matt Murray now at 5-on-5 versus how they were performing in front of him at the start of the year.
| Goaltender | TOI | Shot Attempts Against Per Hour | Unblocked Shot Attempts Against Per Hour | Shots Against Per Hour | Scoring Chances Against Per Hour | High Danger Scoring Chances Against Per Hour | Expected Goals Against Per Hour |
| Matt Murray (Pre-injury) | 456:19 | 59.96 | 45.36 | 32.61 | 28.53 | 13.41 | 2.88 |
| Matt Murray (Post-injury) | 389:37 | 68.37 | 48.97 | 34.65 | 30.34 | 12.32 | 2.77* |
A couple of things stand out here right on the surface. First, the Penguins are actually giving up more shot attempts, unblocked shot attempts, shots on goal, and scoring chances recently than they did earlier in the season. However, some of that can be attributed to scoring effects. Now, Murray still has to deal with the situations in which the score plays a role in the Pens (lack of) possession of the puck but, by all accounts, he has done exactly that.
Consider this:
When adjusting for venue and score at 5v5 since Murray returned from injury, the Penguins allow 61.9 shot attempts per hour, 44.98 unblocked attempts per hour, 32.02 shots on goal per hour, 28.17 scoring chances against per hour, and 11.43 high danger chances against per hour. In doing so, we see that the Penguins are actually playing slightly better in most cases in front of Murray now than they did in from a puck possession standpoint. In fact, the only category in which the Penguins haven’t improved now vs. then is shot attempts against.
Note above: The expected goals against per hour stat of 2.77 post-injury factors in all 19 games Murray has played. By seeing that 0.11 xGA/60 drop, it means that the Penguins are doing a much better job at limiting teams in terms of the quality of shot Murray faces (remember: expected goals factors in shot type, location, angle, rebounds, rush shots, and game state, not the goaltender facing the shot).
This, too, will show up as we break down exactly where those shots are coming from (at 5-on-5 play):
| Goaltender | Shots Against Per Hour | High Danger Shots Against Per Hour | Medium Danger Shots Against Per Hour | Low Danger Shots Against Per Hour | Rust Attempts Against Per Hour | Rebound Attempts Against Per Hour | Average Shot Distance |
| Matt Murray (Pre-injury) | 32.61 | 10.52 | 7.63 | 13.15 | 1.75 | 3.16 | 34.98 |
| Matt Murray (post-injury) | 34.65 | 8.93 | 8.62 | 15.09 | 3.23 | 4.00 | 36.28 |
While Murray has faced 2.04 more shots per 60 minutes of ice time since returning from injury, we can see that uptick in shots is not coming from the high danger area. Put another way: the Penguins are keeping teams from getting to the slot and low slot.
That is, unequivocally, a vast improvement.
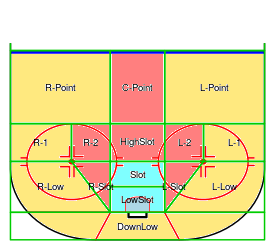
In fact, that uptick can be attributed almost entirely to the Penguins allowing teams to shoot from low danger areas of the ice. Murray has been seeing nearly 2 more shots against per 60 minutes of ice time from low danger areas, where he has allowed 0 goals since returning and just 1 on the season, while seeing 1.59 fewer high danger shots against and 1.09 fewer high danger scoring chances against per hour of ice time. If the Penguins want their starting goalie to continue this sort of success at 5v5, this is a trend they’d be well-advised to continue.
Finally, we again want to take a look at Murray’s save percentages on those shots that he faces at 5v5.
Note: Goals Saved Above Average is the measurement of goals saved versus the league average. So if you were to put an arbitrary league average goalie X in goal to face the same shots, how many goals would he save compared to actual performance of his tangible counterpart. Also, note that expected save percentage, much like expected goals, factors in shot quality (among other items). The expected save percentage post-injury reflected below factors in his first 11 games and his last 8.
| Goaltender | Save Percentage | Expected Save Percentage* | High Danger Save Percentage | High Danger Goals Saved Above Average (HD GSAA Per Hour) | Medium Danger Save Percentage | Medium Danger Goals Saved Above Average (MD GSAA Per Hour) | Low Danger Save Percentage | Low Danger Goals Saved Above Average (LD GSAA Per Hour) |
| Matt Murray (Pre-injury) | .895 | .912 | .750 | -3.69 (-0.49) | .914 | 0.62 (0.08) | .990 | 1.85 (0.24) |
| Matt Murray (post-injury) | .960 | .918* | .914 | 1.19 (0.18) | .929 | 0.17 (0.03) | 1.000 | 0.60 (0.09) |
Obviously, the big thing that stands out here is Murray’s impressive jump from 0.895 to 0.960 in his overall 5v5 save percentage, mirroring that of his overall save percentage at all strengths. As you’d also surmise, because the Penguins are doing a much better job in terms of limiting quality shots against their goaltender, Murray’s “combined” expected save percentage has found its way up from 0.912 to 0.918.
There are a few factors that go into why these jumps have been seen, but perhaps nothing has been more influential to Murray’s return to form than his propensity for stopping the high danger shots that he’s facing. Jumping from .750 to .914 is, in a word, insane.
This is especially noticeable when you consider that his medium danger and low danger save percentages have improved, but only marginally compared to that of his high danger save percentage.
Up to and including his first 11 games of the season, Murray’s career HDSV% was 0.852. With his outlandish 0.914 lately, he’s seen his combined season HDSV% move back up near his career average (0.819) from that abysmal 0.750 at the beginning of the season. It also means that he’s saving 1.19 high danger goals above league average now compared to the -3.69 through his first 11 games. That sort of improvement shouldn’t be taken lightly.
And, when you think of “making a timely save,” that is probably what you’re thinking about.
https://gfycat.com/essentialgentlebluebottlejellyfish
https://twitter.com/G_Off817/status/1063228801558224896
Since returning, too, Murray has found his total Goals Saved Above Average come in at 2.28, meaning he is outperforming your arbitrary, league average goaltender. Compare that to his -3.94 in his first 11 games and you can see that Murray has been a totally different beast since coming back.
So, where does that leave us?
Well, here’s what I ended with in that post from November:
Clearly, this season at 5v5, the difference between Matt Murray and his peers has been his ability to stop the puck coming in from the high danger area. That context cannot and should not be ignored.
What this all tells us is that if the Penguins are able to shore up their play in front of Murray when he returns from his lower body injury and limit the amount of high danger shots and chances they give up while he’s in the crease, there’s a very good chance of him regaining the form we were accustomed to seeing his first two seasons in this league.
And with the way the Penguins have been playing defensively as of late, there’s no reason to suspect that they won’t continue that when Matt Murray returns.
That still holds true. The Penguins have given Murray more support since he’s come back from injury by limiting the quality and danger of shots and chances they’ve allowed against him and, with Murray coming back with what seems like a new lease on life, the results have been exactly what we’d have hoped for: regaining the form we were accustomed to seeing his first two seasons in this league. We can see the culmination of all of this in the data.
Regression will happen. It always does. But there’s no reason to believe anything other than Matt Murray is back.
Add The Sports Daily to your Google News Feed!