Monday evening, on the 2nd anniversary of Mike Johnston’s firing and the hiring of 47-year old Michael Barry Sullivan, we looked at the traits that made Sullivan the most suitable coach for the Penguins over the past two years.
Today, we’ll look at numbers from Sullivan’s time in Pittsburgh, but first, here are two still-frames of Sullivan’s office at PPG Paints Arena originally shown during an In the Room episode from 2016-17, that illustrate a lot about Sullivan’s philosophy in a few brief words.

If you can’t read the writing on the framed picture on his wall, it’s a quote from legendary NFL coach Vince Lombardi: “Perfection is not attainable, but if we chase perfection, we can achieve excellence.” I shared these with Pensblog Rich back in the summer and he replied that “Sullivan studies or is friends with Bill Belichick. I am certain of this.”
Given the winning pedigree and Massachusetts connection, I don’t disagree.

Accountability: A personal choice to demonstrate the ownership necessary for achieving exceptional results.
To the left of that definition, there is a triangle that says, “OWN IT” at the top. Then in descending order: “Play for TEAM, know your SKILLS, own your HABITS, own your ATTITUDE“. Despite the team’s mixed on-ice results so far this season, no one can say that Sullivan hasn’t set up a framework of accountability for the team.
* * *
So we’ve looked at Sullivan qualitatively. However, what do the numbers say about his brief time in Pittsburgh? What statistics can we even use to evaluate a head coach’s effect on his team? One of the godfathers of advanced stats, Rob Vollman, tried answering this question as early as 2009. His initial definition of a good head coach is one who “consistently improves his team”. To measure this, he took a team’s previous season’s points percentage and regressed it 35% toward the league-wide mean points percentage to calculate a team’s expected points for the current season. (Regression of 35% represents the historic average).
Therefore, actual points earned in the current season minus expected points equals points above (or below) expectation. It is this quantity – points above expectation – that represents a head coach’s contribution at improving his team in Vollman’s model.
I looked at data from the last two seasons and created two tables below showing the Top 10 NHL head coaches in 2015-16 and 2016-17 ranked by points above expectations per 82 games.
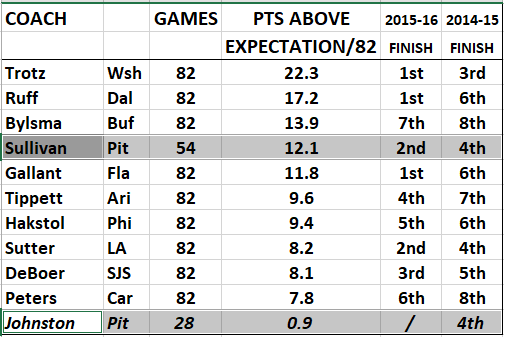

Through one-third of 2015-16, the Penguins were essentially playing at no better than expectation level under Johnston. With Sullivanat the helm, he added 8 points above expectation in 54 games coached. Projected over an 82-game schedule, Sullivan’s 12.1 points above expectation ranked him fourth among all NHL head coaches that season.
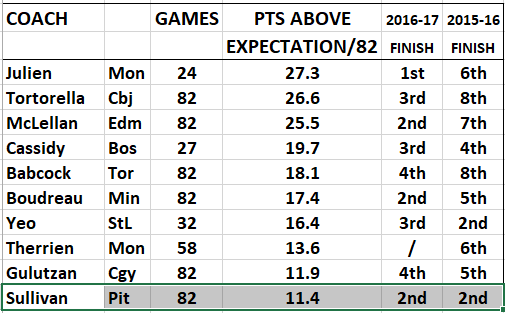
Some teams that were absolutely wretched in 2015-16 made big leaps forward in 2016-17 (e.g. Edmonton, Toronto). Like the debate over whether the Jack Adams Award is truly an individual coaching award or rather, a “most improved team” award, one can always debate how much of the Oilers’ success was due to Todd McLellan’s coaching or Connor McDavid’s return to full health.
As for Sullivan, his points above expectation per 82 games ranked 10th in the NHL. That may not seem impressive, but consider: Sullivan found a way to motivate a championship team that could have naturally drifted into complacency. He refused to let fatigue and injuries be excuses, then guided the Pens to second place overall and the first back-to-back Cup win in nearly two decades. Credit should go to Sullivan’s leadership and not solely the immensely talented group of players. Note also that Sullivan is the only name on both tables.
* * *
- Consistency: While Sullivan’s tenure began with four regulation losses in a row, the Penguins would not lose two consecutive games in regulation for the remainder of the 2015-16 season, including playoffs, an astounding total of 74 straight games
- Of 366 all-time NHL head coaches, only 18 have won multiple Stanley Cups. Sullivan is one of three men who won two titles in his first two seasons with his team. The others: Pete Green (1920-21 Ottawa) and the legendary Toe Blake (1956-57 Montreal)
- The Penguins’ next win under Sullivan, who has coached 168 regular season games behind the Pittsburgh bench, will be his 100th regular season victory. In the shootout era, Dan Bylsma was the fastest to 100, hitting the century mark in game number 163.
- Bylsma is the franchise leader in playoff games coached and won. However, Sullivan’s playoff winning percentage (.653) is better than any other Penguins coach except Hall of Famers Scotty Bowman and Bob Johnson
| Play | Play | Play | Play | |||
|---|---|---|---|---|---|---|
| Coach | From | To | G | W | L | W-L% ▼ |
| Scotty Bowman | 1992 | 1993 | 33 | 23 | 10 | .697 |
| Bob Johnson | 1991 | 1991 | 24 | 16 | 8 | .667 |
| Gene Ubriaco | 1989 | 1990 | 11 | 7 | 4 | .636 |
| Mike Sullivan | 2016 | 2019 | 61 | 38 | 23 | .623 |
| Michel Therrien | 2006 | 2009 | 25 | 15 | 10 | .600 |
| Marc Boileau | 1974 | 1976 | 9 | 5 | 4 | .556 |
| Dan Bylsma | 2009 | 2014 | 78 | 43 | 35 | .551 |
| Herb Brooks | 2000 | 2000 | 11 | 6 | 5 | .545 |
| Ivan Hlinka | 2001 | 2002 | 18 | 9 | 9 | .500 |
| Eddie Johnston | 1981 | 1997 | 46 | 22 | 24 | .478 |
| Red Kelly | 1970 | 1973 | 14 | 6 | 8 | .429 |
| Kevin Constantine | 1998 | 2000 | 19 | 8 | 11 | .421 |
| Johnny Wilson | 1978 | 1980 | 12 | 4 | 8 | .333 |
| Ken Schinkel | 1973 | 1977 | 6 | 2 | 4 | .333 |
| Mike Johnston | 2015 | 2016 | 5 | 1 | 4 | .200 |
| Craig Patrick | 1990 | 1997 | 5 | 1 | 4 | .200 |
| Ed Olczyk | 2004 | 2006 | ||||
| Rick Kehoe | 2002 | 2003 | ||||
| Pierre Creamer | 1988 | 1988 | ||||
| Bob Berry | 1985 | 1987 | ||||
| Lou Angotti | 1984 | 1984 | ||||
| Red Sullivan | 1968 | 1969 |
Add The Sports Daily to your Google News Feed!