With Grapefruit and Cactus League games officially underway, everyone in baseball gets that coveted clean slate. The 2017 season presents endless opportunities for players and teams, no matter how good or how bad 2016 was to them.
Some are taking the field with the hopes of completely changing the narrative surrounding them, while others simply want to continue showing the progress they displayed just a few months ago is indeed the new normal.
The MLB regular season is a grind — as if 162 games in about 180 days doesn’t say that enough — and quick starts don’t always mean certain performances are sustainable over the long haul. The same also goes for poor starts, too.
The five starting pitchers below each saw their respective 2016 campaigns start on the wrong foot, but that didn’t stop them from having a strong finish in the second half.
Now, they’ll each try to use that momentum to produce from start-to-finish this season.
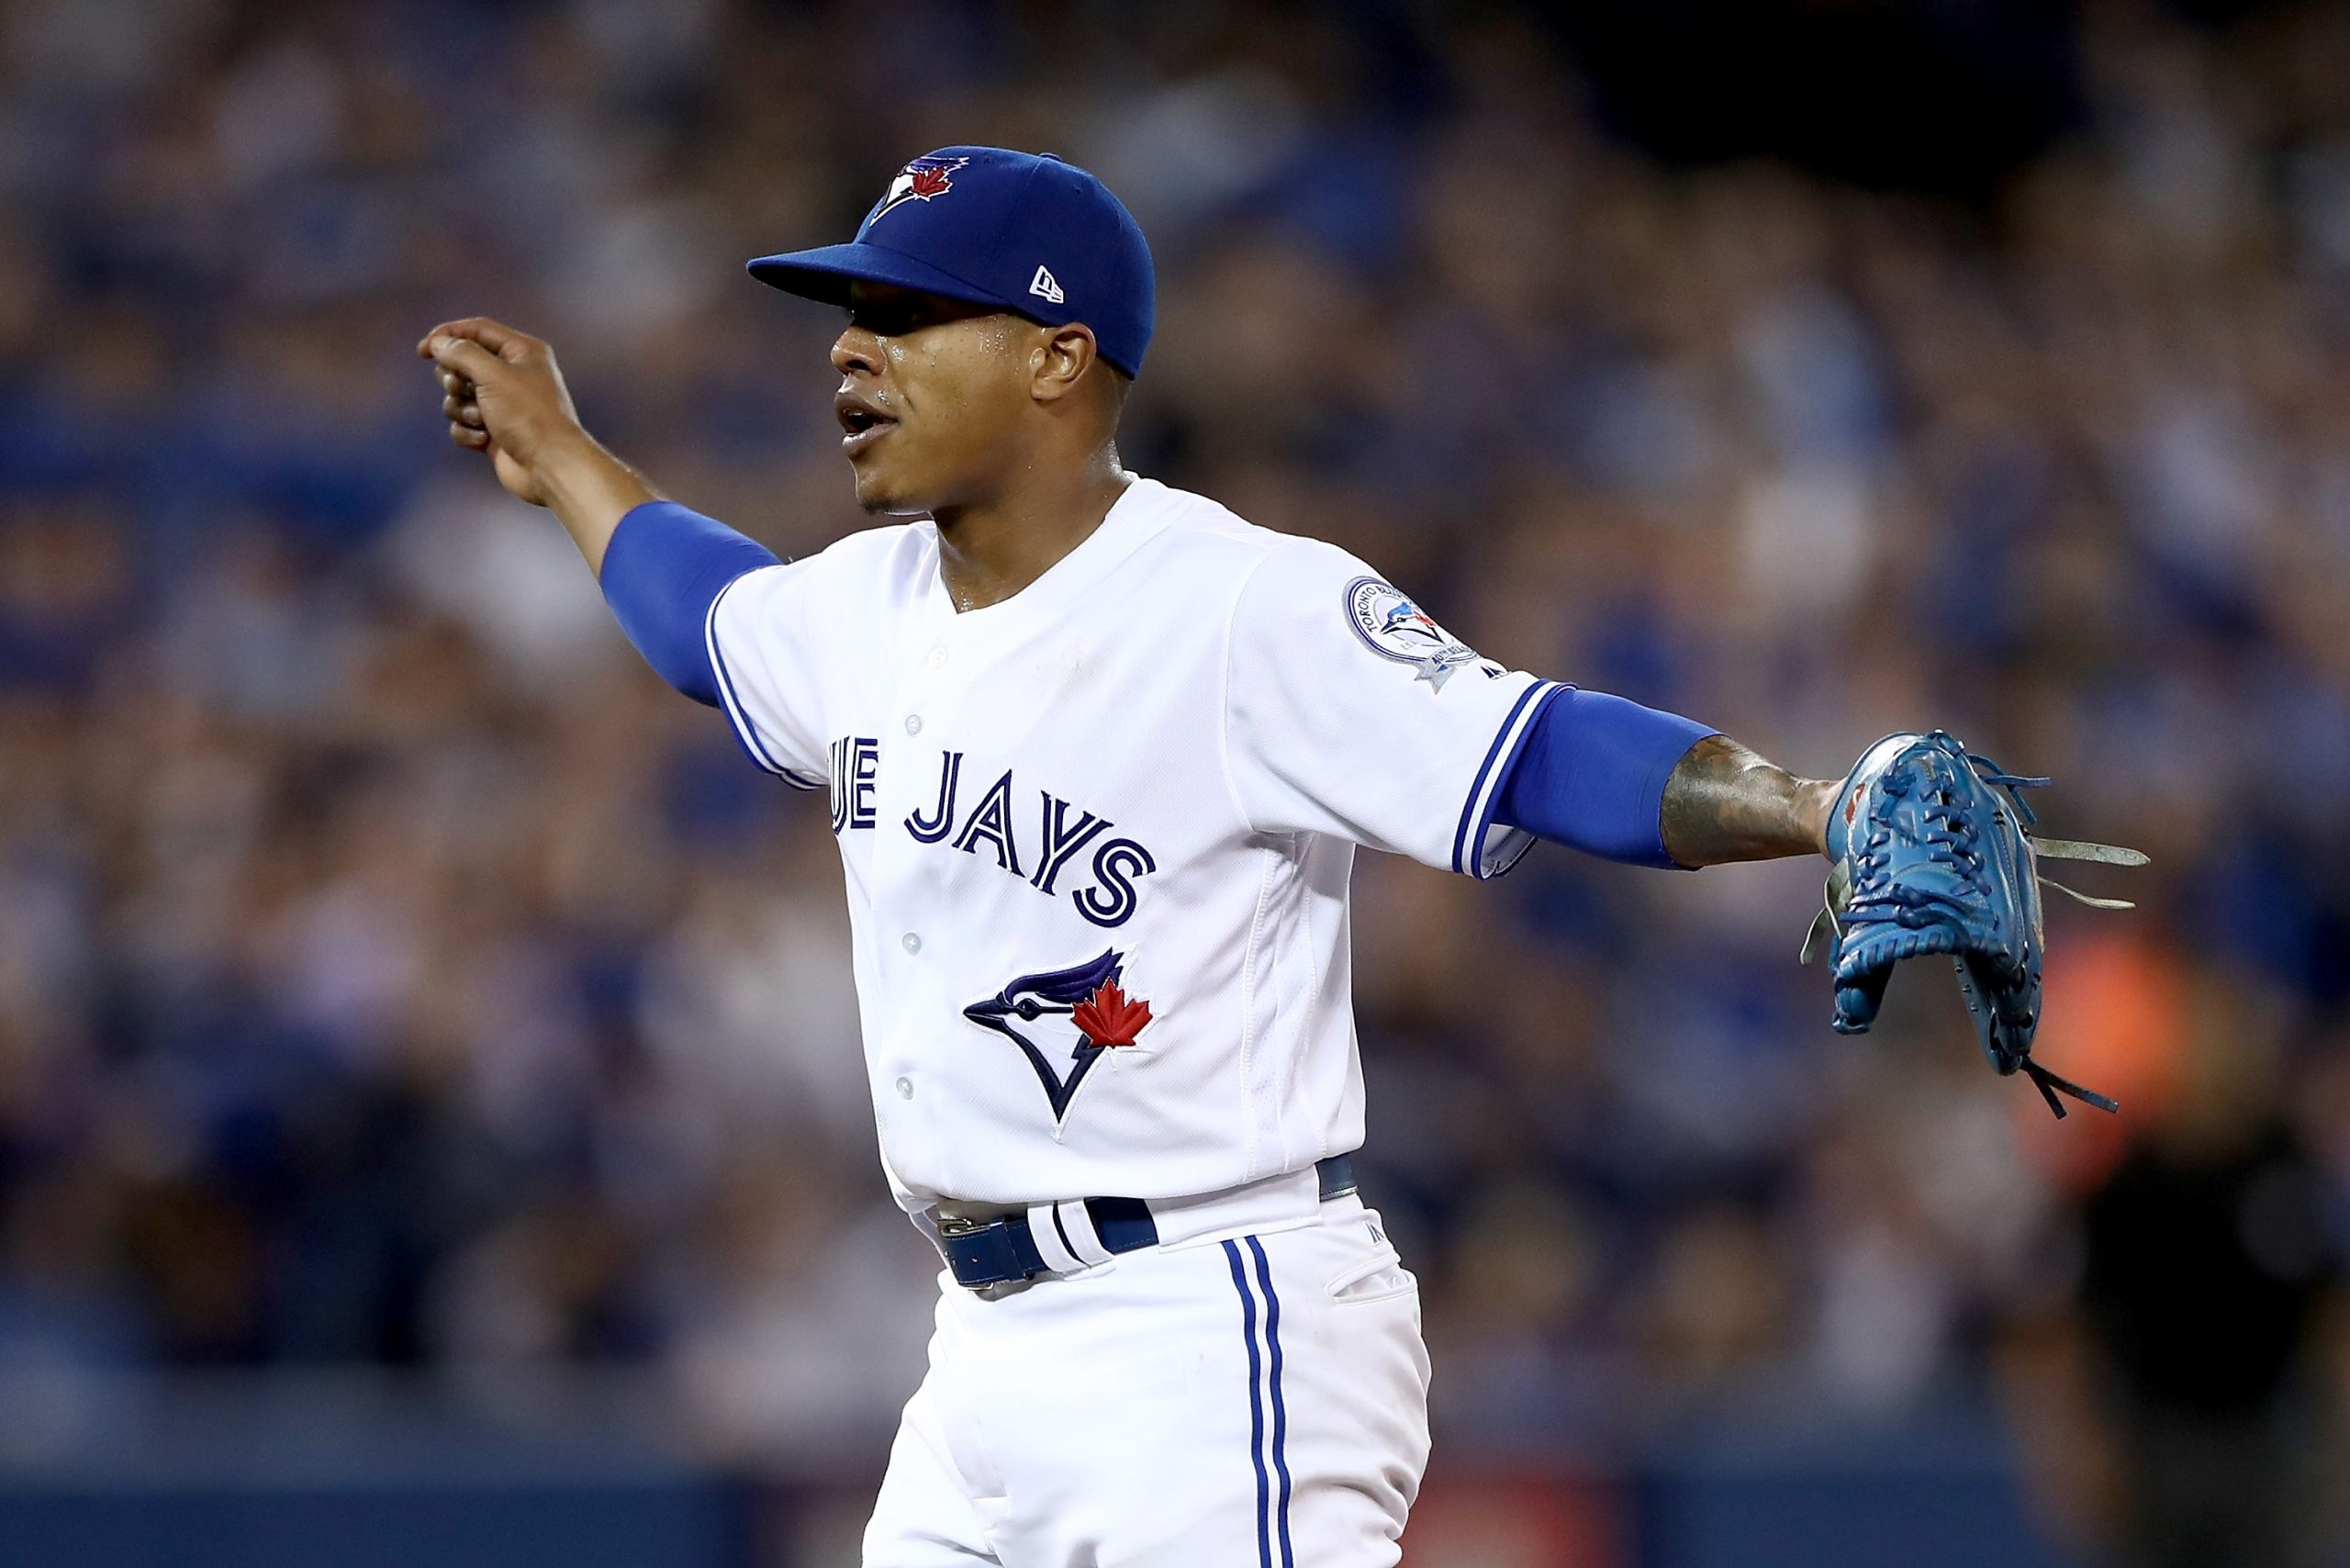
Marcus Stroman, Toronto Blue Jays
| 2016 | IP | Record | ERA | FIP | WHIP | K/9 | BB/9 | wOBA |
|---|---|---|---|---|---|---|---|---|
| First Half | 116.0 | 7-4 | 4.89 | 3.88 | 1.33 | 6.44 | 2.56 | .321 |
| Second Half | 88.0 | 2-6 | 3.68 | 3.49 | 1.24 | 8.49 | 2.15 | .300 |
After letting David Price walk via free agency last winter, it seemed as if the Blue Jays were giving Marcus Stroman the opportunity to be their staff ace. However, his numbers didn’t look like those of an ace at the All-Star break, while Aaron Sanchez and J.A. Happ were busy picking up the slack.
His FIP shows a fair amount of bad luck that did correct itself following the midsummer classic, though, including an increase in swing rate, a dip in contact rate and a spike in K/9. That increase in strikeouts was aided by a rise in swinging-strike rate (8.5% in first half to 10.5% in second half), which could be credited to better pitch selection.
| 2016 | Fastball | Slider | Cutter | Curveball | Changeup |
|---|---|---|---|---|---|
| First 20 starts | 59.2% | 14.1% | 9.8% | 10.10% | 6.9% |
| Final 12 starts | 54.8% | 15.8% | 16.7% | 10.1% | 2.7% |
It shouldn’t be surprising that his infield-fly rate also jumped from 2.4% to 11.1% while seeing better overall success despite no significant change in hard-hit rate (31.8% in first half vs. 31.7% in second half).
Sean Manaea, Oakland Athletics
| 2016 | IP | Record | ERA | FIP | WHIP | K/9 | BB/9 | wOBA |
|---|---|---|---|---|---|---|---|---|
| First Half | 67.0 | 3-5 | 5.24 | 4.43 | 1.39 | 7.39 | 2.69 | .338 |
| Second Half | 77.2 | 4-4 | 2.67 | 3.78 | 1.02 | 8.00 | 1.97 | .275 |
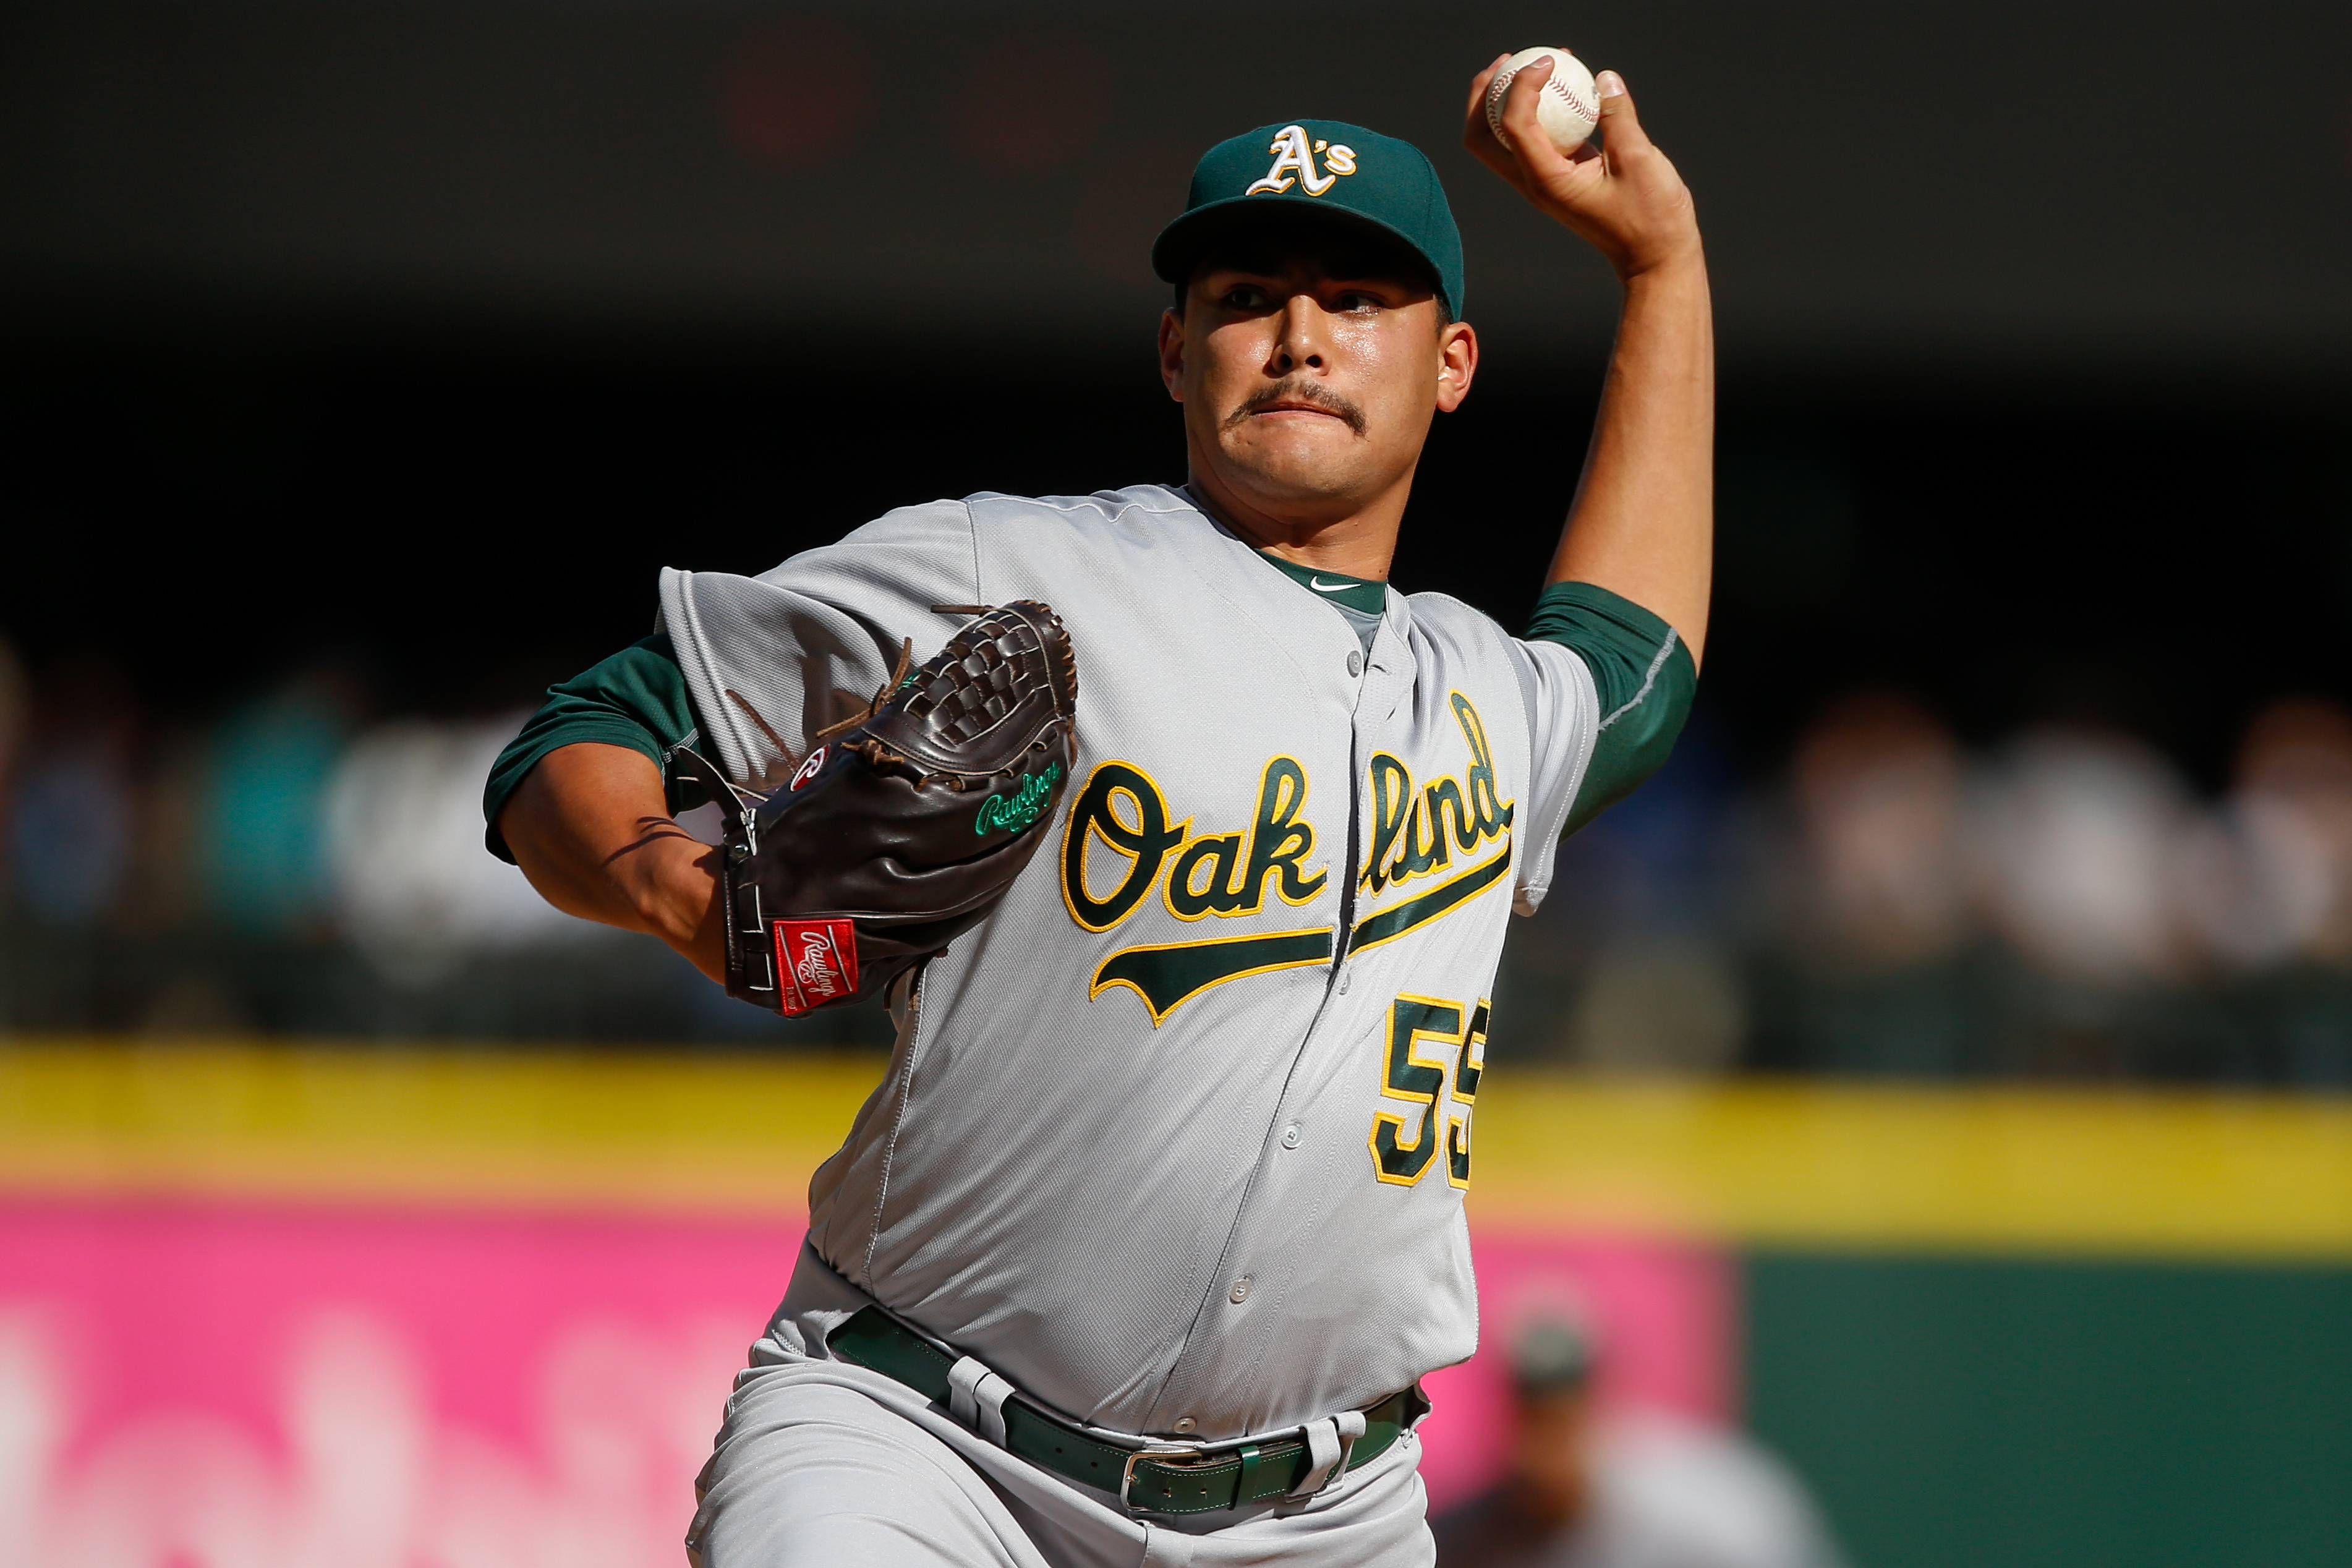
Sean Manaea‘s MLB career got off to a rocky start, but he showed the Oakland Athletics a ton by settling down and posting very respectable numbers by the time Game 162 was in the books.
His struggles mostly happened in the month of May, where he posted a 1-3 record with an unsightly 7.00 ERA and 1.56 WHIP in just 27 innings. As a three-pitch hurler (fastball, slider, changeup) with a fastball that sits in the low-90s (92.3 mph average fastball velocity in ’16), it’s important to have his secondary pitches working.
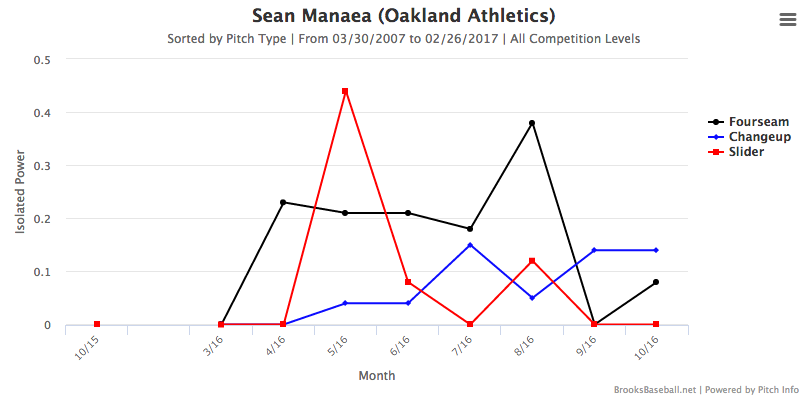
And when he was first called up, they weren’t. Here’s a look at the Isolated Power (ISO) against each of his three pitches on a monthly basis, provided by Brooks Baseball.
While he didn’t throw his slider all that often in May (6.45%), those who got one made the most of it by posting a .438 ISO. After that, opposing hitters couldn’t muster much against the pitch, as the graph displays.
Ivan Nova, Pittsburgh Pirates
| 2016 | IP | Record | ERA | FIP | WHIP | K/9 | BB/9 | wOBA |
|---|---|---|---|---|---|---|---|---|
| First Half | 80.0 | 6-5 | 5.18 | 4.85 | 1.35 | 6.86 | 1.91 | .348 |
| Second Half | 82.0 | 6-3 | 3.18 | 3.39 | 1.16 | 7.24 | 1.21 | .312 |
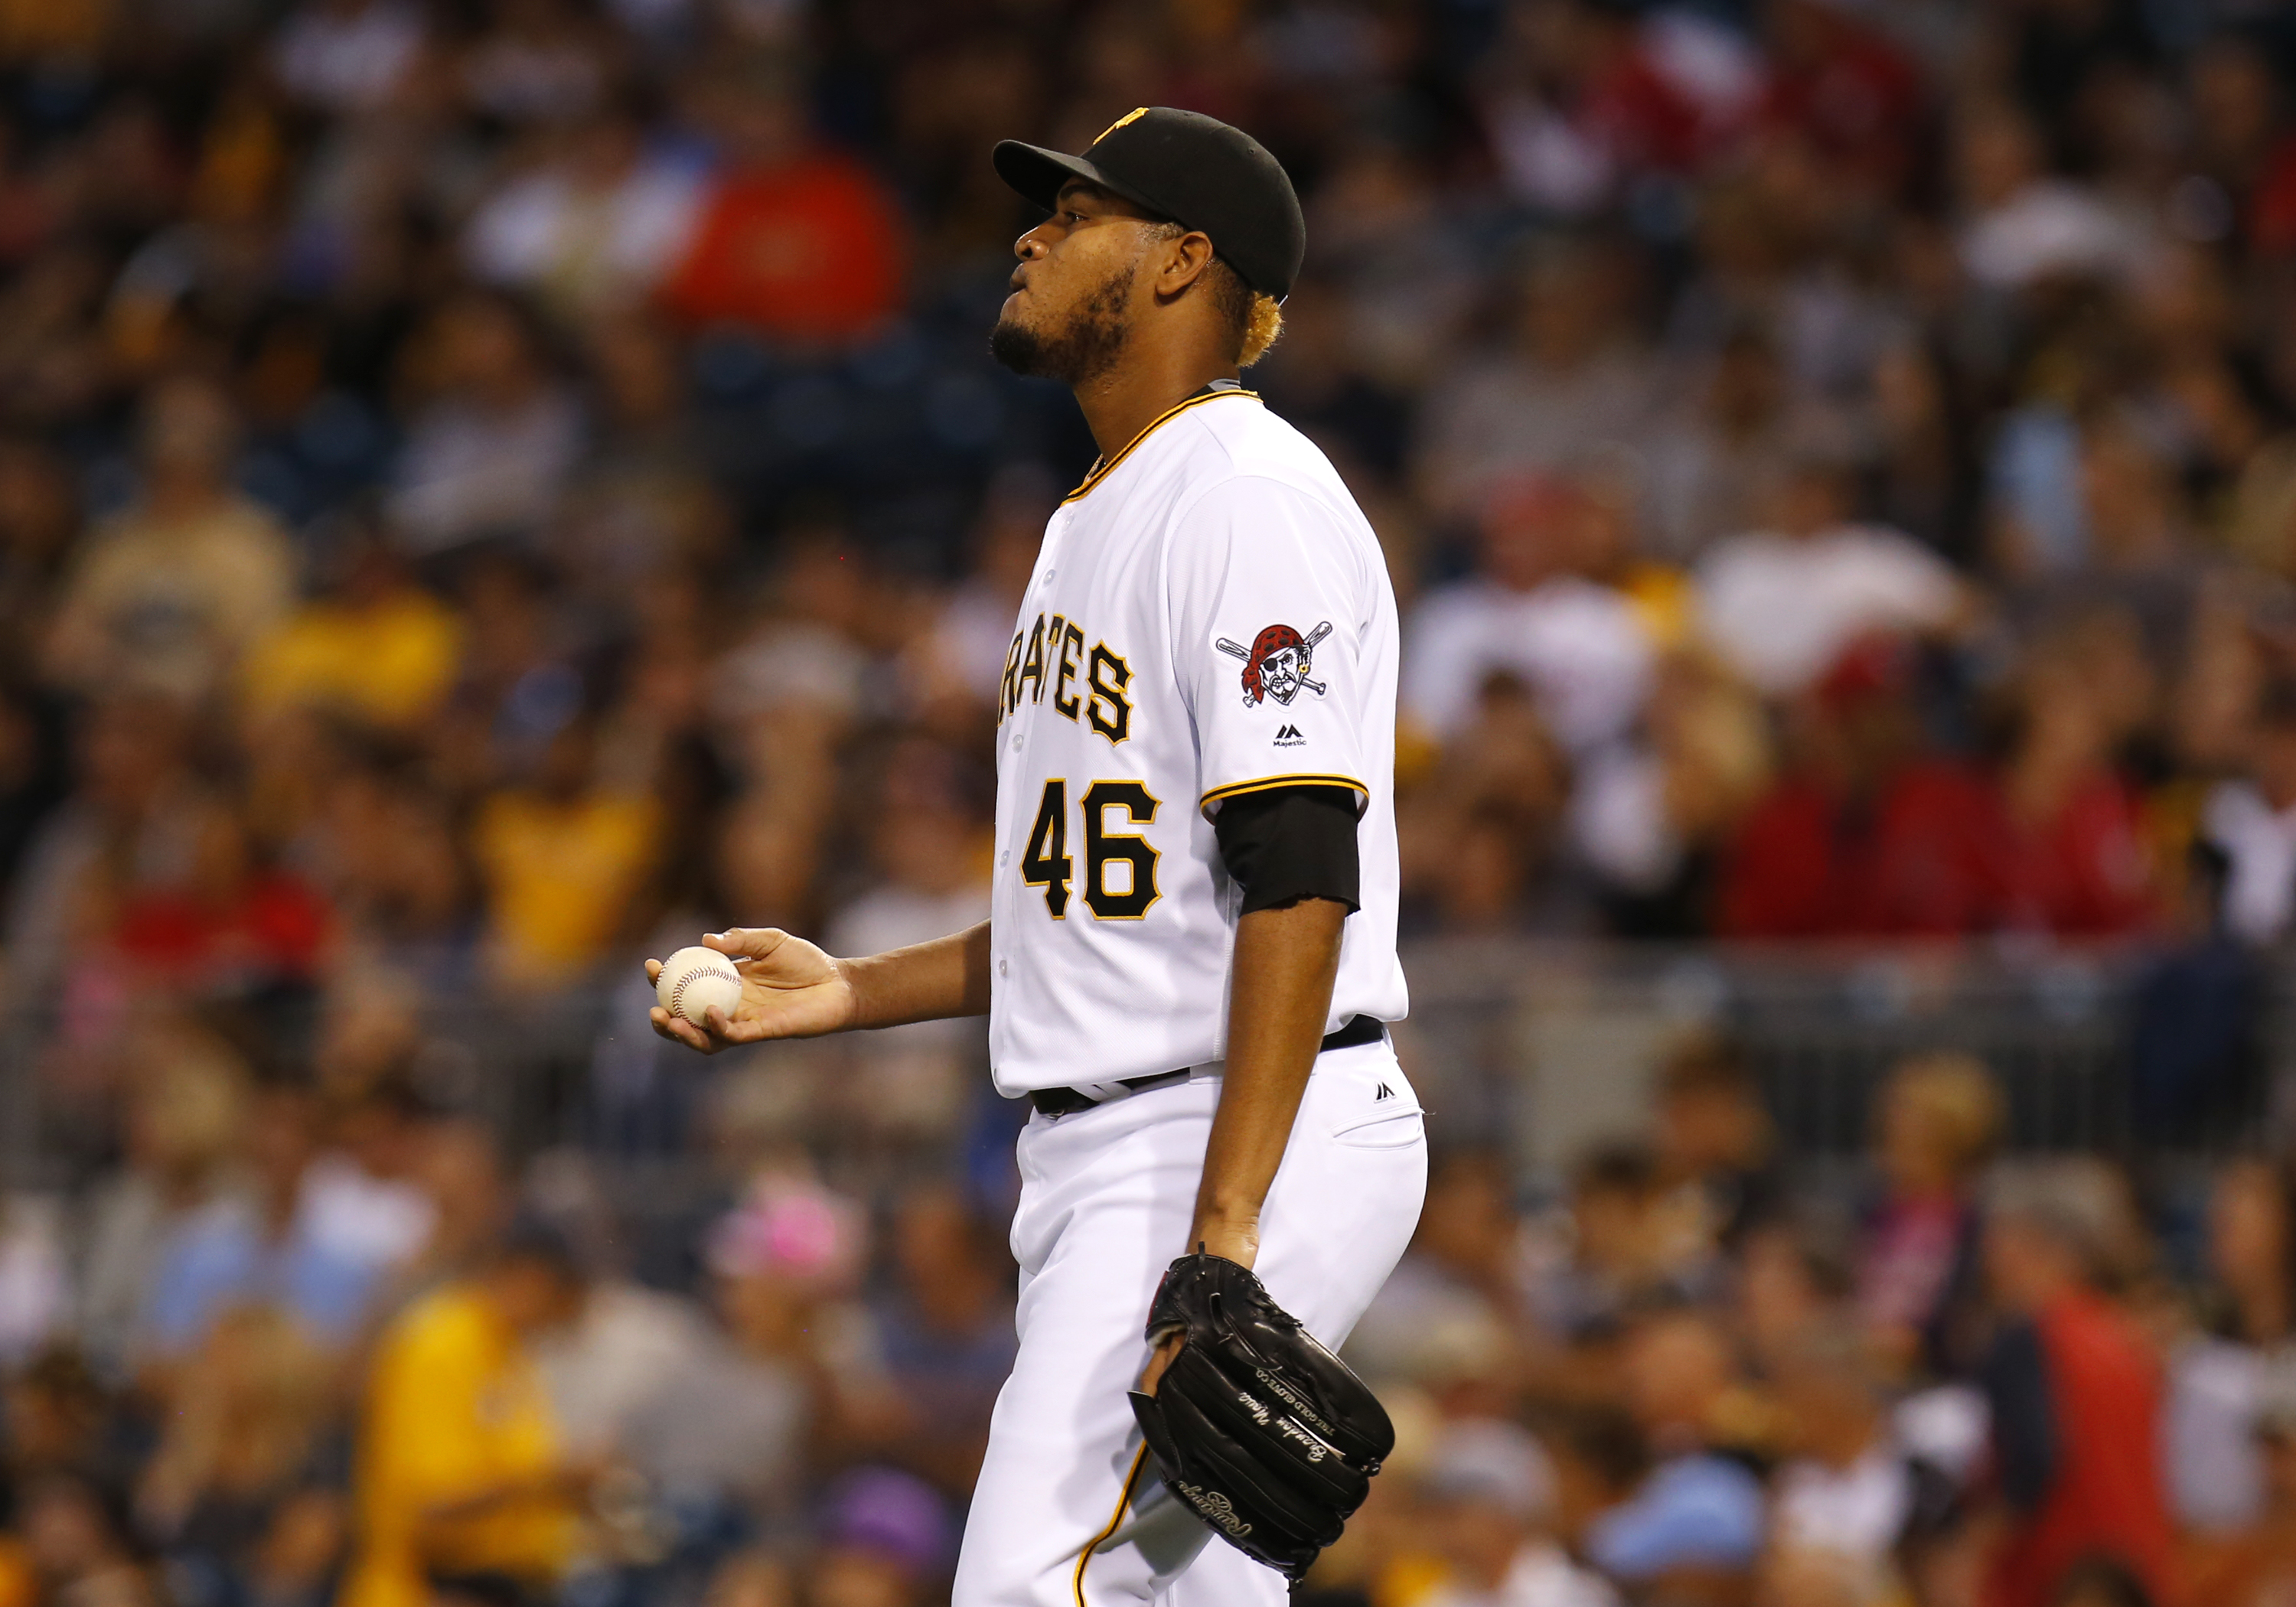
While the stats we’re highlighting for Ivan Nova are pre- and post-All-Star break, it’s also worthwhile to separate his production between the New York Yankees and the Pittsburgh Pirates, which can be seen below.
| 2016 | IP | Record | ERA | FIP | WHIP | K/9 | BB/9 |
|---|---|---|---|---|---|---|---|
| NYY | 97.1 | 7-6 | 4.90 | 5.10 | 1.36 | 6.9 | 2.3 |
| PIT | 64.2 | 5-2 | 3.06 | 2.62 | 1.10 | 7.2 | 0.4 |
Although he probably would’ve liked a bigger payday, Nova returning to Pittsburgh on a three-year, $26 million deal is huge considering the about-face he made after getting traded. The biggest question, however, will be whether or not this improved control is sustainable.
After all, he had never posted a BB/9 less than 2.8 prior to 2016, which was pre-Tommy John in 2013.
He did abandon his cutter (4.1% before trade, 0.8% after) in favor of his curveball (+3.1% after trade) and changeup (+4.5% after trade), which could’ve been partly why he induced swings on 50.8% of offerings with the Pirates. Had he done that over an entire season, it would’ve been a career high.
Kevin Gausman, Baltimore Orioles
| 2016 | IP | Record | ERA | FIP | WHIP | K/9 | BB/9 | wOBA |
|---|---|---|---|---|---|---|---|---|
| First Half | 86.2 | 1-6 | 4.15 | 4.27 | 1.30 | 8.52 | 1.97 | .330 |
| Second Half | 93.0 | 8-6 | 3.10 | 3.95 | 1.26 | 8.90 | 2.71 | .308 |
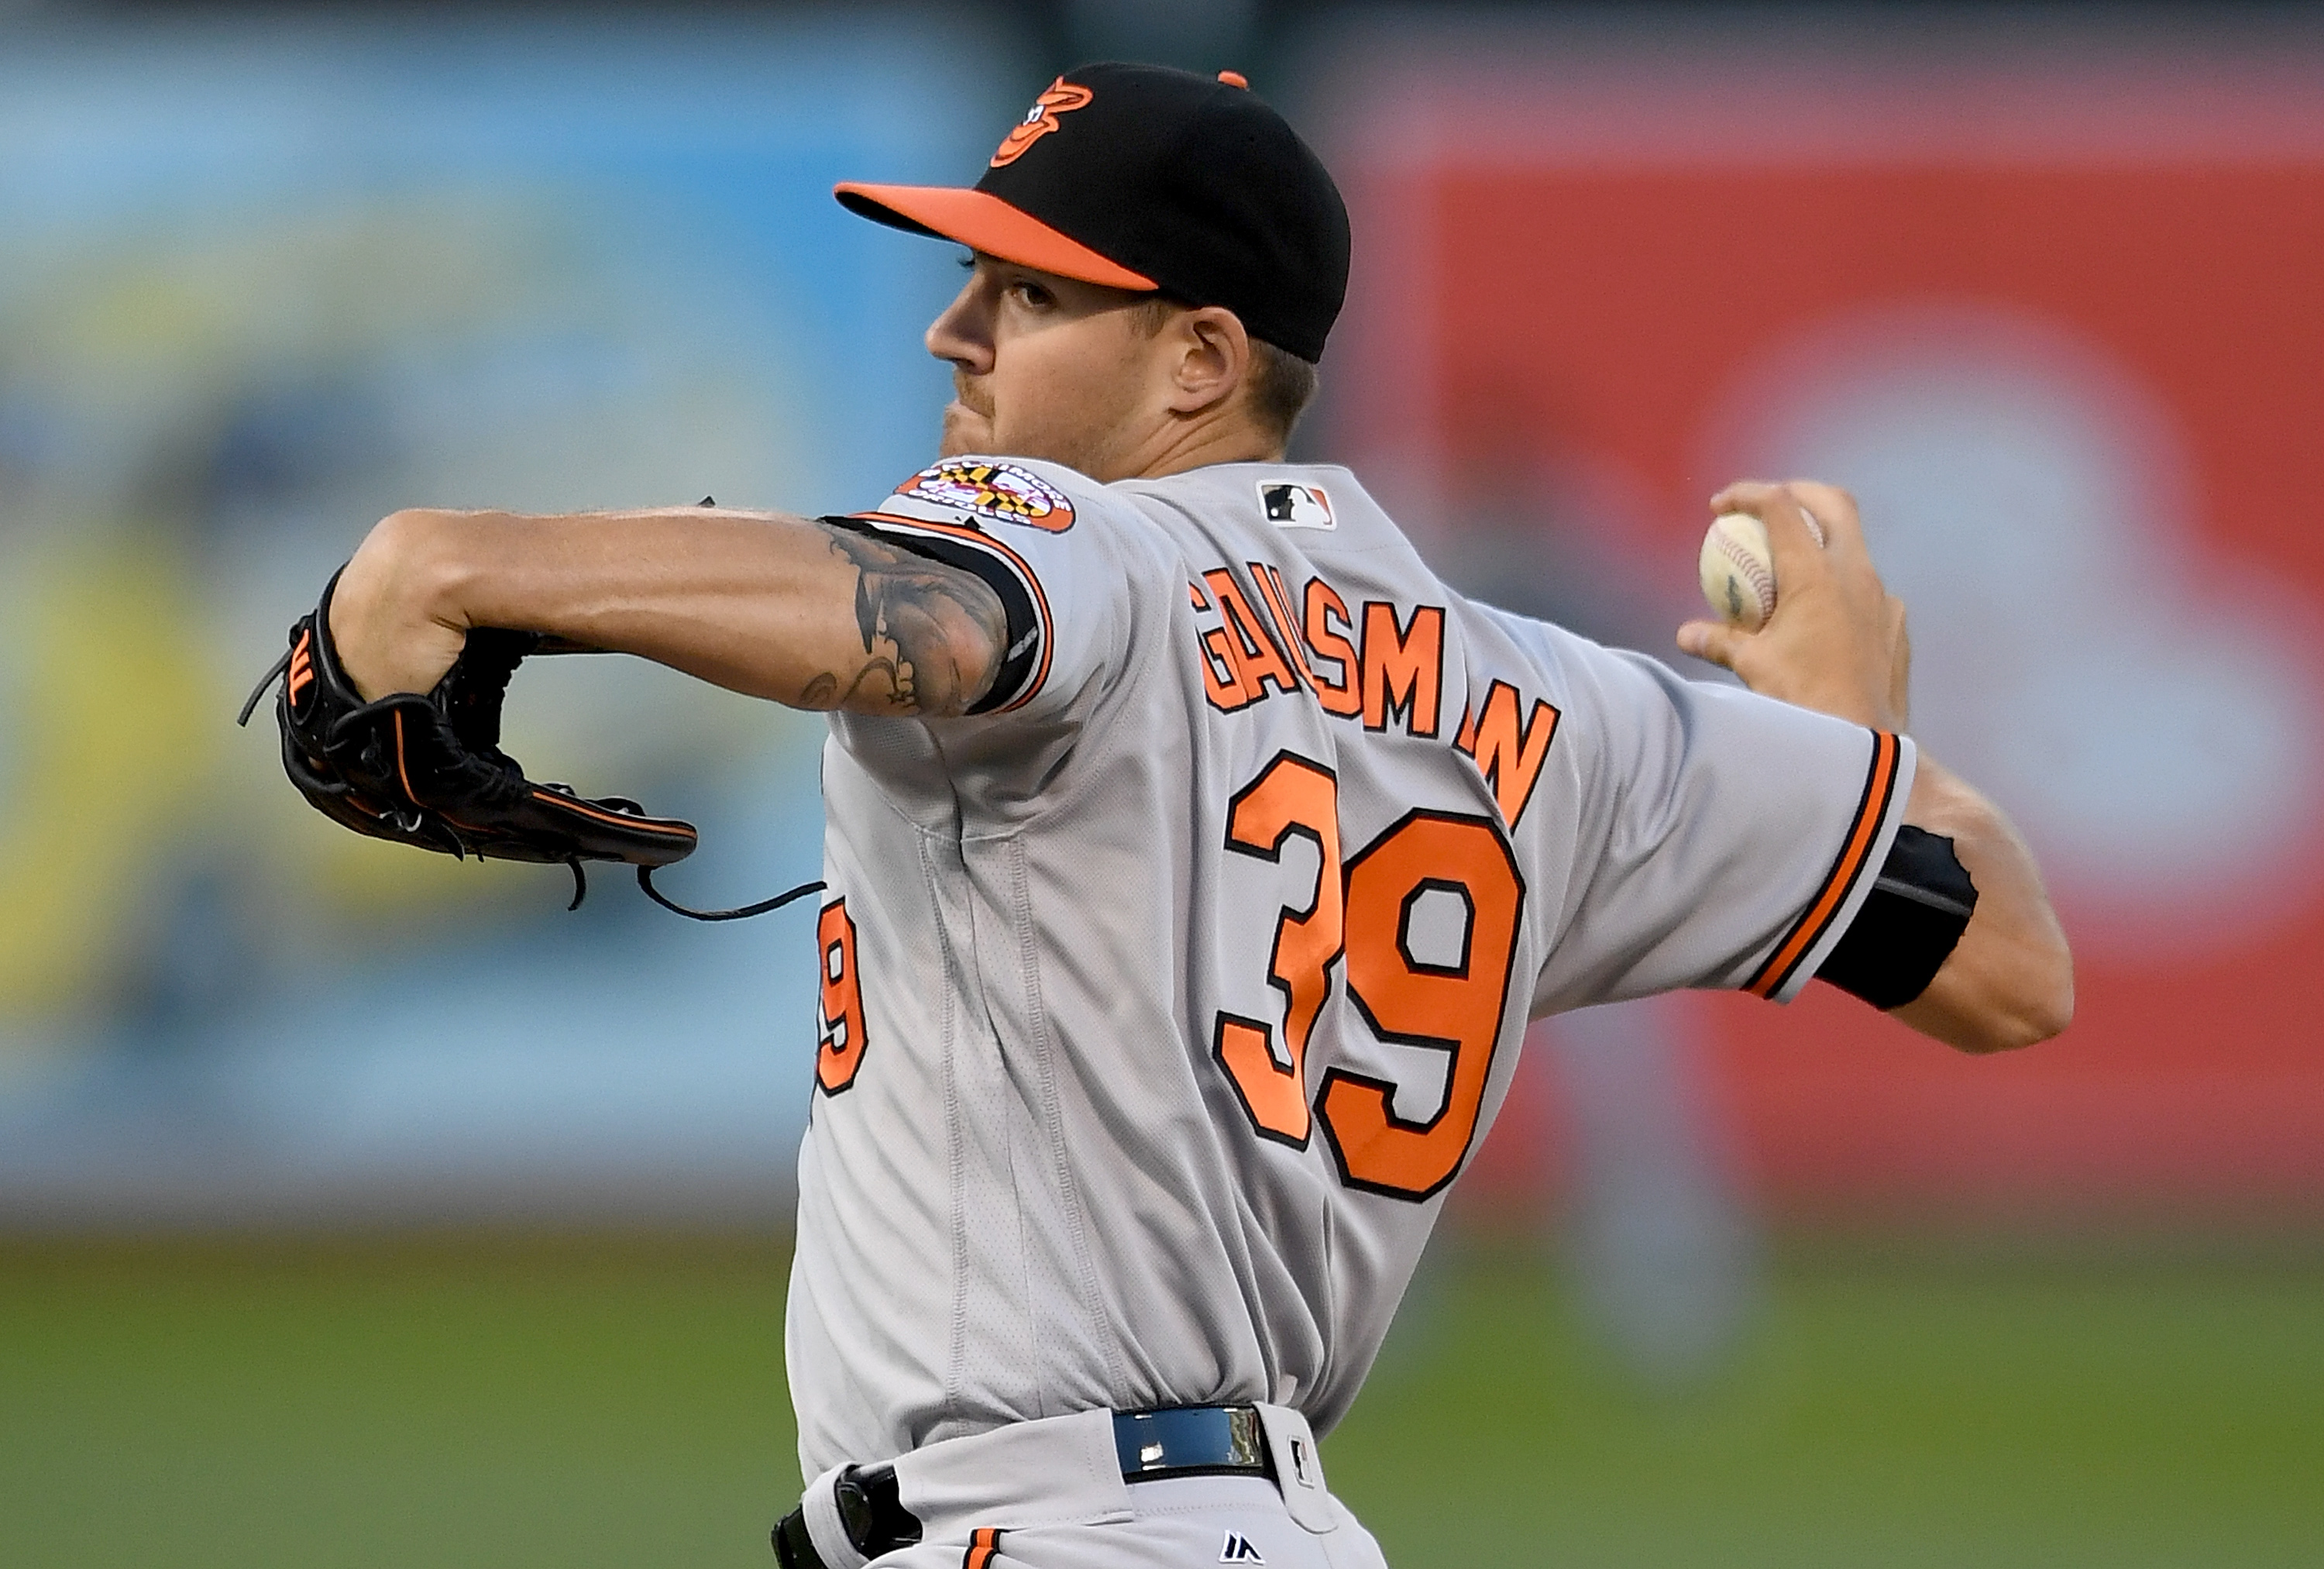
With Chris Tillman on the shelf and unavailable for Opening Day, it appears Kevin Gausman is the favorite to take the ball for Baltimore. He still needs to show he’s worthy of the honor, but he can thank a strong second half for getting him to this point.
Could there have been some luck on his side, though? It’s possible when looking at some of his peripheral stats — his FIP didn’t drop as significantly as his ERA did from the first half to the second half, and a rise in his BB/9 during that period isn’t the best thing in the world.
He also benefited from having more success in the Left on Base (LOB%) department than in recent years. Prior to 2016, he never stranded more than 72.8% of runners in a single big league season, but that shot up to 81.2% last year, including 84.3% in the second half. We’ll find out this year whether that was an anomaly or the start of a new trend.
Dan Straily, Miami Marlins
| 2016 | IP | Record | ERA | FIP | WHIP | K/9 | BB/9 | wOBA |
|---|---|---|---|---|---|---|---|---|
| First Half | 101.1 | 4-6 | 4.35 | 4.75 | 1.22 | 7.11 | 4.00 | .302 |
| Second Half | 90.0 | 10-2 | 3.10 | 5.02 | 1.14 | 8.20 | 2.80 | .313 |
Dan Straily is unique because he’s the only hurler of the five highlighted here to experience more success after the All-Star break despite not seeing positive regression in FIP or wOBA. He actually got worse in both categories.
While he did lead the league in homers allowed (31) last season, it didn’t burn him as much as you’d think — especially since his home games were spent at Great American Ballpark, one of the best places to crank one out of the yard.
He also stranded runners at a higher rate than normal, but took it to another level by stranding 93% in the second half, compared to 72.5% in the first half. To put this in perspective, Jon Lester led all qualified pitchers last season at 84.9%.
That’s probably not sustainable, but he’s taking his fly-ball pitching tendencies (48.0% in ’16, 46.8% in his career) to pitcher-friendly Marlins Park, which was one of the toughest places to hit a homer last season.
Then again, maybe he’s just ahead of the curve.
Which one of these starting pitchers do you think has the best chance at sustaining their second-half success from last season in 2017?
Statistics courtesy of Baseball-Reference. Advanced statistics courtesy of FanGraphs, unless otherwise noted.
Thanks for reading! If you’d like to jumpstart your sportswriting career and aren’t sure how, check out my eBook. Don’t forget to follow me on Twitter so we can chat about baseball: @mmusico8.
About Matt Musico
Matt Musico currently manages Chin Music Baseball, contributes to The Sports Daily and is also an editor for numberFire. In the past, he has also worked for FanDuel and Bleacher Report. He’s a lover of all baseball, especially the Mets.
Add The Sports Daily to your Google News Feed!
