The Pittsburgh Pirates acquired reliever Kyle Crick this offseason for Andrew McCutchen, and he’s had a solid year in terms of ERA and RA9. However, there are some differences in estimators.
Kyle Crick this season has posted a 2.36 ERA or the Pirates in 47.7 innings. He’s locked down the eighth inning for the Pirates, posting a 2.63 ERA in 27.3 innings, and along with Felipe Vazquez he has helped the club post a 52-1 record when leading after seven innings.
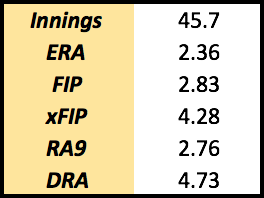
But ERA (or RA9) isn’t the best judgment of a true pitchers talent, the goal is to figure out what a pitcher’s ERA (RA9) is and try to get the true talent level. Below are different run estimators of Crick, and there’s some differences:
FIP
Fielding independent pitching, or FIP, is the most commonly used run estimator. It is based on the assumption that pitchers have zero control on batted balls that the defense can play. By ignoring the defense, the assumption is that the batted balls in play will be at a league average rate over a period of time.
The formula is simple, (13*HR+3*(BB+HBP)-2*K)/IP+FIP constant, with the constant changing year-to-year to match the run scoring environment. It’s on the ERA scale, making the comparison simple, Crick’s ERA should really be around 2.83.
The main benefit for Crick here is the allowance of only one home run in 45.7 innings. Add in the above average strikeout rate, and FIP shows that Crick has been really good.
The one downfall is the assumption that all in balls in play will be average and that all quality of contact is the same. A pitcher with a lot of soft contact and groundballs will likely be better than a pitcher with a lot of hard contact and flyballs going forward, assuming the three numbers in the formula are the same.
FIP is best used to describe what should have happened over what will happen, but it’s an easy calculation on describing how a pitchers balls in play have compared to a league and what to expect going forward.
xFIP
Expected Fielding Independent Pitching, xFIP, is another ERA estimator, that like FIP is used to estimate what should have happened. It ignores defense, and instead of actual home runs, it uses the league average home run per flyball rate.
The formula for xFIP is, (13*(FB * lg HR/FB%)+3*(BB+HBP)-2*K)/IP+FIP Constant, where FB is flyballs and the FIP constant changes year-to-year for the changes in run scoring environment. Based on the formula, Crick should have a 4.28 ERA, assuming that he will regress to a league average home run per fly ball rate.
But xFIP relies 1). on the assumption that pitchers have no control on their balls in play, 2). no control on the quality of contact, and 3). that all pitchers will regress to a league average home run rate. Stringer data is also needed for xFIP (for the fly balls), and there is some bias in that to begin with.
xFIP is based on one year worth of data, and is in no form better to use over a projection on how a pitcher will pitch going forward. It’s not a projection (forecasting) system.
Like FIP, assuming that the pitcher has zero control on the balls in play and their results isn’t an accurate description.
DRA
Deserved Run Average, DRA, is Baseball Prospectus’ RA9 estimator. It is more reliable and predictive as FIP, along with having the same descriptive power as the same season ERA (FIP) and RA9 (DRA).
DRA uses a mixed model to estimate the pitcher’s true talent level, controlling for park, opponent, and others. It’s more complicated than FIP, but being more reliable and predictive (next season’s ERA/RA9) makes it a better measurement.
Crick’s estimated that he should allow 4.73 runs per nine, 1.97 more runs per nine than his RA9. So what has caused the big difference? Here’s a breakdown of the components, where negative is good and all are counting statistics:
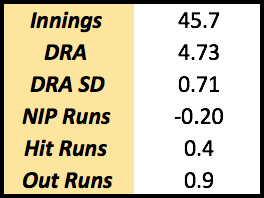
Not in play, NIP, runs is modeled off the strikeouts, walks, hit batsman. Crick has saved -0.2 runs in not allowing the ball in play. That stems from his above average strikeout (25.4 percent) and swinging strike rate (11.1 percent). And this comes with a below average walk rate, but the model has Crick saving runs because of his ability to get strikeouts.
Hit runs measures the amount of damaging hits, mainly coming in the form of extra base hits. Baseball Prospectus defines hit runs as,
“Hit Runs is the sum of the pitcher’s run value in giving up home runs, triples, doubles, infield singles, and outfield singles, with each of those being separately modeled.”
This ties into out runs, or getting the typical ball in play outs. Both of these favor soft contact inducing groundball pitchers. Crick is not a groundball inducing pitcher, having a below average groundball rate (37.2 percent). Crick is modeled to have below average ability to keep the ball away from the fence.
***
These are three different ERA (RA9) estimators, presenting different degrees on how far off Crick has been. Ranking them, they (likely) go in order of DRA, FIP, and xFIP as the latter two assume the pitcher has no ability to control contact and balls in play.
In terms of going forward this season, Crick is a projected 4.15 ERA by STEAMER, 3.81 by ZiPS, and 4.15 by PECOTA. Crick’s having a good season, striking out batters at an above average rate and lowing his walk rate.
By FIP, Crick is about where he should be, but he has only allowed one home run despite not being a groundball pitcher. By DRA, Crick should be worse based on the modeling for the run values on the hits he allows and the pitcher’s contributions to get outs at each position.
*Numbers from Fangraphs and Baseball Prospectus0
Add The Sports Daily to your Google News Feed!