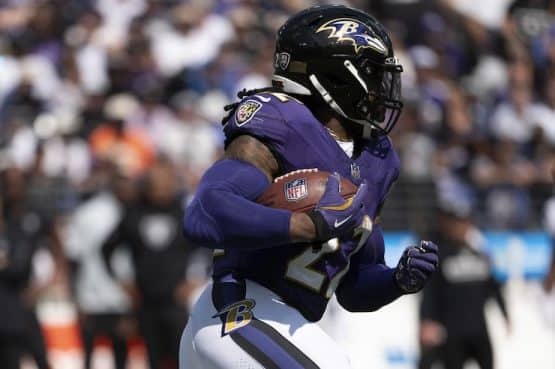
John Harbaugh wants to revive the Ravens running game. One look at Baltimore’s lack of production in the run and in maintaining time of possession in the Final 2015 Season Team Stats below will underscore his point.
Offensive coordinator Marc Trestman’s hands were somewhat tied in his ability to call a balanced offense, however. His offensive line was unable to get any consistent push due to the constant flux of personnel because of injury. Backups did the best they could, but there is no substitute for healthy starters playing together as a cohesive unit for an entire season. Then his best running back Justin Forsett went out for the year with a broken arm. Add to all of that the fact that the Ravens were often playing from behind in the score and had to throw the ball more than they wanted to just to get back into a game.
When Gary Kubiak was OC in 2014 the run game was clicking. But Kubiak had healthy guards, tackles and a center for the greater part of that season. He also had the luxury of a well-protected and healthy Joe Flacco throwing big play completions to receivers to give his team the lead in most games. Those factors combined set up the Ravens running game very nicely in 2014. The exact opposite happened for Trestman’s offense in 2015.
A big part of the cure for the Ravens run game in 2016 will rely on strengthening personnel at left tackle, center and right tackle. Adding a couple of legitimate vertical threats at wide receiver will also be key to prevent opposing defenses from stacking the box against the run.
A lot better luck in the health department will help, too. It couldn’t get any worse—could it?
Anyway, read ’em and weep—here are the final numbers for the Ravens offense behind a 5-11 disaster of a season:
| BALTIMORE RAVENS | OPPONENTS | |
|---|---|---|
| TOTAL FIRST DOWNS | 323 | 311 |
| FIRST DOWNS (RUSHING-PASSING-BY-PENALTY) | 89-211-23 | 80-189-42 |
| THIRD DOWN CONVERSIONS | 85/226 | 86/216 |
| FOURTH DOWN CONVERSIONS | 12/24 | 4/9 |
| TOTAL OFFENSIVE YARDS | 5,749 | 5,398 |
| OFFENSE (PLAYS-AVERAGE YARDS) | 1,079/5.3 | 998/5.4 |
| TOTAL RUSHING YARDS | 1,478 | 1,661 |
| RUSHING (PLAYS-AVERAGE YARDS) | 383-3.9 | 418-4 |
| TOTAL PASSING YARDS | 4,449 | 3,957 |
| PASSING (COMP-ATT-INT-AVG) | 426-676-21-6.6 | 350-545-6-7.3 |
| SACKS | 37.0 | 24.0 |
| FIELD GOALS | 33/40 | 30/36 |
| TOUCHDOWNS | 33 | 45 |
| TOUCHDOWNS (RUSHING-PASSING-RETURNS-DEFENSIVE) | 8-21-1-3 | 10-30-0-5 |
| TIME OF POSSESSION | 30:32 | 30:36 |
| TURNOVER RATIO | -14 | |
| PLAYER | ATT | COMP | YDS | COMP % | YDS/ATT | TD | TD% | INT | INT% | LONG | SCK | SACK/LOST | RATING |
|---|---|---|---|---|---|---|---|---|---|---|---|---|---|
| Joe Flacco | 413 | 266 | 2,791 | 64.4 | 6.8 | 14 | 3.4 | 12 | 2.9 | 50 | 16 | 124 | 83.1 |
| Ryan Mallett | 97 | 58 | 566 | 59.8 | 5.8 | 2 | 2.1 | 2 | 2.1 | 39 | 2 | 19 | 74.5 |
| Jimmy Clausen | 85 | 49 | 555 | 57.6 | 6.5 | 2 | 2.4 | 3 | 3.5 | 48 | 3 | 8 | 70.5 |
| Matt Schaub | 80 | 52 | 540 | 65 | 6.8 | 3 | 3.8 | 4 | 5 | 48 | 3 | 27 | 76 |
| Sam Koch | 1 | 1 | -3 | 100 | -3 | 0 | — | 0 | — | -3 | 0 | 0 | 79.2 |
| PLAYER | ATT | YDS | YDS/ATT | LONG | TD |
|---|---|---|---|---|---|
| Justin Forsett | 151 | 641 | 4.2 | 33 | 2 |
| Javorius Allen | 137 | 514 | 3.8 | 44 | 1 |
| Terrance West | 46 | 180 | 3.9 | 17 | 0 |
| Lorenzo Taliaferro | 13 | 47 | 3.6 | 7 | 1 |
| Jimmy Clausen | 6 | 28 | 4.7 | 8 | 0 |
| Joe Flacco | 13 | 23 | 1.8 | 16 | 3 |
| Michael Campanaro | 2 | 17 | 8.5 | 9 | 1 |
| Matt Schaub | 4 | 10 | 2.5 | 7 | 0 |
| Sam Koch | 1 | 7 | 7 | 7 | 0 |
| Terrence Magee | 2 | 5 | 2.5 | 4 | 0 |
| Ryan Mallett | 1 | 4 | 4 | 4 | 0 |
| Kyle Juszczyk | 2 | 3 | 1.5 | 2 | 0 |
| Anthony Levine | 1 | 3 | 3 | 3 | 0 |
| Jeremy Ross | 1 | 2 | 2 | 2 | 0 |
| Chris Givens | 3 | -6 | -2 | 2 | 0 |
| PLAYER | REC | YDS | YDS/REC | LONG | TD |
|---|---|---|---|---|---|
| Kamar Aiken | 75 | 944 | 12.6 | 48 | 5 |
| Steve Smith | 46 | 670 | 14.6 | 50 | 3 |
| Javorius Allen | 45 | 353 | 7.8 | 41 | 2 |
| Kyle Juszczyk | 41 | 321 | 7.8 | 39 | 4 |
| Crockett Gillmore | 33 | 412 | 12.5 | 46 | 4 |
| Maxx Williams | 32 | 268 | 8.4 | 28 | 1 |
| Justin Forsett | 31 | 153 | 4.9 | 32 | 0 |
| Jeremy Butler | 31 | 363 | 11.7 | 41 | 0 |
| Chris Givens | 19 | 346 | 18.2 | 48 | 1 |
| Nick Boyle | 18 | 153 | 8.5 | 25 | 0 |
| Marlon Brown | 14 | 112 | 8 | 22 | 0 |
| Jeremy Ross | 9 | 88 | 9.8 | 18 | 0 |
| Chris Matthews | 9 | 97 | 10.8 | 21 | 1 |
| Daniel Brown | 6 | 64 | 10.7 | 31 | 0 |
| Lorenzo Taliaferro | 5 | 29 | 5.8 | 11 | 0 |
| Michael Campanaro | 5 | 35 | 7 | 11 | 0 |
| Terrance West | 4 | 21 | 5.3 | 8 | 0 |
| Darren Waller | 2 | 18 | 9 | 17 | 0 |
| Terrence Magee | 1 | 2 | 2 | 2 | 0 |
| PLAYER | 1-19 A | 1-19 M | 20-29 A | 20-29 M | 30-39 A | 30-39 M | 40-49 A | 40-49 M | 50+ A | 50+ M |
|---|---|---|---|---|---|---|---|---|---|---|
| Justin Tucker | 0 | 0 | 10 | 10 | 9 | 9 | 11 | 10 | 10 | 4 |
| TOTAL | 0 | 0 | 10 | 10 | 9 | 9 | 11 | 10 | 10 | 4 |
| OPPONENTS TOTAL | 0 | 0 | 7 | 6 | 8 | 8 | 12 | 10 | 9 | 6 |
| PLAYER | PUNTS | AVG | TOUCHBACKS | IN 20 | LONG | BLK |
|---|---|---|---|---|---|---|
| Sam Koch | 74 | 46.7 | 5 | 29 | 67 | 0 |
| TOTAL | 74 | 46.7 | 5 | 29 | 67 | 0 |
| OPPONENTS TOTAL | 80 | 45.9 | 5 | 24 | 70 | 1 |
| PLAYER | RETURNS | FC | YDS/RET | LONG | TD |
|---|---|---|---|---|---|
| Kaelin Clay | 23 | 3 | 10.6 | 82 | 1 |
| Jeremy Ross | 10 | 5 | 10.9 | 42 | 0 |
| Michael Campanaro | 3 | 3 | 16.3 | 21 | 0 |
| Lardarius Webb | 2 | 3 | 8 | 9 | 0 |
| Steve Smith | 2 | 1 | 16 | 22 | 0 |
| TOTAL | 40 | 15 | 11.2 | 82 | 1 |
| OPPONENTS TOTAL | 35 | 12 | 5 | 29 | 0 |
| PLAYER | RETURNS | YDS | YDS/RET | LONG | TD |
|---|---|---|---|---|---|
| Kaelin Clay | 14 | 343 | 24.5 | 39 | 0 |
| Jeremy Ross | 7 | 205 | 29.3 | 46 | 0 |
| Raheem Mostert | 5 | 164 | 32.8 | 50 | 0 |
| Michael Campanaro | 3 | 79 | 26.3 | 29 | 0 |
| Terrence Magee | 1 | 28 | 28 | 28 | 0 |
| Za’Darius Smith | 1 | 15 | 15 | 15 | 0 |
| Nick Boyle | 1 | 10 | 10 | 10 | 0 |
| Kyle Juszczyk | 1 | 7 | 7 | 7 | 0 |
| Maxx Williams | 1 | 6 | 6 | 6 | 0 |
| TOTAL | 34 | 857 | 25.2 | 50 | 0 |
| OPPONENTS TOTAL | 9 | 229 | 25.4 | 40 | 0 |
Add The Sports Daily to your Google News Feed!

