With 30 games completed, the San Antonio Spurs sit with the second best record in the NBA at 24-6. Since Volume 2 of the Spurs’ 10 game review, the team went 8-2 in their last 10 games, with a notable win against the Houston Rockets, but San Antonio did suffer two losses at the hands of the Chicago Bulls and the Los Angeles Clippers (again).
Still, San Antonio is on pace for a 66-win season and they’re in the Top-10 both offensively and defensively, so let’s see how the team is doing under the microscope.
Section I. Scoring
| Category | Volume 1 | Rank | Volume 2 | Rank | Currently | Rank |
| Offensive Rating (Points Per 100 Possessions) | 107.7 PP/100 | 6th | 108.6 PP/100 | 6th | 108.9 PP/100 | 6th |
| Field Goal % | 44.7% | 13th | 46.1% | 6th | 46.8% | 4th |
| 3-Point % | 38.6% | 2nd | 40% | 1st | 40.8% | 1st |
| Points in Paint | 36.2 points | 29th | 34.3 points | 29th | 36.9 points | 29th |
| Bench Points Per Game | 37.6 points | 9th | 36.0 points | 11th | 36.8 points | 11th |
| Transition Points | 11.9 points | 20th | 11.0 points | 24th | 11.2 points | 22nd |
Let’s take a look at the Spurs’ starting five of Tony Parker, Danny Green, Kawhi Leonard, LaMarcus Aldridge and Pau Gasol in more detail. Together, the Spurs’ starting five has a Net Rating of +4.6 Points Per 100 Possessions in 225 minutes and 15 total games.
I was interested to see how that ranks with some of the other five-man units in the NBA, and when I inputted a minimum of 200 minutes, it turns out, while the Spurs’ starting five doesn’t seem like they’re off to a spectacular start, they’re still a Top-10 efficient lineup when narrowing it down to the criteria of over 200 minutes played.
The Spurs’ starting five isn’t at the level of the Warriors’ starting five (+16.9 Pp/100) or Clippers before Blake Griffin’s injury (+16.2 Pp/100), but, of the 10 best lineups in the league with over 200 minutes together, the Spurs still have only played in 15 games together, the least of that group. This doesn’t seem like a main topic on the agenda list for the coaching staff, as they’re still allowing key members of the Spurs’ starting five to sit out games for rest, such as Aldridge, Parker and Gasol recently. Once the starting unit gets five to 10 more games on the floor together, then the production might provide a better picture of looking at whether or not it’s their best five-man unit to start at the beginning of games.
Where do the Spurs’ points come from?
| Area | Volume 1 | Rank | Volume 2 | Rank | Currently | Rank |
| Points in the Paint | 35.5% | 29th | 33.3% | 30th | 35.4% | 27th |
| 3-Pointers | 23.8% | 20th | 25.5% | 17th | 26.0% | 15th |
| Free Throws | 20.4% | 2nd | 19.4% | 3rd | 17.9% | 11th |
| Mid-Range | 20.2% | 4th | 21.8% | 1st | 20.7% | 1st |
While the Spurs are still the league leader in getting their points from the mid-range area, they’ve slightly declined from taking that shot a bit less over the last 10 games. Also, with more ball movement and Leonard’s usage beginning to decline as the data will show below, the Spurs have seen a minor increase in their percentage of points in the paint and from the 3-point line, while their free throw attempts have started to decline.
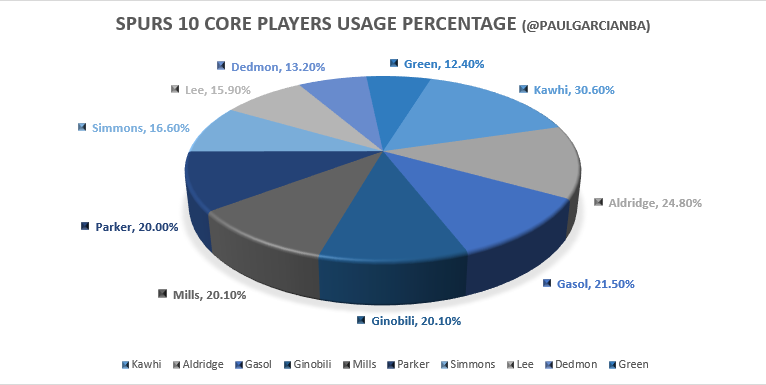
Using the NBA’s Usage Percentages for players, I created the chart below to show the Spurs’ 10 core players and how much of the team’s possessions they’ve been using when on the floor.
Let’s discuss Aldridge a bit. Last season, Aldridge averaged 18.0 points on 14.1 shots in 30.6 minutes, with 1.5 assists and he went to the free throw line 4.1 times per game.
This season, Aldridge is averaging 16.4 points on 13.9 shots in 31.9 minutes, with 2.0 assists and he’s getting to the free throw line 3.9 times per game.
In 9 of the Spurs’ past 10 games, Aldridge averaged 14.1 points on 42.9% shooting, but he saw an increase of 2.9 assists, however, his free throw attempts decreased to 2.9 per game.
After looking through an assortment of metrics, I wanted to know why Aldridge’s scoring has slightly dipped this season, and my conclusion is based on three findings – the addition of Gasol, shots aren’t going in, and some of it depends on the game plan/ Aldridge’s aggressiveness.
First, unlike being paired with Tim Duncan last year, this season, Aldridge plays mostly beside Gasol, who is much more offensive oriented. Here’s a few of their metrics just to prove that point:
Usage: Duncan 17.4%, Gasol 21.5%
Percentage of team points: Duncan 15.9%, Gasol 21.6%
Having Gasol in the offense allows more spacing, but it also takes away a few shot attempts from Aldridge. Instead of running Parker/Aldridge pick and pops multiple times like last season, now, Aldridge has to share setting those screens and pops with Gasol, plus, with Kawhi Leonard as a primary ball handler too, he juggles using picks with Aldridge and Gasol. Gasol might also usually get a hefty amount of picks because Parker and Leonard’s ultimate goal is to try to get a center switched onto them, so that they have the advantage on the drive, or Gasol has the guard in a mismatch.
In looking at where he’s getting his shots from, Aldridge still gets them from the same three areas mainly – mid-range, the restricted area, and non-restricted area. While his shooting percentages in the restricted area and non-restricted area are just slightly down compared to last season, it’s his looks from the mid-range that show where he’s struggling.
Last season, on mid-range attempts, Aldridge shot 43.6% from the floor, which was 3.7% above league average. This season, he’s shooting 38.4% from the mid-range, which is 1.7% below league average. After watching film of his mid-range looks, part of it is just Aldridge simply missing those pick-and-pop looks. Since he’s only played in 27 games, the percentages of the past show that as the season progresses, and if those shots are still available, Aldridge’s percentage from the mid-range should see an uptick once again toward league average.
The shot though from the mid-range that is going to be more of an individual decision by Aldridge is the over the shoulder mid-range shot from outside of the paint. This is a high difficulty shot Aldridge likes to use when posting up against defenders with size and length, like traditional 5s, but when he has small ball 4s or guards defending him in mismatches, he has to decide if turning over the shoulder is the best shot or if taking the mismatch deeper into the paint is a better decision. There’s been evidence of Aldridge becoming more aggressive and posting up further into the paint when he has a mismatch, like recently against the Blazers on some possessions, but those scenarios depend on how aggressive Aldridge is on those nights and if the team’s game plan naturally shifts toward his mismatches in the paint.
Defenses are starting to help more often on Aldridge when he posts up, and as you can see from the increase in his assists, he’s starting to move the ball more often when he’s reading those doubles and finding shooters open, most notably Danny Green as of late. Through 27 games, Aldridge has an assist percentage of 10.8%, which is the fourth highest of his career thus far. It’s up from the 8.1% he had last season.
On the last episode of the Project Spurs Roundtable, Project Spurs’ own Collin Reid made a good point to the panel. When asked about Aldridge’s slow start, he mentioned how last season Aldridge got off to a slow start as well because he was adjusting to a new role on a brand new team and he had to learn to build the chemistry with Duncan. Though Aldridge is now on the same team this season, there’s still a process for he and Gasol to build chemistry as well together, just like the other three members of the starting five, since Gasol brings more options to the offense.
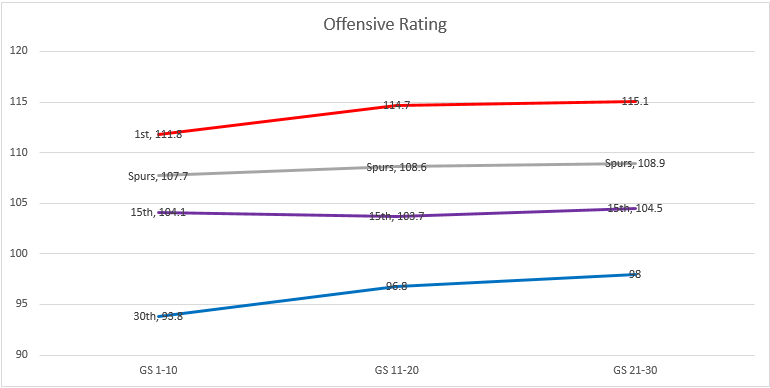
Where do the Spurs rank in Offense thus far?
Best: Toronto Raptors 115.1 PP/100
Spurs: 108.9 PP/100 – 6th
League Average: Charlotte Hornets 104.5 PP/100
Worst: Philadelphia 76ers 98.0 PP/100
Section II. Ball Movement
| Category | Volume 1 | Rank | Volume 2 | Rank | Currently | Rank |
| Assists | 21.1 assists | 17th | 22.7 assists | 9th | 23.4 assists | 7th |
| Turnovers | 11.5 turnovers | 3rd Best | 12.8 turnovers | 7th | 13.3 turnovers | 10th |
| Assisted Made Baskets | 57.8% | 14th | 61.2% | 6th | 61.2% | 8th |
| Unassisted Made Baskets | 42.2% | 14th | 38.8% | 25th | 38.8% | 23rd |
| Passes Per Game | 311.7 Passes | 9th | 318.8 Passes | 5th | 320.4 Passes | 6th |
| Secondary Assists Per Game | 5.4 assists | 14th | 6.1 assists | 3rd | 6.1 assists | 4th |
| Points Created By Assists | 50.7 points | 16th | 54.3 points | 9th | 56.2 points | 8th |
| Bench Assists Per Game | 8.3 assists | 8th | 9.4 assists | 5th | 9.9 assists | 1st |
During their last 10 games, the Spurs showed what they’re capable of when they’re moving the ball together for a full 48 minutes, as they posted a season high 38 assists against the Brooklyn Nets, 33 assists against the Boston Celtics and also 31 assists against the New Orleans Pelicans. Overall, the Spurs were able to pick up almost a full assist for their season average, as they’re still considered a Top-10 passing team by most metrics.
Their bench is also now doing what their past benches have done in the past – leading the league in bench assists per game.
Section III. Defense
| Category | Volume 1 | Rank | Volume 2 | Rank | Currently | Rank |
| Defensive Rating (Points Per 100 Possessions) | 100.6 PP/100 | 7th | 102.5 PP/100 | 12th | 101.4 PP/100 | 3rd |
| Opponent Field Goal Attempts | 81.1 FGA | 6th | 82.2 FGA | 5th | 82.6 FGA | 6th |
| Opponent FG% | 43.8% | 10th | 45.3% | 18th | 44.5% | 10th |
| Opponent 3-Point Field Goal Attempts | 27.7 3PT-FGA | 23rd | 24.9 3PT-FGA | 7th | 25.5 3PT-FGA | 10th |
| Opponent 3-Point FG% | 32.1% | 7th | 35.0% | 15th | 33.6% | 2nd |
| Opponent Corner 3-Point % | 28.6% | 4th | 34.0% | 3rd | 34.7% | 3rd |
| Opponent Corner 3-Pointers | 7.7 FGA | 28th | 7.1 FGA | 26th | 6.6 FGA | 24th |
| Opponent Above the Break 3-Pointers | 19.3 FGA | 19th | 17.4 FGA | 2nd | 18.6 FGA | 6th |
| Opponent Above the Break 3PT% | 34.7% | 21st | 36.2% | 23rd | 33.8% | 7th |
| Opponent Free Throw Attempts | 21.7 FTA | 11th | 19.8 FTA | 6th | 20.5 FTA | 5th |
| Opponent FG% in Restricted Area | 58.8% | 11th | 59.1% | 9th | 59.1% | 8th |
| Opponent Shots in Restricted Area | 24.3 FGA | 4th | 25.4 FGA | 6th | 26.4 FGA | 10th |
| Force Mid-Range Shots | 18.1 FGA | 23rd | 20.0 FGA | 15th | 19.5 FGA | 16th |
| Defensive Rebounds | 33.9 Reb | 15th | 32.6 Reb | 22nd | 33.5 Reb | 18th |
| Limit Opponent Offensive Rebounds | 7.8 Rebounds | 3rd | 9.1 Rebounds | 3rd | 9.5 Rebounds | 7th |
| Opponent Transition Points | 12.4 PPG | 12th | 12.5 PPG | 17th | 12.9 PPG | 15th |
This is a category where the Spurs really made a jump, as they went from 12th in Defense after 20 games to now 3rd in Defense after 30 games. As you compare the numbers from different areas of the floor, the two that stick out are the Spurs’ defense of teams shooting from the floor overall (44.5%) and from 3-point range (33.6%).
One area to watch that’s not listed above is the Spurs’ pick-and-roll defense. I combined the Spurs’ team defense against the pick-and-roll ball handler with the P&R roll man through 28 games this season, compared to last season’s data. Here’s what the findings showed:
Last Season vs Pick & Roll combined: 1.69 Points Per Possession
This Season vs Pick & Roll combined: 1.95 PPP
Earlier, we discussed how Gasol has become a weapon on the offensive end for the Spurs, but on the defensive end, that’s not so much the case. When Gasol has to guard the pick-and-roll ball handler, the outcome is teams scoring 2.33 PPP. Against most teams, the Spurs might have their bigs drop back on screens so their guards can recover. However, when the playoffs eventually roll around later in the season, when San Antonio faces teams that have deadly shooters who can knock down 3s off of screens, there could be a chance Gasol’s minutes might see a decline in those matchups. Again though, it comes down to being all about matchups.
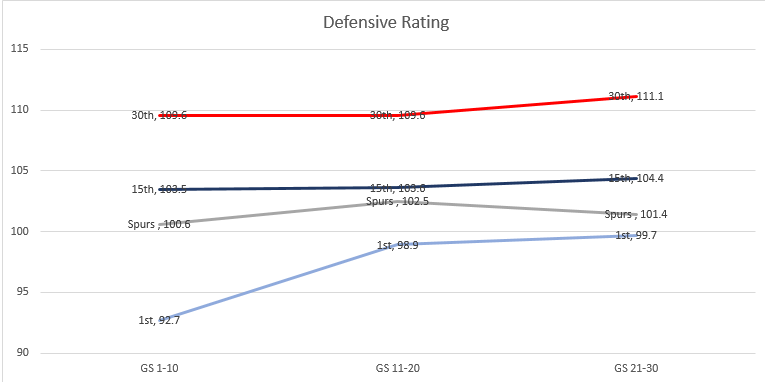
Where do the Spurs rank in Defense thus far?
Best: Memphis Grizzlies 99.9 PP/100
Spurs: 101.4 PP/100 – 3rd
League Average: New Orleans Pelicans 104.4 PP/100
Worst: Portland Trail Blazers 111.1 PP/100
Section IV. Record Vs. Elite teams (.600 Winning Percentage)
| Category | Currently |
| Winning Percentage | 50% |
| Record | 3-3 |
The Spurs are currently 3-3 against teams with records of .600 or above.
Golden State Warriors: 1-0
Los Angeles Clippers: 0-2
Houston Rockets: 2-1
Total: 3-3
Section V. The Next 10
The Spurs’ next 10 games will take place over 21 days from 12/25 to 01/14. During that stretch, the team won’t have any back-to-back sets, and the only team with a record above .600 they’ll face is the Toronto Raptors on 01/03/2017.
Data gathered from NBA.com/stats. Bench stats collected from HoopsStats.com after 29 games for San Antonio.
Add The Sports Daily to your Google News Feed!


