Through 70 games, the San Antonio Spurs (54-16) continue to chug along as one of the best teams in the NBA, as they’re on pace to win 63 games this season. Only the Golden State Warriors (57-14) have a better record than the Spurs, and in the Spurs’ last 10 games, they held the one-seed for a night, before the Warriors reclaimed the title for best record in the league.
As has been done after every 10 games the Spurs play, here’s an update with different metrics on how the Spurs are doing on both sides of the floor through 70 games.
Section I. Scoring
The Spurs’ offense has slowly started to decline just a bit, but overall, they’re still a Top-10 offensive team. When you look at what the numbers say, the first quarter seems to be the problem for the Spurs lately on offense. The table below shows the Spurs’ Net Rating in each individual quarter of the season, before the All-Star break, and after the All-Star break. Note the inefficient first quarters the Spurs have been producing.
| Quarter | Entire Season | Pre-ASB | Post-ASB |
| 1Q | +5.2 Pp/100 | +7.9 Pp/100 | -5.6 Pp/100 |
| 2Q | +9.6 Pp/100 | +9.5 Pp/100 | +10.3 Pp/100 |
| 3Q | +14.1 Pp/100 | +13.9 Pp/100 | +14.6 Pp/100 |
| 4Q | +4.8 Pp/100 | +4.8 Pp/100 | +4.9 Pp/100 |
Once Pau Gasol suffered his finger injury, the Spurs inserted Dewayne Dedmon into the starting lineup. Overall, in 197 minutes, that lineup statistically has been better (+12.2 Net Rating with Dedmon) than when Gasol was starting (+7.1 Net Rating with Gasol). When Gasol was out, the move seemed to work well. Dedmon was able to catch lob dunks when teams focused too much on Kawhi Leonard or LaMarcus Aldridge, and he made their league best defense even better with his rim protection and quickness to hard hedge and disrupt pick-and-rolls.
However, since the team has been relatively healthy outside of Leonard’s concussion incident, Aldridge’s heart situation and Parker’s back stiffness after the All-Star Break, the starting lineup with Dedmon has started digging itself into holes in most games. After the All-Star Break, in 80 minutes with Dedmon, the starting five is scoring just 98.9 Pp/100 and holding teams to 97.7 Pp/100. While the defense is still beyond elite with Dedmon, the offense has sputtered at an efficiency level worst than the Philadelphia 76ers, who own the league’s worst offense.
The reason could be due to a number of factors; maybe shots just aren’t falling in games, maybe the Spurs aren’t bringing their best focus to begin games, as they’ve been guilty of doing lately, or maybe defenses have scouted Dedmon now that he’s in the starting five and they know outside of taking away his rim runs, he’s not really a threat to hurt them with outside shooting.
From the eye test, this can sometimes be seen. I put the following video clip together to show a few offensive possessions in the first quarters after the All-Star break where defenders drop back on Pick-and-Rolls Dedmon sets to prepare to take away any driving lanes from the Spurs’ ball handlers.
[protected-iframe id=”38cdbaadd57f9dfb7d2da0ab0e677aea-114320562-25928832″ info=”//screencast-o-matic.com/embed?sc=cbe0h26GZL&v=5&ff=1″ width=”640″ height=”317″ frameborder=”0″ scrolling=”no”]As noted in the video, this is just a limited sample of clips, based only on the first quarter. One bright spot for Dedmon and the starters to look at is that after the All-Star break, the Spurs have a monster +14.6 Pp/100 Net Rating in third quarters. So, if there’s something working in the third quarter, maybe the team can tinker with the offense to try to get that efficiency in the beginning of games too. Or, perhaps another look with Gasol as a starter might be necessary. Only the future will tell.
Where do the Spurs’ points come from?
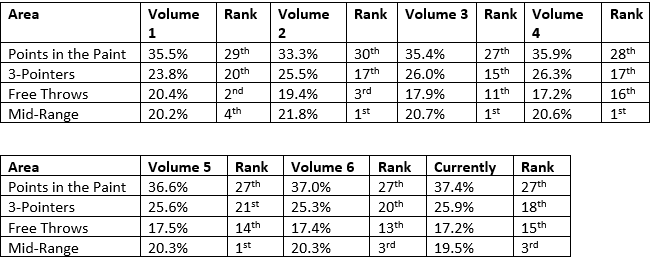
As the latest data collection shows, the Spurs are 18th in generating points from beyond the arc. One notable area where the Spurs are getting most of their made 3-pointers is from the corners. The Spurs have made the 5th most corner 3s in the NBA (200) and they’re shooting a lethal 43.2% from the corners (ranked 2nd). As you’ll see in the clip below, the Spurs’ corner 3s are usually created off dribble penetration either off the catch or out of the pick and roll.
[protected-iframe id=”9efd9b2dd96dd2df46e8ec4beec4d34a-114320562-25928832″ info=”//screencast-o-matic.com/embed?sc=cbe0ft6G0k&v=5&ff=1″ width=”640″ height=”317″ frameborder=”0″ scrolling=”no”]Using the NBA’s Usage Percentages for players, I created the chart below to show the Spurs’ 10 core players and how much of the team’s possessions they’ve been using when on the floor.
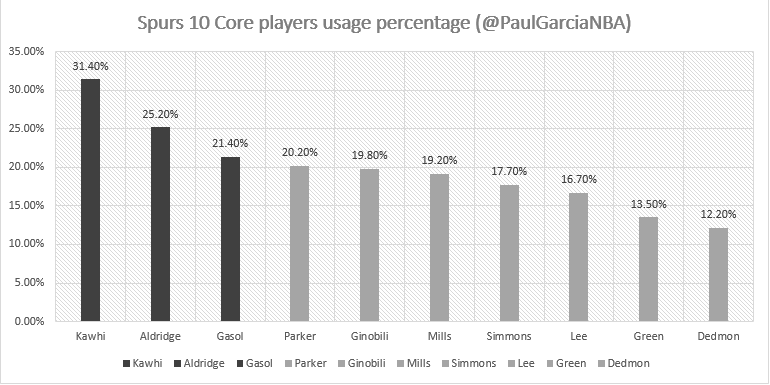
Despite being 39-years old, one must wonder where that Spurs’ second unit would be this season had Manu Ginobili retired this past summer? Ginobili has been able to stay relatively healthy this season, as he’s missed 10 games mostly due to rest. As you can see above, Ginobili is the team’s 5th playmaker on the average night. While he may not be able to carry the offense like he used to alongside Tim Duncan and Parker, the Spurs still have a Top-10 scoring and passing bench, and Ginobili is a big part of the success of the bench.
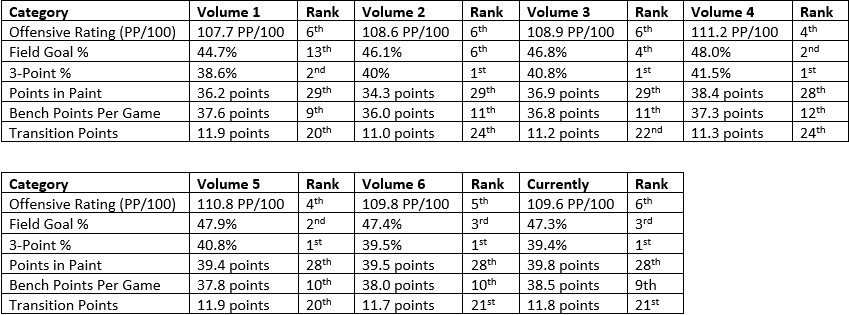
Where do the Spurs rank in Offense thus far?
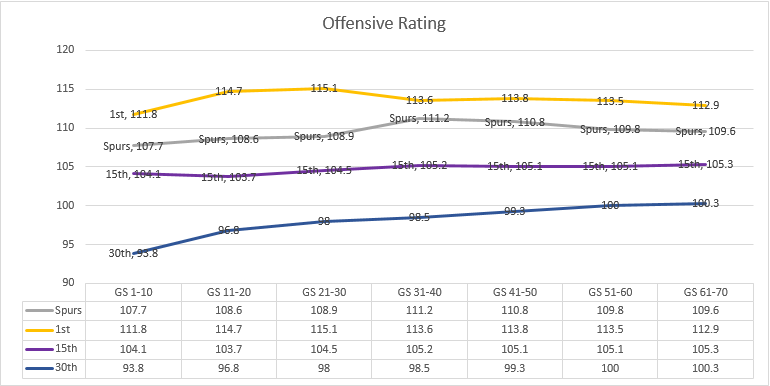
Best: Golden State Warriors – 112.9 Pp/100
Spurs: 109.6 Pp/100 – 6th
League Average: Oklahoma City Thunder – 105.3 Pp/100
Worst: Philadelphia 76ers – 100.3
Section II. Ball Movement
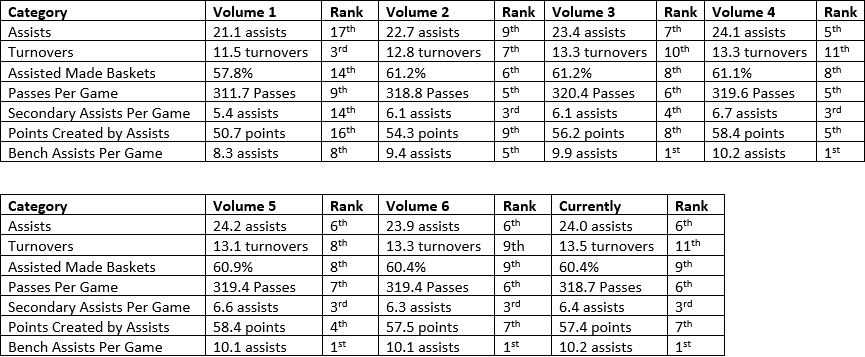
As written this past week, when the Spurs tally 30 or more assists in a game this season, they’re a perfect 13-0.
Section III. Defense

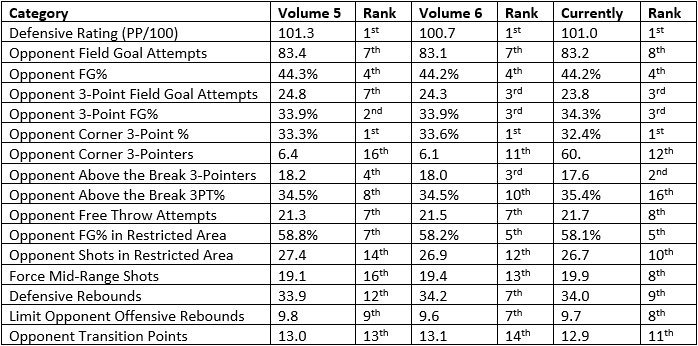
The one area to note regarding the Spurs’ defense is the opponent shooting percentage on above the break 3s. While the Spurs’ defense does an excellent job of limiting those types of looks (17.6 shots for opponents per game), when those 3s do get hoisted in the air, teams are knocking down 35.4% of them, which ranks the Spurs 16th in that category. When you think of where those 3s come from with the eye test, picture scenarios where guards who can shoot 3s call for a pick, and the Spurs’ defense either doesn’t contest the three off the screen, or a switch takes place with a big, and the shooter can either launch from deep or drive in to create more havoc.
Where do the Spurs rank in Defense thus far?
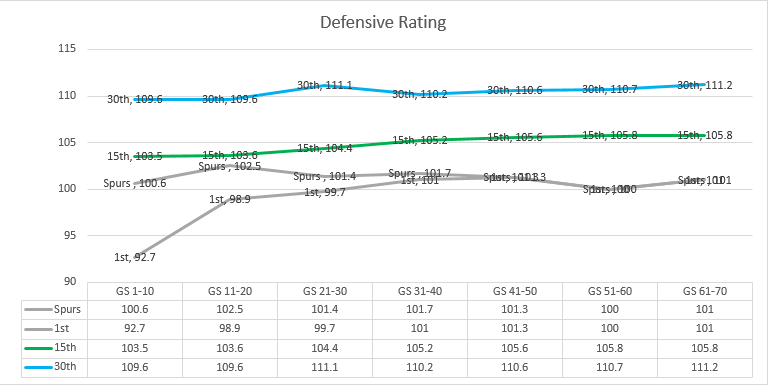
Best: San Antonio Spurs – 101.0 Pp/100
League Average: Philadelphia 76ers – 105.8 Pp/100
Worst: Los Angeles Lakers 111.2 Pp/100
Section IV. Record Vs. Elite teams (.600 Winning Percentage)
| Category | Currently |
| Winning Percentage | 85% |
| Record | 11-2 |
The Spurs are currently 11-2 against teams with records of .600 or above.
Golden State Warriors: 2-0
Houston Rockets: 3-1
Cleveland Cavaliers: 1-0
Boston Celtics: 2-0
Utah Jazz: 1-1
Washington Wizards: 2-0
Total: 11-2
Section V. The Next 12
Here’s the good about the Spurs’ final 12 games of the season; 8 of those matches are in the AT&T Center. Here’s the tough part; 8 of those 12 teams have records above .500, the Spurs still have two back-to-back sets left, and the team won’t have two consecutive days off until after their last game of the season before round one of the playoffs begins.
With the one-seed still reachable, it’ll be interesting to see how the coaching staff monitors minutes down the stretch of the season to make sure the core players are as healty as possible before round one begins.
Data gathered from NBA.com/stats as of 03/22/2017 at 10:00 PM CST. Bench stats collected from HoopsStats.com after 70 games for San Antonio. Passing stats collected after 69 games.
Add The Sports Daily to your Google News Feed!