Prior to the start of the season, Vegas set the over/under for Spurs wins this season at 56.5. If you bet the over, you walked away with some money, as the Spurs, in their first season without Tim Duncan, finished with the second best overall record at 61-21.
Much of the Spurs’ success can be attributed to their MVP nominee Kawhi Leonard, but with seven new players added to the roster, it should also be noted how Head Coach Gregg Popovich molded the roster to put a product on the court that was elite on both ends of the floor. General Manager R.C. Buford also deserves credit for the free agent signings he made this summer, as three of the Spurs’ seven new players to the roster became key core players.
This series began back in November after the Spurs’ 10th game of the season. If you’ve followed along, you’ll know that it’s been updated almost like a live journal after every 10 games, to check in on how the Spurs have been playing statistically and how they’ve faired against elite competition. With the season now complete, it’s time to review the data and see how the Spurs ranked in different offensive and defensive categories as they begin their postseason run.
Section I. Scoring
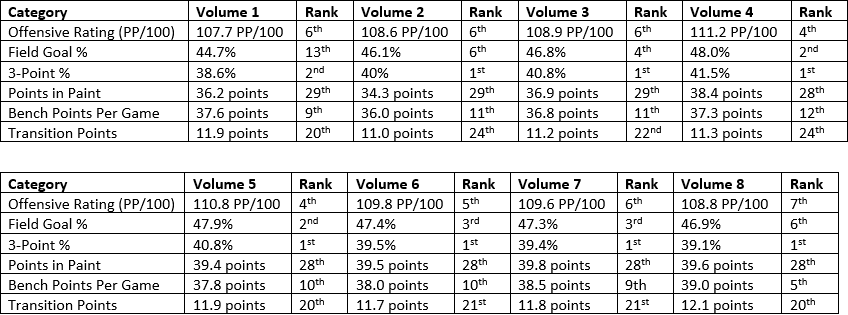
The Spurs finished the season as an efficient Top-10 offense, placing 7th overall. The Spurs ranked Top-10 in most of the categories listed above except points in the paint and transition points. In the next section below, we’ll dive into why the Spurs don’t score a lot of points in the paint, but in regards to the low amount of transition points, the reason for that can be attributed to the Spurs’ pace in games.
The Spurs use 96.42 possessions per 48 minutes, which ranks 27th in the NBA. When an opponent misses a shot, the Spurs use the following method on the offensive end which leads to a slower pace.
- Gang Rebound – even if the opposing team misses a shot, the defensive possession doesn’t end until the defense grabs the rebound. By the Spurs using the gang rebound method, they want all five players to stay on the defensive end of the floor to maximize their chances of securing the board. This leads to less transition opportunities because the guards and wings don’t get to leak out as often for fast break points.
- Push and Fill – Once the Spurs do secure the defensive rebound, they push the ball up the floor and fill the fast break lanes. If there’s an open shot available either at the 3-point line or in the paint, San Antonio will pursue the shot. Outside of Jonathon Simmons, the Spurs’ core players don’t get a ton of their points off fast break chances.
- Move Ball Attack – If there’s no fast break opportunity, the Spurs then slow the pace down by moving the ball around the perimeter through their motion offense, which gives them the chance to move the defense around before San Antonio settles for a pick-and-roll, drive to the basket, or post-up possession. Again, this takes time, which leads to a slower pace in the game.
Where do the Spurs’ points come from?
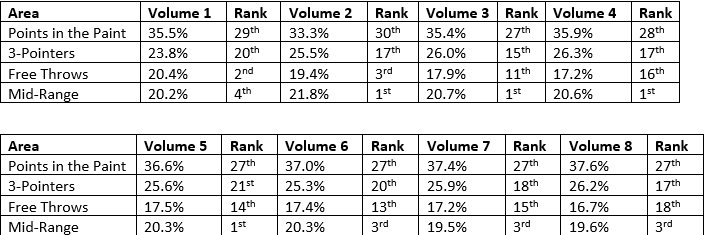
Now we can dive into the Spurs’ low amount of points in the paint. While most of the Spurs’ points do come from the paint (37.6%), it’s still a low percentage when looking at the league as a whole. Putting the Spurs’ top five playmakers under a microscope, the data reveals how those specific players have a wide arrange of skills that allow them to score in a variety of ways.
Leonard – 28.3% of Leonard’s points come from the paint, but he doesn’t just have to rely on that way to score, as he can get points from the free throw line, mid-range and 3-point line at a healthy volume.
LaMarcus Aldridge – 38.9% of Aldridge’s points come from the paint, but like Leonard, Aldridge is a versatile big who can play inside and out, as he gets a good chunk of his points from the mid-range and free throw line.
Pau Gasol – 38.1% of Gasol’s points come from the paint, but he is even more versatile as a big than Aldridge, because Gasol can also score from mid-range, the 3-point line, and free throw line. Because Aldridge and Gasol can step outside of the paint to provide spacing, they don’t score as many points in the paint as typical back to the basket centers such as Enes Kanter of the Oklahoma City Thunder (68.2% of points from paint), Anthony Davis of the New Orleans Pelicans (46.2% of points from paint) and DeMarcus Cousins from the Pelicans (43.5% of points from paint).
Tony Parker – Parker gets 47.3% of his points from the paint, which is more than every starting point guard in the Western Conference playoffs. However, that’s basically it for Parker in terms of scoring the basketball. 28.5% of his points come from mid-range, and with less shot attempts, he doesn’t get to the free throw line as often anymore, and he doesn’t take enough threes to make that shot a dangerous weapon. The other starting point guards all have a more versatile skill set in being able to collect their points, whether it’s getting those points from the 3-point line or the free throw line, as well as the paint.
Manu Ginobili – At age 39, Ginobili gets 26.3% of his points from the paint. His main area where he gets his points these days is from beyond the arc, where he collected 51.6% of his points per game. Ginobili can still set up teammates off pick and roll or dribble drive action, but as far as being a threat to get to the basket and finish, those days aren’t as consistent anymore.
Having only Leonard, Aldridge and Gasol as the three players who can score buckets consistently near the rim makes it difficult for the Spurs to score when their shots aren’t falling from the outside, or when a defense uses a scheme to double the post, or get the ball out of Leonard’s hands in pick-and-rolls.
Using the NBA’s Usage Percentages for players, I created the chart below to show the Spurs’ core players and how much of the team’s possessions they’ve been using when on the floor.
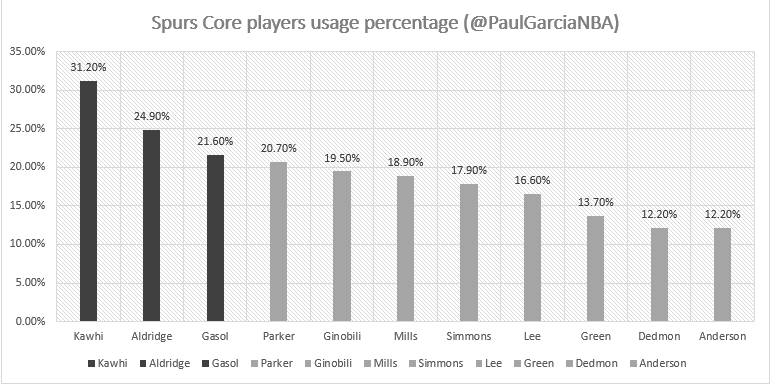
Coach Popovich might play a 10-man rotation in the playoffs, with either Kyle Anderson or Simmons getting about 13 minutes as the backup small forward for Leonard. As to which of those two players gets the role, that’ll be interesting to see. For most of the season, Simmons was the usual backup for Leonard. However, since mid-March, it’s been Anderson who has usually been Leonard’s backup in games.
Where did the Spurs finish in Offense?
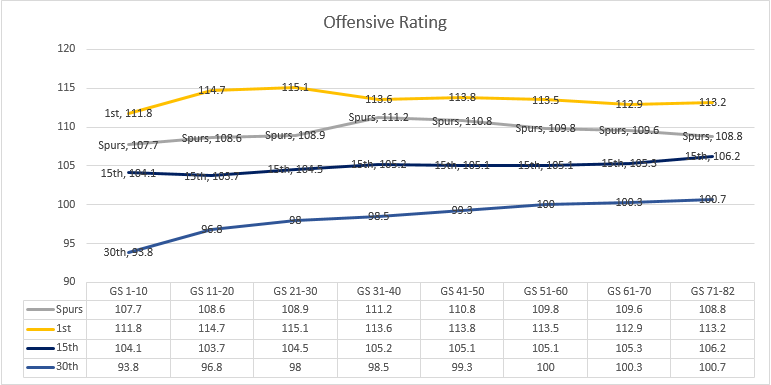
Best: Golden State Warriors – 113.2 Pp/100
Spurs: 108.8 Pp/100 – 8th
League Average: Indiana Pacers – 106.2 Pp/100
Worst: Philadelphia 76ers – 100.7
The Spurs ended the season closer to league average in offense, rather than being near the level of the Warriors.
Section II. Ball Movement
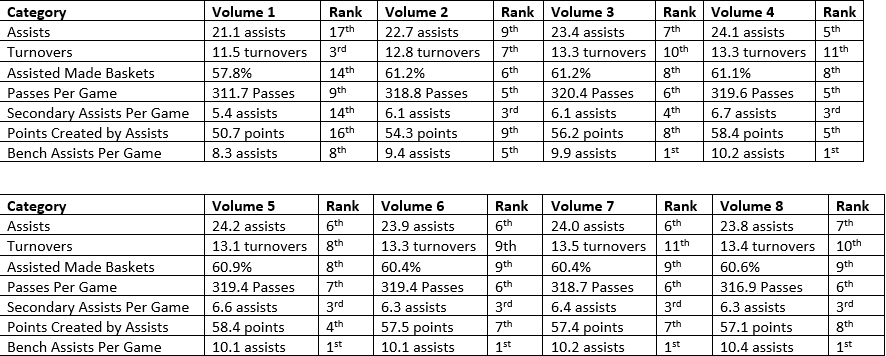
While the Spurs don’t collect the assist numbers the ‘good to great’ 2014 Spurs did (25.2 assists), the ball movement is still part of the system, as the Spurs rank Top-10 in most passing metrics and San Antonio continues to not beat themselves, as they have a low number of turnovers per game.
Section III. Defense
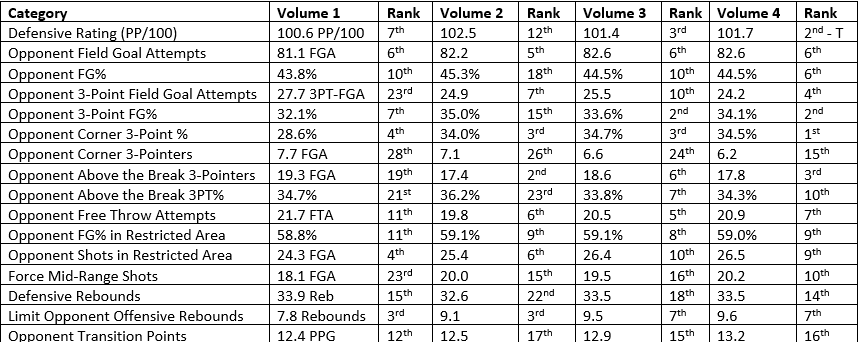
Even minus their defensive anchor in Duncan from last season, the Spurs still managed to put the best defense in the NBA on the floor each night, as they ranked Top-10 in most of the important defensive categories.
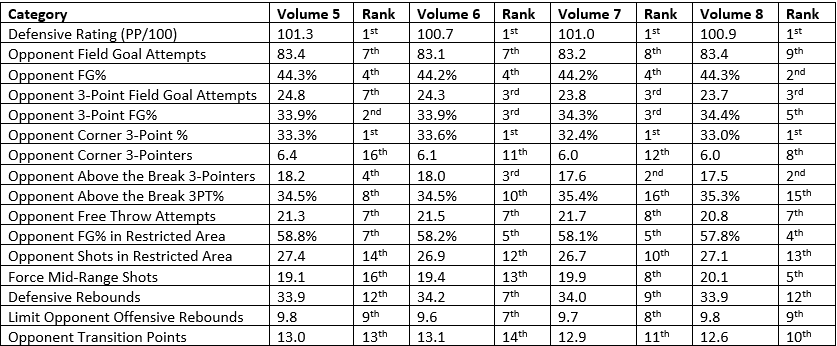
The one area I did want to focus on was the Spurs’ defense against Above-the-break threes. The Spurs ranked 15th in this area, as teams shot 35.3% on those attempts. The good news for the Spurs is that they usually don’t give up a ton of those attempts from above-the-break, but when teams do get those shots, they’re making them at a league average percentage.
I put the video below together to demonstrate where the Spurs are having trouble guarding the Above-the-break center threes. As you watch the film against Western Conference playoff teams, you’ll notice that most of the Spurs’ defensive mistakes on these possessions comes when a perimeter player penetrates the lane and kicks the ball out, or when a Spurs big (Aldridge, Gasol, David Lee, Dewayne Dedmon) have to switch onto a guard or small forward.
[protected-iframe id=”a939795ae92c0ffa4874ce6388469b0a-114320562-25928832″ info=”//screencast-o-matic.com/embed?sc=cbf21VXeAh&v=5&ff=1″ width=”640″ height=”317″ frameborder=”0″ scrolling=”no”]While the Memphis Grizzlies won’t force a ton of switches with the Spurs’ bigs and hoist threes over them, this could be a problem in the future rounds, should the Spurs advance. If San Antonio advances and draws teams like the Houston Rockets or Warriors, that could spell trouble for the Spurs’ bigs, as those two teams know how to force switches and they’re dangerous from three on the perimeter.
Where did the Spurs finish in Defense?
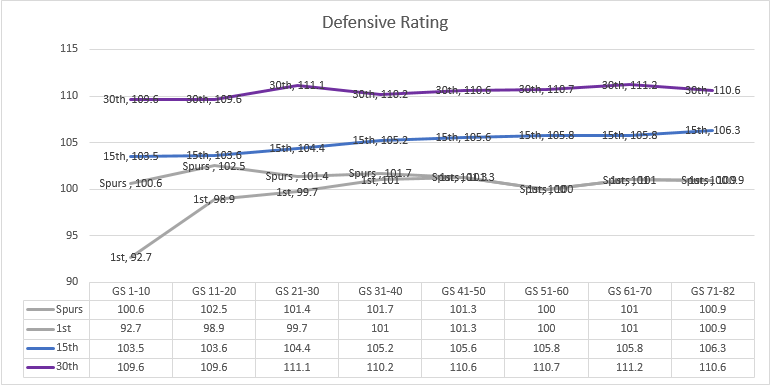
Best: San Antonio Spurs – 100.9 Pp/100
League Average: Dallas Mavericks – 106.3 Pp/100
Worst: Los Angeles Lakers 110.6 Pp/100
Section IV. Record Vs. Elite teams (.600 Winning Percentage)
| Category | Currently |
| Winning Percentage | 67% |
| Record | 14-7 |
The Spurs finished the season 14-7 against teams with records of .600 or above.
Golden State Warriors: 2-1
Houston Rockets: 3-1
Cleveland Cavaliers: 2-0
Boston Celtics: 2-0
Utah Jazz: 2-2
Toronto Raptors: 2-0
Los Angeles Clippers: 1-3
Total: 14-7
Section V. On to the Playoffs
With a Top-10 offense and defense, the Spurs have all the ingredients needed on paper to be a championship contender. However, the playoffs are a whole other animal and they will come down to specific matchups and which team can make the proper adjustments within a series.
Data gathered from NBA.com/stats as of 04/13/2017. Bench stats collected from HoopsStats.com after 82 games for San Antonio. Passing stats collected after 81 games.
Add The Sports Daily to your Google News Feed!