The Tampa Bay Rays are taking an unconventional route with their pitching staff — and, more specifically, the starting rotation — in 2018. How else do you explain them only having two starting pitchers on their depth chart?
It’s not as if this strategy isn’t working, though. When looking at team pitching statistics for the season, Tampa Bay is among the top 10 in both fWAR and ERA. Now that Chris Archer finally got traded away, the starting hurler that’s leading the way is southpaw Blake Snell.
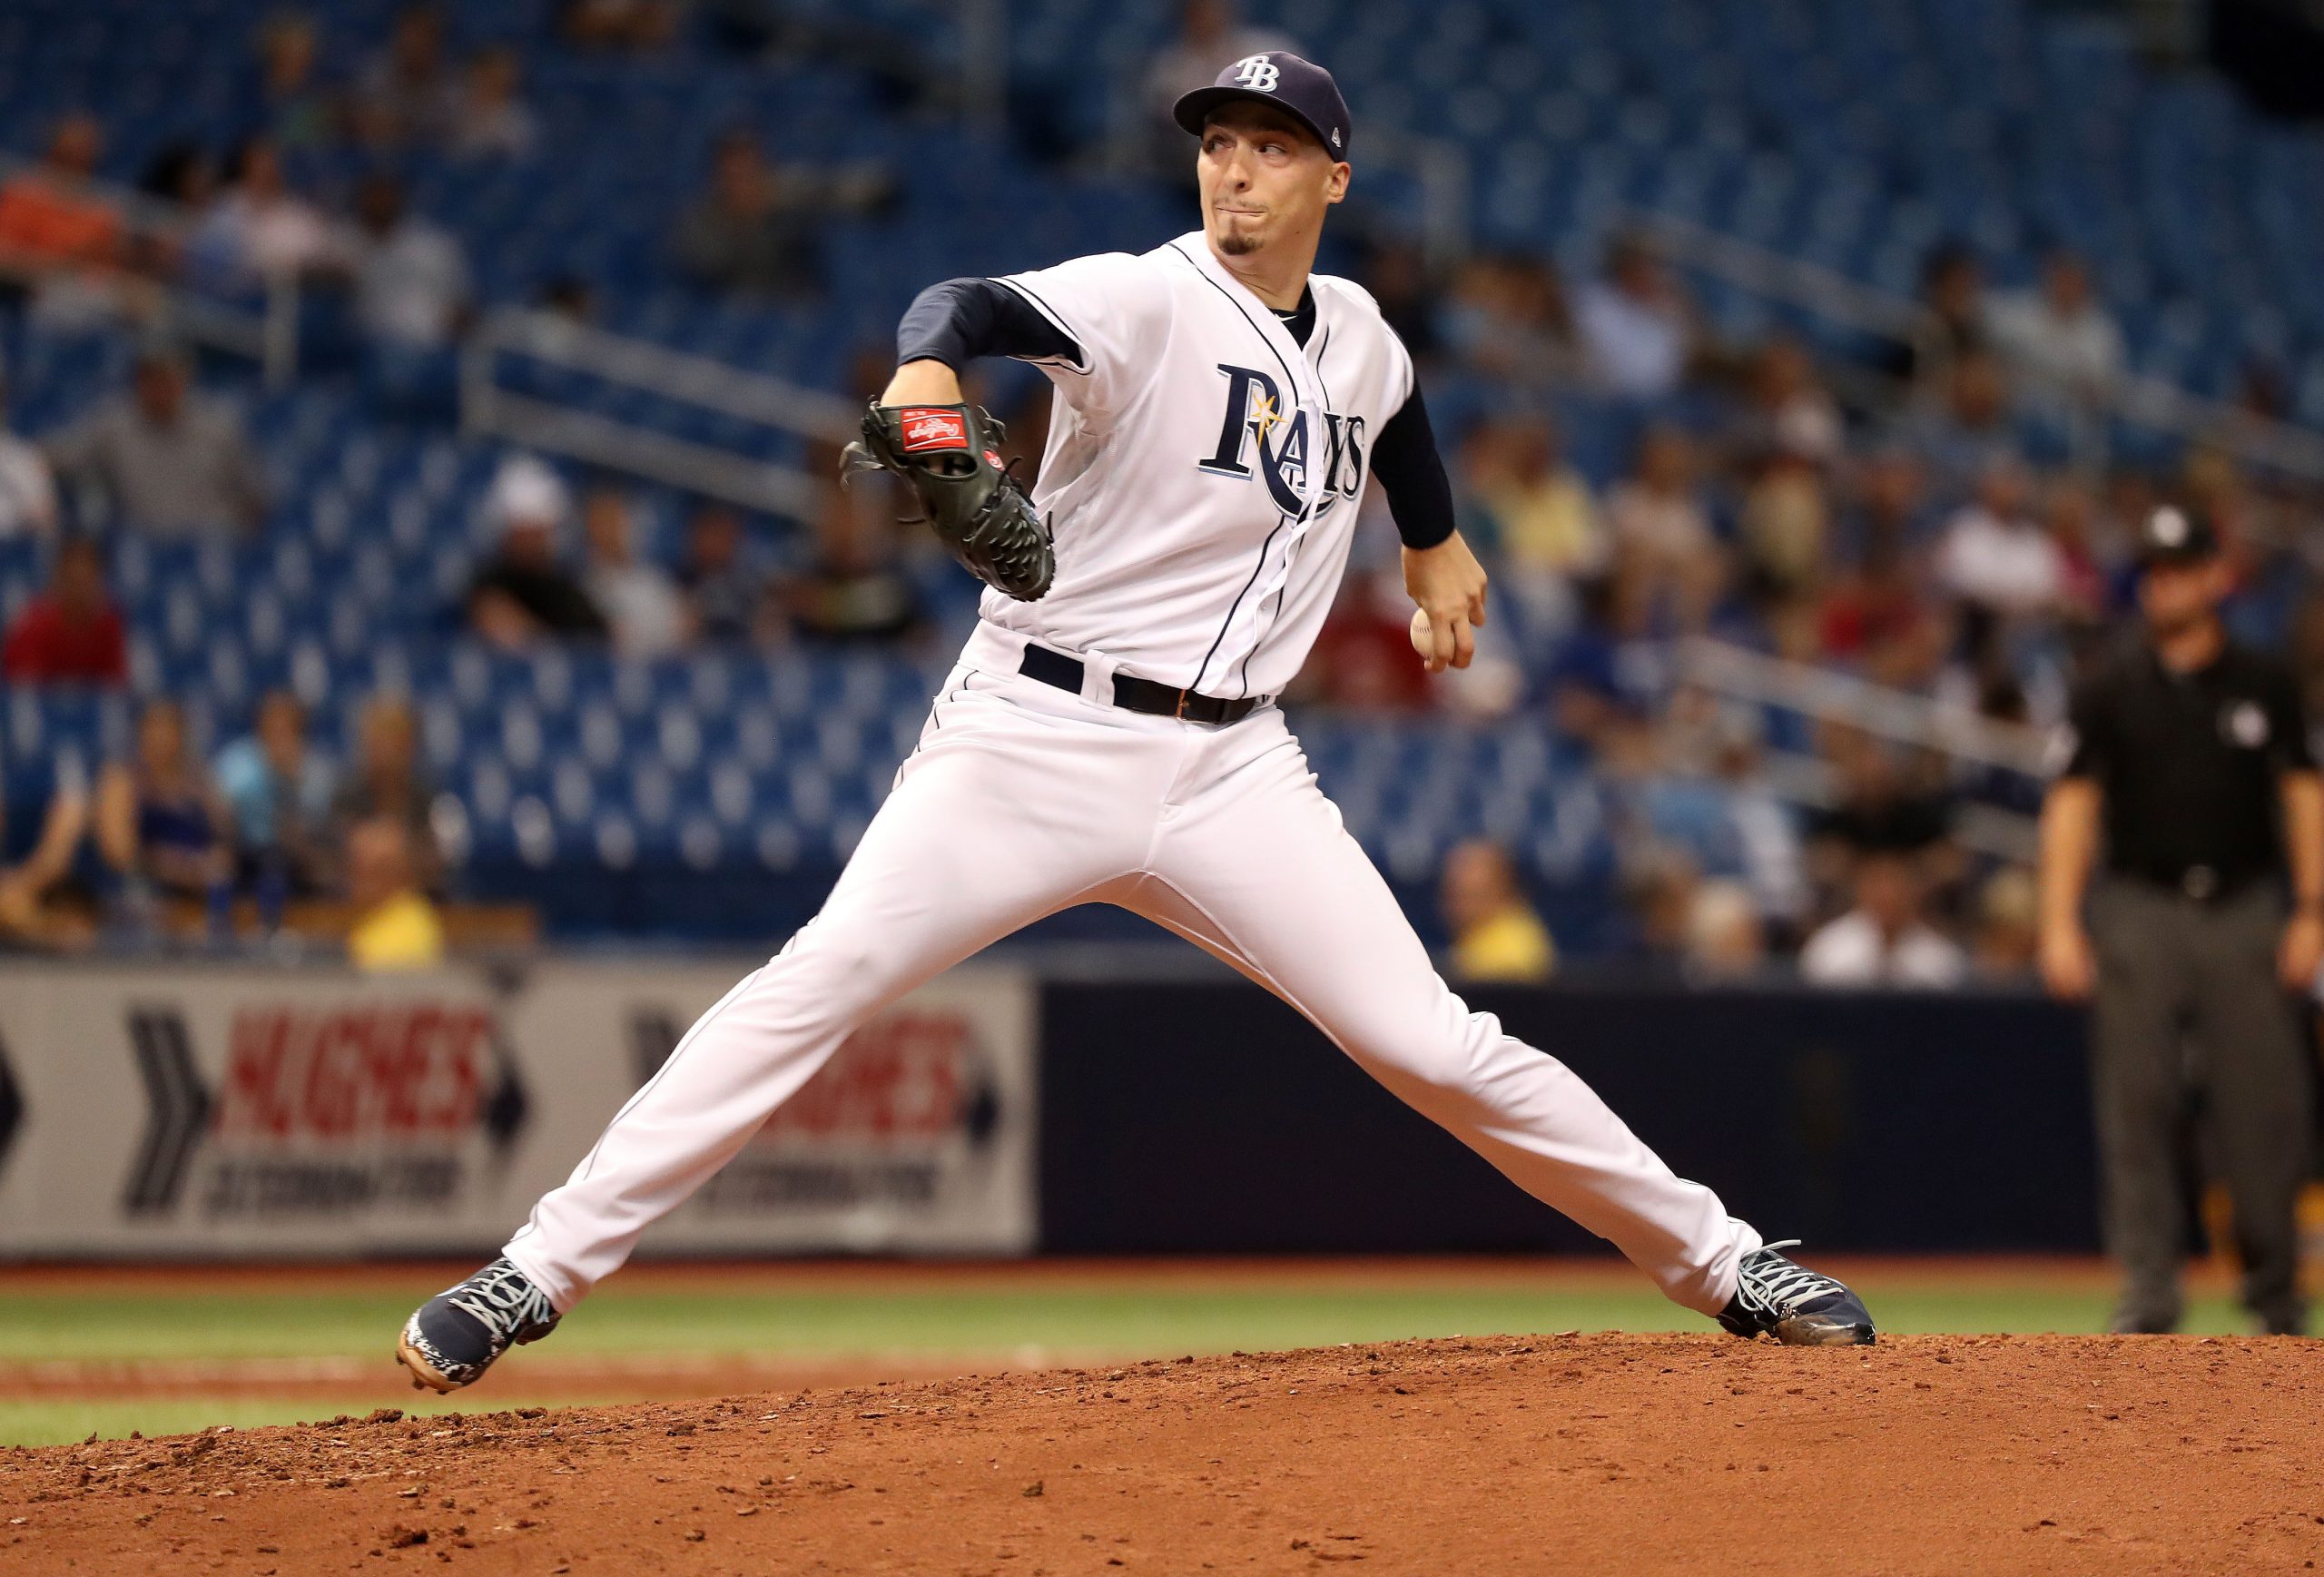
The 25-year-old has truly broken out in his third big-league campaign. After allowing just one run with 11 strikeouts in six innings against the Kansas City Royals earlier in the week, Snell boasts a 2.07 ERA, 3.54 SIERA, 29.4% strikeout rate, 3.0 fWAR, and 15 wins through 139 innings. That’s a big uptick in production when looking at his first two years in the majors: 11 wins with a 3.83 ERA, 4.64 SIERA, 22.9% strikeout rate, and 3.8 fWAR in 218.1 frames.
He’s basically been dominating opposing hitters from the get-go:
Blake Snell:
Last 9 starts: 1.22 ERA, .162 BAA
Last 15 starts: 1.55 ERA, .169 BAA
Last 22 starts: 1.87 ERA, .180 BAA
This season: 2.07 ERA, .182 BAA— Jeremy Frank (@MLBRandomStats) August 23, 2018
And if we’re looking to see just how much his ERA and strikeout rate have improved over time, this graph properly puts it into perspective:
Blake Snell’s 15 start rolling stats over the course of his career (blue is ERA, red is K%): pic.twitter.com/SSAuiT4xIe
— Jeremy Frank (@MLBRandomStats) August 23, 2018
That encouraging second-half performance he experienced to finish 2017 has carried over seamlessly.
Snell’s batted-ball profile looks nearly identical to what it was last season, but there are major differences in a few other places. Outside of the meteoric rise in strikeouts, his 9.4% walk rate has a chance of ending up below 10.0% for the first time in his career. He’s also on pace to increase his chase rate for the third consecutive year while also allowing less contact than ever before (69.2%).
The southpaw’s pitch mix has stayed reasonably similar except for a rise in curveball usage (10.3% in ’17, 17.8% in ’18). That’s easily his most effective pitch right now, as opposing hitters have posted a 60.8% strikeout rate, .327 OPS, .070 ISO, and -5 wRC+ against it thus far.
The Rays undoubtedly love the value they’re getting out of him — Snell is making a smidge over $558K in 2018, but his performance has been worth $23.9 million, according to FanGraphs’ Value metric. He doesn’t enter arbitration until 2020, which means Tampa Bay can hypothetically pay pennies on the dollar for a top-shelf pitcher next year, too.
About Matt Musico
Matt currently manages Chin Music Baseball and contributes to The Sports Daily. His past work has been featured at numberFire, Yahoo! Sports and Bleacher Report. He’s also written a book about how to become a sports blogger. You can sign up for his email newsletter here.
Add The Sports Daily to your Google News Feed!