It took just 3 weeks for the Penguins to have games postponed with Covid rearing its ugly head. Though John Marino has found himself on the Covid Protocol list, we need only look to New Jersey and the Devils with their 17 players on the list dictating this little lull in the Pens schedule.
This mini break a gives the Penguins some time to work on some of the problems plaguing them so far before heading to New York to face the Islanders (3-4-2, 9 points, 7th in the division) on Saturday night.
The few days off also give us an opportunity to dig a little deeper into the Penguins’ problems (and successes) after their first 10 games of the season, where they have a record of 5-4-1, good for 11 points and 4th place in their division.
So let’s take a look at some of that, shall we?
- 1 – The amount of regulation wins the Penguins have this season. Three of their 5 have come before heading to the shootout, but notching just one regulation win isn’t ever going to cut it, even this early in the season. On the plus side, they’re sort of grinding out results despite not playing particularly well, winning 42.9% of their games when trailing after 2 periods (4th best in the NHL) and 40% of their games when conceding the first goal (tied 12th best in the NHL). But in a season where every game is against divisional opposition, ceding points to the rest of the division isn’t exactly a positive path forward for a team with playoff and Stanley Cup aspirations.
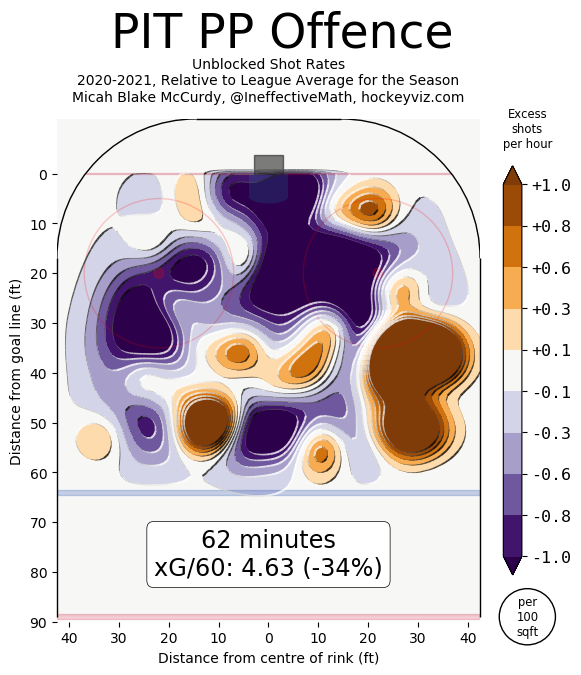
- 13.9% – The Penguins powerplay conversion rate. The powerplay struggles have been well documented. Only 9 teams are converting at a worse clip, while only 8 teams have scored fewer than their 5 powerplay goals. This all in spite of the Pens getting the 14th most powerplay opportunities so far in the early going. Their 72.00 shot attempts, 54.48 unblocked attempts, and 37.94 shots on goal per hour of powerplay time all rank last in the league, while their 4.66 expected goals for per hour ranks second last league-wide. Worse yet, they’ve also given up the most expected goals against per hour while on the man advantage at 1.56, all via Evolving Hockey. It’s about as bad as any of us can ever remember. Via HockeyViz.com, we can see that the top of the right wing circle/right point are the only areas where they are truly generating more unblocked shots compared to the league average. Everywhere else, and most importantly the net front and entire slot region are seeing a substantial amount less than league average in terms of these unblocked shot attempts.

The Penguins have members of their top power-play unit shooting around or through tri-pod “dummies.” pic.twitter.com/Qi0ee9eNqH
— Seth Rorabaugh (@SethRorabaugh) February 4, 2021
Ending the overall static-ness, shooting the puck, and crashing the net have to be the first steps towards rectifying the powerplay’s struggles.
- 0 – The combined total of 5-on-5 goals off the sticks of Sidney Crosby and Evgeni Malkin. Crosby does have 4 goals on the season (2 PP, 2 at 3-on-3), while Malkin’s lone marker came on the powerplay. The only constant each of them has had this season has been their left wingers, Guentzel and Zucker, who have 2 and 3 5v5 goals respectively. Both top lines for the Penguins have looked better since Rust was elevated to Crosby’s right wing and and Kapanen on the right on Geno’s line. In just under an hour of 5v5 play together, Guentzel-Crosby-Rust have controlled 63.49% of the expected goals, 62.93% of the shot attempts, and 60.0% of the actual goals scored, outscoring their opposition 3-2 so far. Meanwhile, the Zucker-Malkin-Kapanen line, in just over 50 minutes of 5v5 play, have outscored their opponents 4-2, though they haven’t carried the bulk of the play yet, controlling just 47.3% of the expected goals and 48.61% of the shot attempts. They are, however, owning a 50.91% share of the unblocked attempts while on the ice together, all via Evolving Hockey. These are, admittedly, small sample sizes, but historically the Guentzel-Crosby-Rust have had similar results to what they’ve had together this season, while Malkin has visually looked better since Kapanen got up there with him.
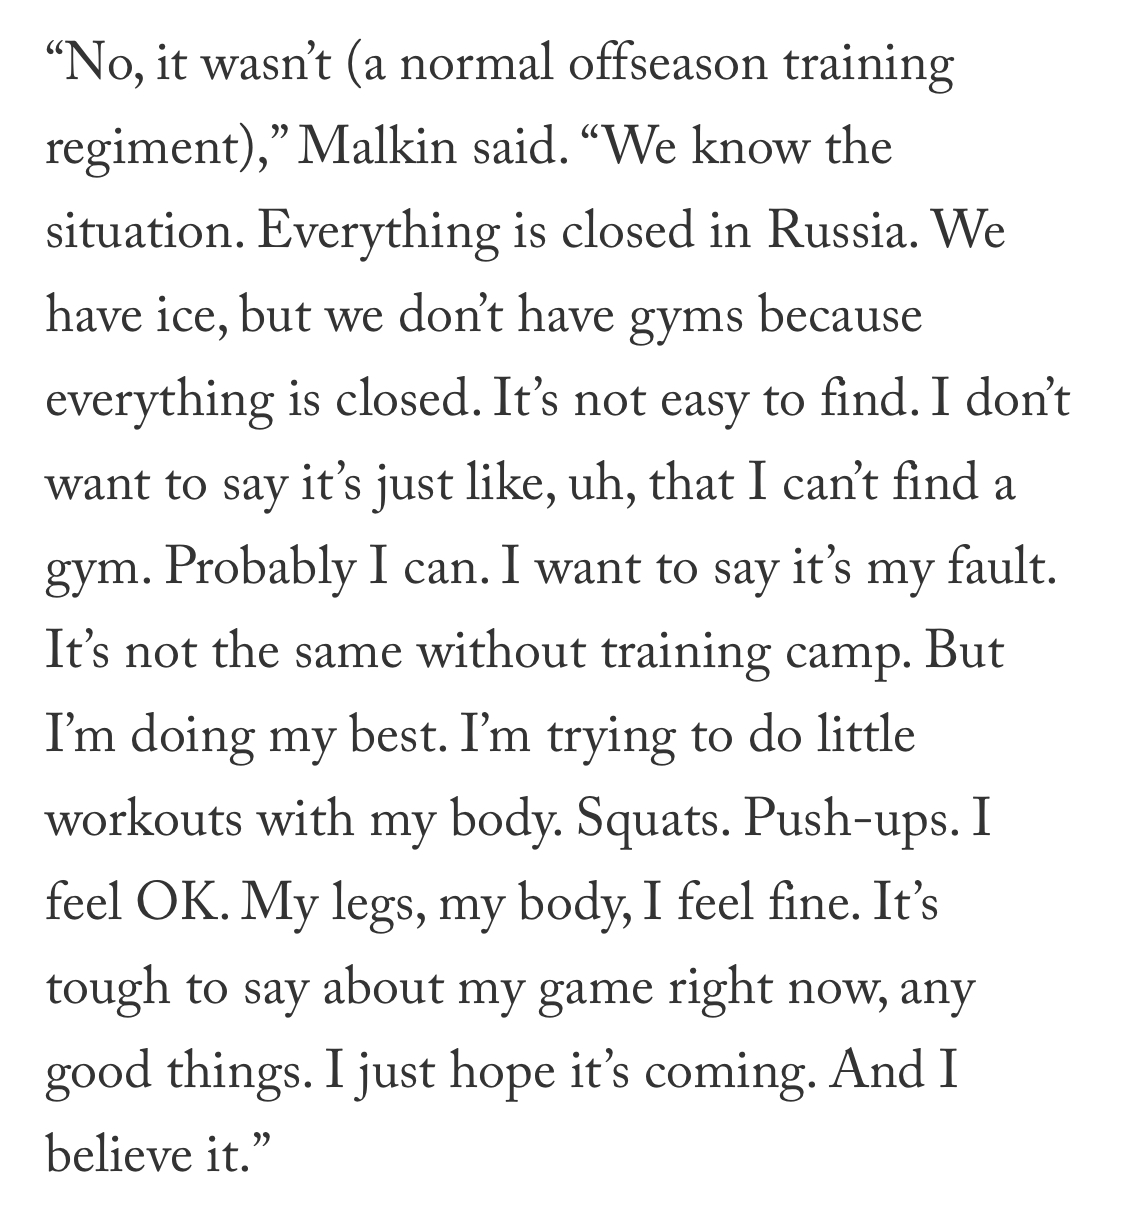
- 7.46 – The amount of individual shots Malkin has attempted at 5v5. In each of Malkin’s last 4 seasons, he’s attempted 11.99, 12.87, 12.09, and 12.45 shots at 5v5 per 60 minutes of ice time. To say 7.46 is out of character would be an understatement. This drop off is across the board as well, as he’s getting 2+ fewer shots on target and high danger scoring chances, roughly 5 fewer scoring chances, and over 0.4 fewer expected goals all per hour of 5v5 play compared to any and all of his last 4 seasons (via Natural Stat Trick). Malkin himself admitted he didn’t get to train like he normally would have this offseason and if his legs and conditioning aren’t there, the rest of his game is going to suffer. As the condition starts coming back, you’d expect these shot rates to start coming back to a level where they belong as well. The sooner that comes, the better.
- 2.4 – Kasperi Kapanen’s Goals Above Replacement, via Evolving Hockey. Per Evolving Hockey, Goals Above Replacement is a metric that attempts to assign a total value to each player, which represents how much that player contributed to their team in a single number. Kapanen’s cumulative 2.4 ranks 2nd on the team, 0.1 behind Jared McCann. Adjusting per 60 minutes of ice time, his 1.366 GAR/60 ranks first on the team. On top of that, his 1.544 Even Strength Offense per 60 minutes and 1.323 Total Offense per 60 minutes are both team highs, ahead of McCann’s 1.239 EVO/60 and 0.981 Total Offense/60, all via Evolving Hockey. Kapanen’s been the best Pens player so far this season.
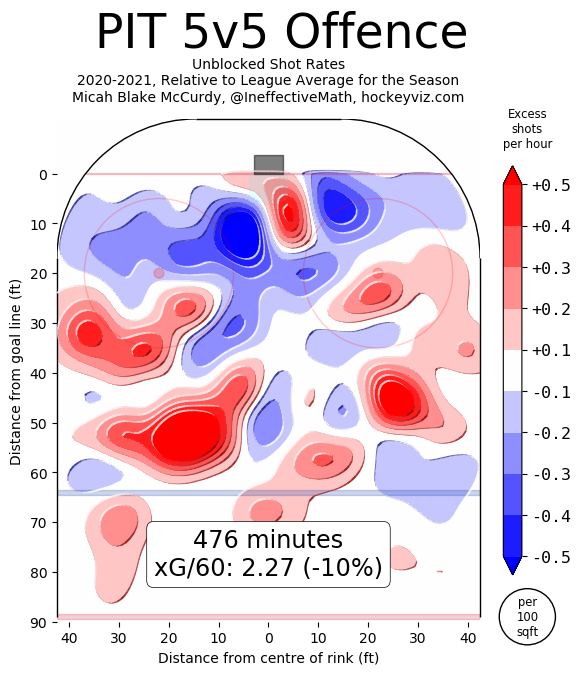
- 2.27 – The Penguins Expected Goals For Per 60 Minutes of 5-on-5 Play, via Hockey Viz. This is roughly 10% below the league average and puts them towards the bottom of the middle third of the league. Much like the woes of the powerplay, the slot region is virtually uninhabited by the Penguins’ shots. They are getting more unblocked shots compared to the league average (red below) in the low slot, which is very good, but the area is limited here. Virtually everything is being generated from the left wing/point and very little elsewhere. Equally concerning, they are generating 50.92 shot attempts, which ranks 22nd in the league, via Evolving Hockey. Also per Evolving Hockey, they are controlling 50.13% of the expected goals (17th) and 53.72% of the shot attempts (5th) at 5v5, but simply are not generating enough offensively despite that.
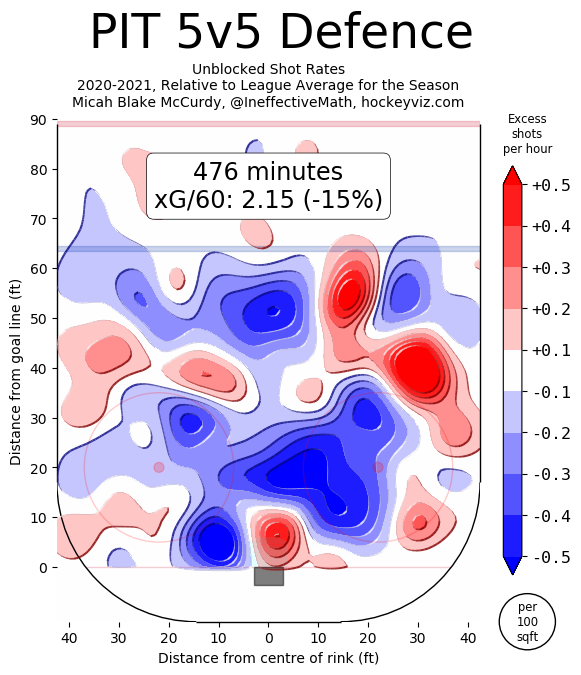
Via Hockey Viz - 2.15 – The Penguins Expected Goals Against Per Hour of 5-on-5 Play, via Hockey Viz. Oddly enough, in the face of all of the injuries on the blue line, the Penguins have excelled defensively and has certainly contributed to their overall control of the events taking place on the ice. They aren’t generating much, but aren’t giving up much, either. Their 2.15 expected goals against here is 15% lower than that of the league average and, utilizing Evolving Hockey’s model, ranks 15th in the league. No team in the NHL is giving up fewer shot attempts per hour of 5v5 play than the Penguins and their 43.86 rate. Only Vegas has allowed fewer unblocked attempts per hour than the Pens’ 33.28, while their 25.21 5v5 shots on goal against per 60 minutes is the 6th fewest. Much like on offense, defensively the Penguins aren’t giving their opponents much in the slot (blue below) other than the lowest portion of the slot. If they can tighten that up, they’ll be in good shape and should help fix their -7 goal difference on the year.
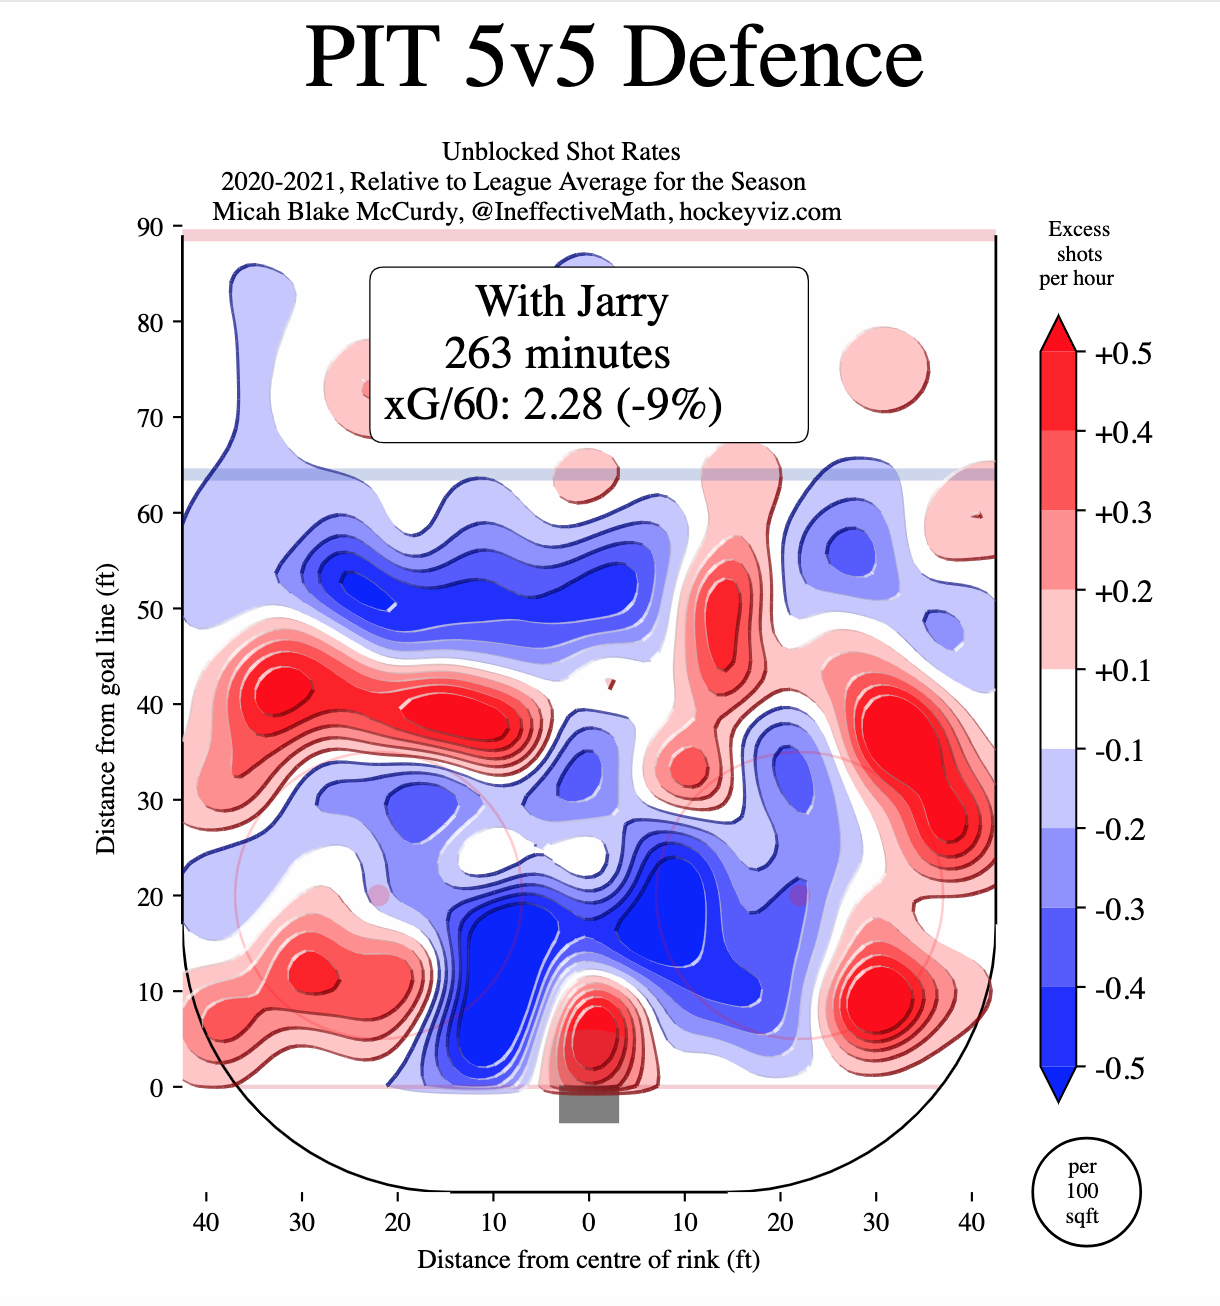
Via Hockey Viz - -7.31 – Tristan Jarry’s Goals Saved Above Expectation in all situations. While the Penguins could be better in the low slot, you could also say that their goaltenders could be better as well. Of all 65 goaltenders that have seen action this season, only 2 have a worse GSAx than Jarry. Goals Saved Above Expectation, via Evolving Hockey, is the difference between the expected goals against and actual goals against. For Jarry, his 13.69 total expected goals against in all situations is the 22th most out of that same pool of 65 goaltenders, but he’s given up 21 goals across 321+ minutes of play. His workload in terms of the unblocked shots he’s facing at 5v5 aren’t too terribly dissimilar from that of the Penguins overall defense at 5-on-5, seeing more than the league average from immediately in front of him (red) and less than the league average as you move further out from the low slot (blue), but the saves simply haven’t been there for Jarry this season, stopping just 85.9% of the shots he’s faced.

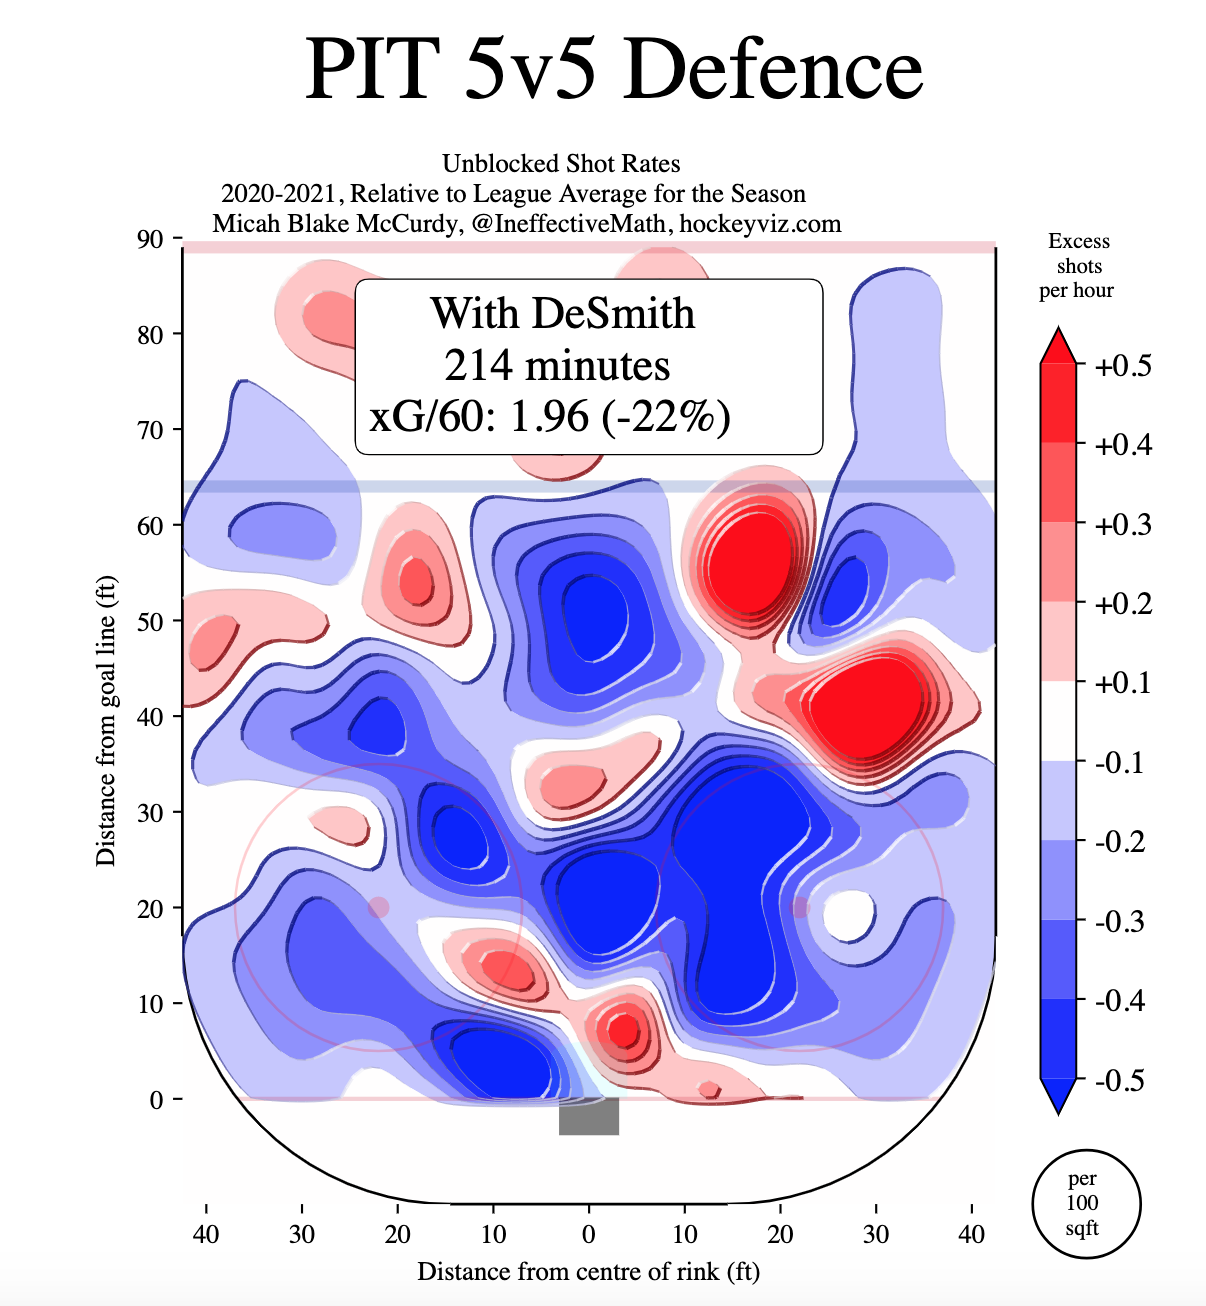
Via Hockey Viz - -2.3 – Casey DeSmith’s Goals Saved Above Expectation in all situations. In that same pool of 65 goalies, DeSmith ranks 43rd in his 5 games and 294+ minutes of play. The Penguins have been a little bit tighter in front DeSmith, giving up 11.7 expected goals, 31st most. This holds true at 5v5, where the Penguins are allowing just 1.96 expected goals against per hour, down 22% from league average, with DeSmith in the cage. There is a substantial amount of deep blue here, signaling that the Penguins are giving up fewer unblocked shot attempts than the league average, and very little red (more than the league average). DeSmith has been fine, anecdotally “keeping them in games” (though posting an underwhelming .882 SV%), and largely has been better than Jarry has, but you have to say the Penguins have been much better in front of him too.

Via Hockey Viz - 1.1 – Pierre-Olivier Joseph’s cumulative Goals Above Replacement. We’re still very early into the kid’s career, just 6 games and 108+ minutes of ice time, but his 1.1 Goals Above Replacement is the 2nd best on the team among defensemen behind Letang’s 1.3. Adjusting for ice time, his 0.603 GAR/60 is tops on the team. No Pens defenseman has a higher Even Strength Offense per hour than his 0.387 or Total Offense per hour than his 0.307. On top of that, in his nearly 95 minutes of 5v5 ice time, the Penguins are controlling 50.56% of the expected goals, 53.01% of the shot attempts, and a whopping 80% of the actual goals scored, outscoring their opponents 4-1 with him on the ice at 5s. No defenseman has seen a higher rate of shot attempts directed at the opponent’s net than his 55.86 shot attempts, 46.34 unblocked attempts, and 34.91 shots on goal per hour of 5v5 play than him as well. The sample size is small, but so far, he’s been a revelation.
Add The Sports Daily to your Google News Feed!