A lot can happen in six months, which is why we try to not jump to conclusions about MLB player and team results with just one month in the books. That doesn’t mean we shouldn’t take a good look at what transpired on the diamond, though.
After spotlighting the best hitters and starting pitchers from April, we’re doing the same for those guys on the opposite end of the spectrum. Once again, we’re going to rank hitter performances by wRC+, while Skill-Interactive ERA (SIERA) will be used for the starting pitchers.
It’s safe to say that these 10 players wish they could get a mulligan and start the season over.
April’s Five Worst Starting Pitchers
It seems like pitchers are always evaluated by the same traditional metrics, like win-loss record, ERA, WHIP, strikeouts per nine innings and walks allowed per nine innings. This is exactly why we’re going against the grain and evaluating pitcher performance by SIERA.
SIERA attempts to measure the underlying skill of a hurler, but unlike FIP and xFIP, it doesn’t ignore balls put in play, and also attempts to give a more accurate picture as to why certain pitchers are better than others. A good SIERA is just like a good ERA — the lower the better.
Here are the five hurlers who struggled the most in April.
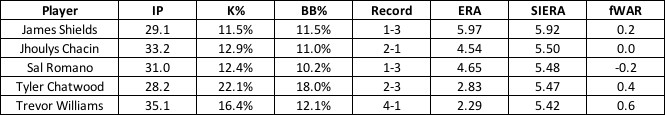
Does it surprise anyone that James Shields finds his way to the top (read: bottom) of this list? There are still five months left to change course, but he’s currently on track to post an ERA north of 5.00 and a SIERA above 4.90 for the third consecutive year. His walk rate is also on pace to be the worst of his career, as is his strikeout rate.
Jhoulys Chacin‘s 2017 was unique because he was basically unhittable at home and the furthest thing from it on the road for the San Diego Padres. He’s now with the Milwaukee Brewers, but it’s more of the same story. While the right-hander has produced a 2.31 ERA and .298 wOBA allowed in 11.2 innings at Miller Park, those numbers worsen to 5.73 and .383, respectively, in 21.2 road innings.
If there’s one thing that stands out about Sal Romano‘s April, it’s that he’s giving up a ton of contact. After producing a 19.0% strikeout rate in 87 innings as a rookie last year, that number has dropped to 12.4% through 31 frames. Opposing hitters are swinging and missing at just 4.5% of his pitches, and their contact rate is up at 89.2% (80.0% in ’17).
Ranking pitchers by SIERA is interesting because we actually highlight guys with low ERAs, like Tyler Chatwood. On the surface, he’s off to a good start, but there are a few troubling statistics upon looking deeper. After two years of owning a walk rate above 10.0%, that number has climbed to 18.0% in April. He only had a 2.83 ERA because of a .264 BABIP and 81.3% strand rate.
Trevor Williams‘ soft-hit rate (26.0%) was nearly as high as his hard-hit rate (27.0%), but his 35.1% ground-ball rate was drastically lower than it’s been in the past (45.5% in ’16, 48.0% in ’17). He’s been especially stingy on the road — in 18 innings, he owns a 1.50 ERA despite a 19.7% strikeout rate and 16.7% walk rate. Williams accomplished this because of a very high 89.0% strand rate and a very low .098 BABIP allowed.
April’s Five Worst Hitters
With wRC+ as our measuring stick, these five hitters have separated themselves from the pack in the worst way possible (we’ve included a few other statistics for good measure).
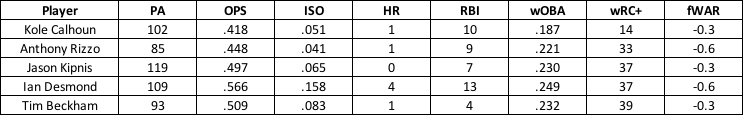
Kole Calhoun‘s 39.1% hard-hit rate would’ve been a career-high mark if the season ended once the calendar flipped to May. Unfortunately, that number was also accompanied by a 56.5% ground-ball rate and 24.6% fly-ball rate. He’s struggled everywhere, but especially at home — the outfielder didn’t record an extra-base hit in 51 plate appearances, which led to an unsightly -22 wRC+.
Anthony Rizzo‘s April batted-ball profile looked eerily similar to what he did in 2017. While his hard-hit rate was down a few percentage points, his soft-hit rate improved by a greater margin. Even for someone that’s had a somewhat low BABIP throughout his career (.287 entering this year), his .172 mark from April is bound to improve. Manager Joe Maddon knew just the trick to get him going, too — bat him leadoff.
There’s a level of tough luck that goes into slow starts like these, but Jason Kipnis really felt it over the past month. He couldn’t get a ball over the fence despite a 44.7% fly-ball rate and 38.5% hard-hit rate. Even with a 38.2% hard-hit rate on fly balls, Kipnis only managed to produce a 74 wRC+ and .206 ISO on this batted-ball event.
Baseball is a funny game, and Ian Desmond‘s April performance is just another reminder. He easily led the league with a 73.3% ground-ball rate, yet managed to hit more homers than the rest of this group combined. Baseball, man.
Tim Beckham took a huge step forward upon getting traded to the Baltimore Orioles last summer, but those good vibes haven’t yet resurfaced in 2018. A big problem he’ll need to solve once he returns from the disabled list is capitalizing on four-seamers. After posting a 182 wRC+ and .311 ISO against that pitch last year, those numbers have dipped down to 39 and .042, respectively, so far this season.
![]() About Matt Musico
About Matt Musico
Matt Musico currently manages Chin Music Baseball and contributes to The Sports Daily. His past work has been featured at numberFire, Yahoo! Sports and Bleacher Report. He’s also written a book about how to become a sports blogger. You can sign up for his email newsletter here.
Add The Sports Daily to your Google News Feed!