Though the Denver Nuggets are only on pace to win 34 games this season, they’re very much in the playoff race for the 8th seed in the Western Conference, as the Sacramento Kings (15-20), who are currently ranked 8th, have just a one game lead over the Nuggets (14-21).
Through the 35 games, the Nuggets have the 11th most efficient offense in the league, as they’re scoring 106.1 points per 100 possessions. The Nuggets are a team that play with an up-tempo style, as they average 100.54 possessions per 48 minutes, ranked 5th highest.
For all their strengths on the offensive end, a big part of why the Nuggets currently have a losing record is because of their difficulty in stopping teams on the other end of the floor. The Nuggets have the 28th ranked defense, as team’s are scoring 109.6 PP/100 on Denver each night.
Using the Four Factors metrics from NBA.com/stats, I’ve displayed the numbers and where the Nuggets rank on offense and defense in those categories. On a few of the factors, I provided a few more metrics that show why the Nuggets struggle in certain categories. For a full explanation of what each factor means, there’s a glossary at the bottom of the article.
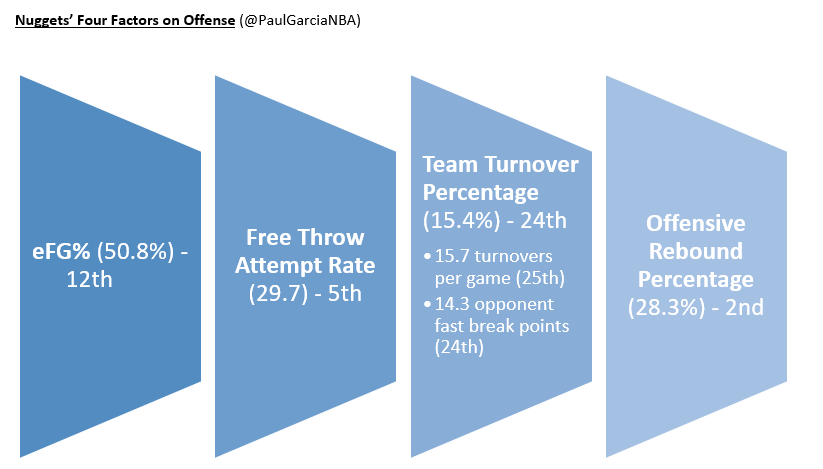
- There are eight Nugget players who have played over 400 minutes this season and are averaging over 1.0 threes per game. Of those eight players, four of them are shooting over league average from 3-point range (Danilo Gallinari 38.4%, Will Barton 38.3%, Gary Harris 39.2%, Jameer Nelson 36.8%). The other four players who attempt threes but are below average 3-point shooters are Wilson Chandler, Jamal Murray, Emmanuel Mudiay and Nikola Jokic.
- Another strength of the Nuggets on offense is drawing contact from all different positions, as eight Nuggets players (Gallinari, Barton, Faried, Mudiay, Harris, Jokic, Chandler and Jusuf Nurkic) all average over 2.0 free throws per game.
- The trio of Faried, Nurkic and Jokic combined grab an average of 9.7 offensive rebounds per game, resulting in getting Denver extra possessions on the offensive end.
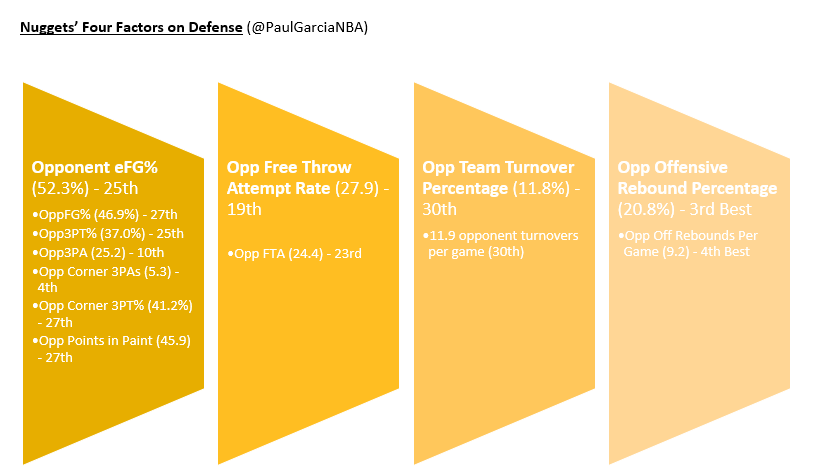
- In playing with a fast pace on offense, the Nuggets’ defense becomes more susceptible to allowing easier looks for opponents on the other end of the floor. When watching film of the Nuggets, it looks like defensively they don’t apply a lot of pressure on opposing teams in the half court, and the fact that they’re last in the league in forcing opponents into turnovers shows that teams can pretty much run their sets against the Nuggets to get quality looks on most possessions. As gifted a passer and scorer as Jokic is at the center position on offense, in today’s NBA, where there’s more small ball lineups or versatile big men, Jokic has trouble defending pick-and-rolls, as well as solid pick-and-pop shooters.
- In giving up quality looks to opponents, the Nuggets also put more pressure on their defense by racking up fouls as a team.
- When it comes to defensive rebounds, Chandler, Jokic, Faried Gallinari and Nurkic gobble up a combined 19.9 defensive boards per game. This is at least one of the strengths of the Nuggets, not allowing many second chances to teams. So it really comes down to the Nuggets making the initial stop by forcing teams into tough shots and not bailing them out with free throw attempts.
Glossary of Four Factors (per NBA.com/stats)
eFG% – Effective Field Goal Percentage. This statistic adjusts for value of a 3-point field goal relative to a 2-point field goal. ((FGM + (0.5 * 3PM)) / FGA
Free Throw Attempt Rate – Free Throws attempted relative to Field Goals Attempted by Player or Team.
Team Turnover Percentage – Percentage of team turnovers (not provided from NBA.com).
Offensive Rebound Percentage – Percentage of available offensive rebounds a player or team collects while on the floor.
Add The Sports Daily to your Google News Feed!