The Penguins and GMJR likely aren’t done wheeling and dealing this offseason following the acquisition of Dominik Kahun from Chicago in exchange for Olli Maatta.
One name that keeps popping up, aside from the obvious, has been Patric Hornqvist.
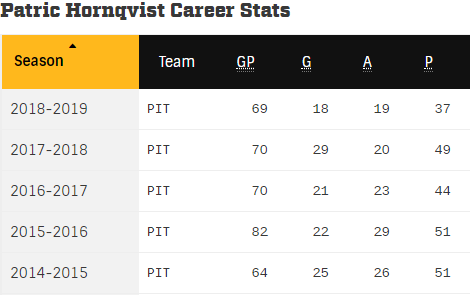
The logic behind this makes sense: he’s 32, at times looked like the rabid, physical game he’s played his entire career had caught up with him physically, was limited to 69 games where he registered just 18 goals and 37 points (both career lows in which he played more than 30 games in a season), and carries a $5.3M cap hit through 2022-23.
For a team that’s within $6.375M of the cap with Teddy Blueger, Zach Aston-Reese, and Marcus Pettersson still to sign and Jared McCann, Dominik Simon, Dominik Kahun, and Matt Murray all restricted free agents next summer, moving out $5.3M in the form of a “declining” player makes some sense.
But what if I told you that Patric Hornqvist, Corsica’s #26 ranked RW, isn’t actually quite at the full decline part of his career yet and has, in fact, been a model of consistency for the Penguins?
Obviously, the 37 points is a black mark on his record. In one more game played each of his previous two seasons, he registered 12 and 7 more points respectively. This season, he managed just 18 powerplay points this year, certainly impacting his overall total. The previous two seasons? Thirty-seven and 27 powerplay points.
That’s substantial enough to notice in his overall point production and largely the difference in drop off from his 2017-18 season to last season.
Simply put: the Penguins had their 56 PPG this season come from elsewhere other than the stick (and body) of Hornqvist, where as they did not as much in 2017-18 (68 goals) and 2016-17 (60 goals).
https://twitter.com/G_Off817/status/1113950240414097409
But what about at 5-on-5?
As it turns out, this past season’s raw count fell right in line with his previous two injury-shortened seasons (as did his goal output).

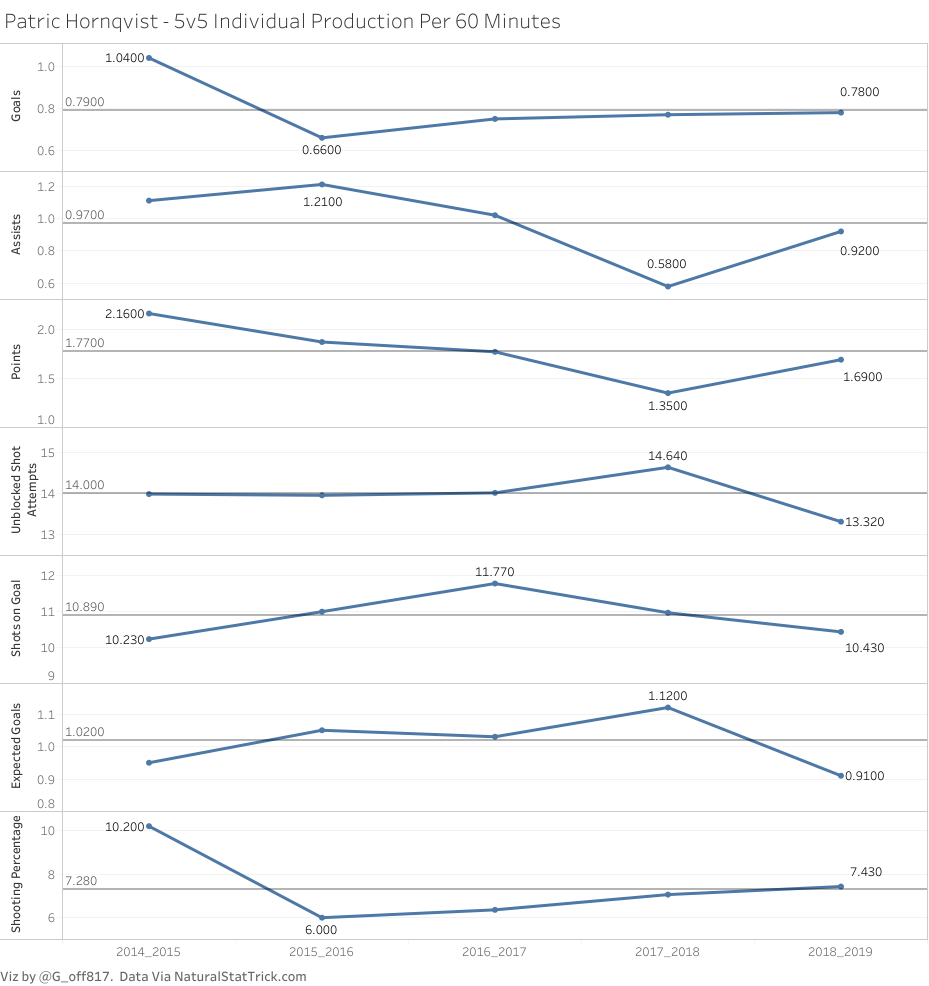
And when you look at his individual production per hour of 5v5 play, you really get the sense of how consistent Hornqvist has been since joining the Penguins.
This is a guy who, at 5-on-5, doesn’t seem to drift too far from his career average as a Penguin (reference line in each graph). This season was no different as he produced his 2nd most goals per hour since joining the Penguins, just 0.01 fewer per hour than his 5-year average.
And, though every category here aside from shooting percentage was slightly below his 5-year average, across the board we’re looking at less than half of a single event per hour fewer than his Penguins average.
Considering where his shots and goals typically come from, it should come as no surprise that he remains this consistent, including in his shooting percentage.
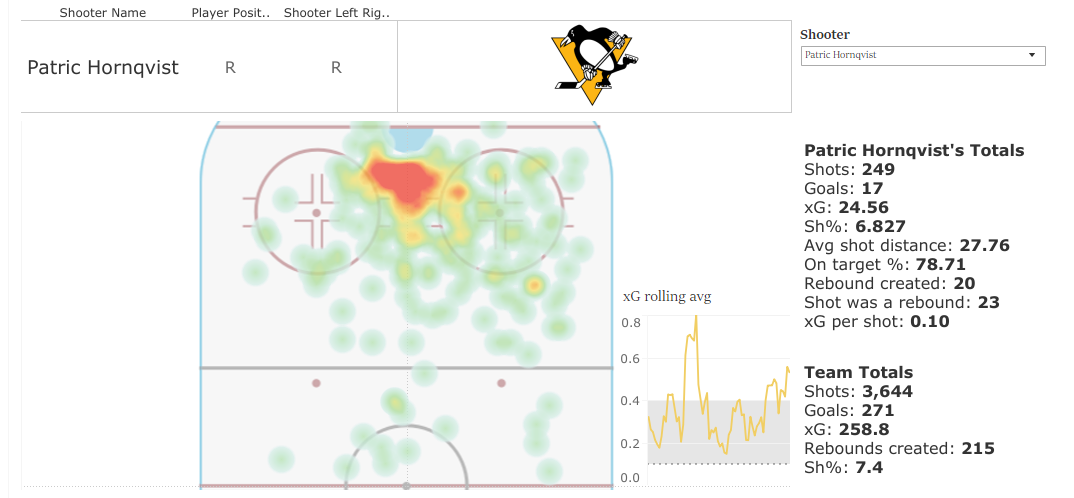
Perhaps more impressively, though, is his ability to help drive play when he’s on the ice, both this year and over the last 3 years.


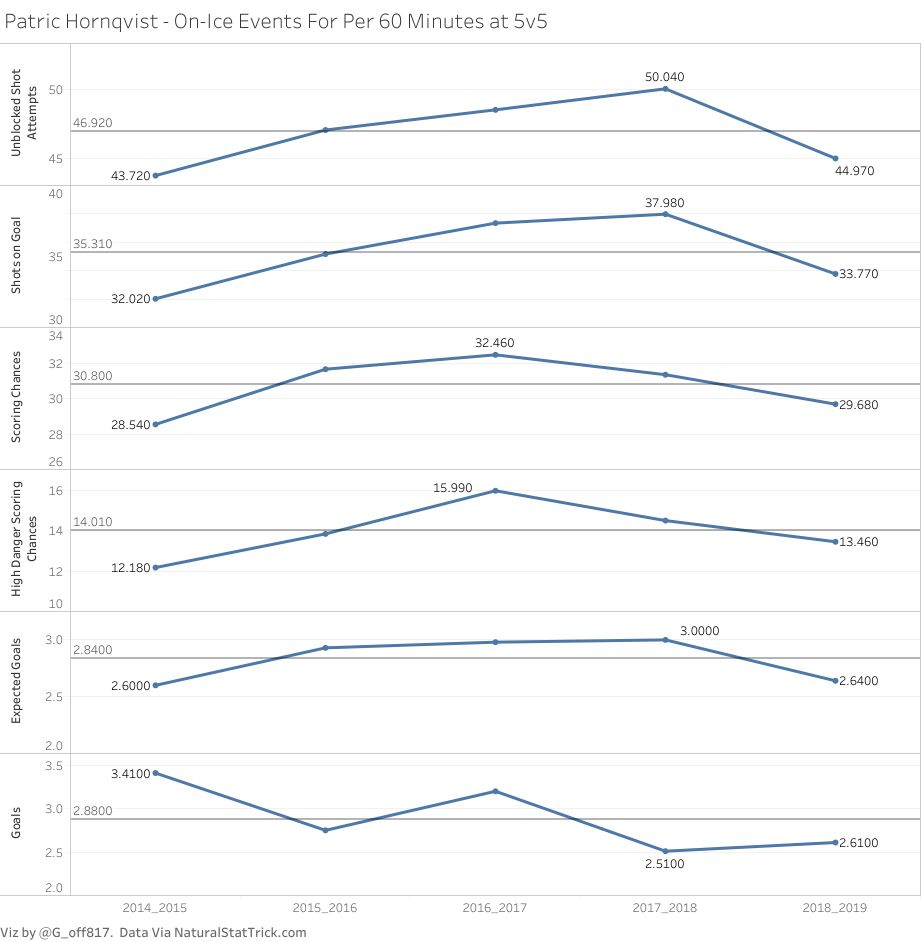
Tracking that over the course of his Penguin career, we get this:
Again, you’ll see a slight drop this season compared to his career average, but we’re talking anywhere between 1-2 fewer of each compared to that of his Penguins average.
Put another way for example, the Penguins generated 2 fewer unblocked shot attempts at 5v5 every 4-5 games with Hornqvist on the ice this season compared to the standard he’s set with the Penguins.
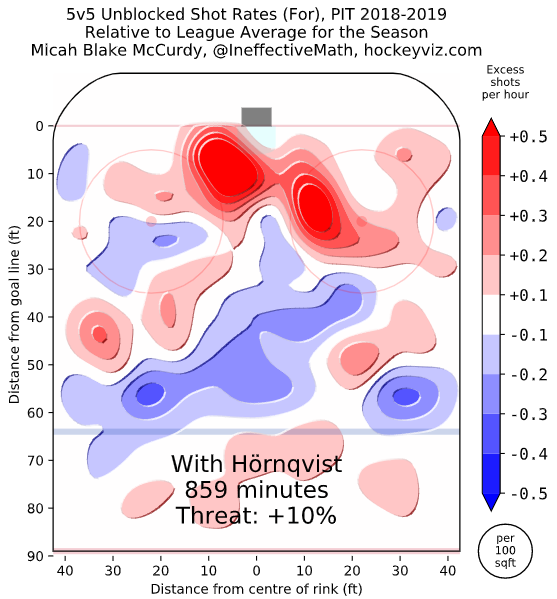
However, via HockeyViz.com, that slight drop actually didn’t matter relative to the rest of the league.
In fact, relative to the league, the Penguins lived in front of the opposing teams’ nets when Hornqvist was on the ice, generating a large excess in unblocked shots per hour of 5-on-5 play. That came out to them being a +10% offensive Threat with him on the ice.
In other words, the rate of these shots and the level of danger they posed was greater when Hornqvist was on the ice for the Penguins.
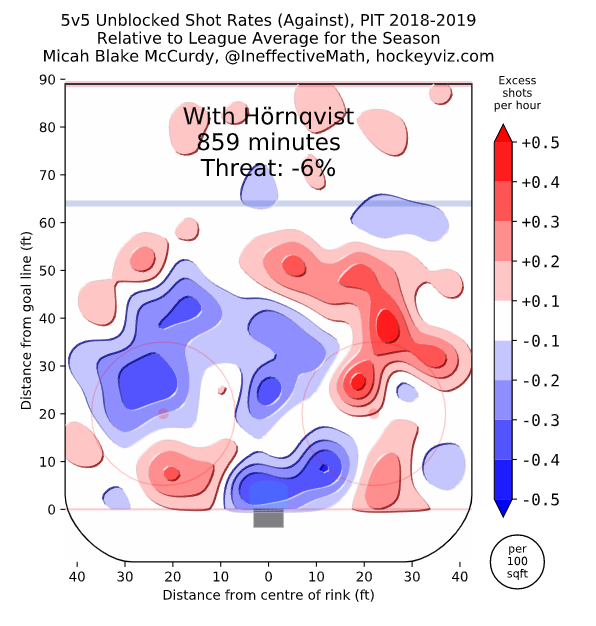
Defensively, that slight below-his-average trend existed this season too. As we see below, aside from high danger chances against and actual goals against, Hornqvist was on the ice for more events against than his 5-year average.
But that, again, didn’t translate relative to the league average, where the Penguins gave up very little in the middle of the ice with Hornqvist on the ice, seen by the blue below.
To that end, teams were a -6% Threat to do damage to the Penguins with Hornqvist on the ice this season. That wasn’t his best result as a Penguin, but certainly falls well within the “good” realm.
Additionally, relative to the team at 5v5, the Penguins generated 1.43 more unblocked shot attempts with Hornqvist on the ice than with him off of it and allowed 2.68 fewer with him on the ice compared to when he was off of it per hour of play. The same can be said about every other data bucket, including High Danger Scoring Chances (1.68 more generated with him on the ice, 1.25 fewer allowed with him on it) and Expected Goals (0.17 more generated with him, 0.16 fewer against with him).
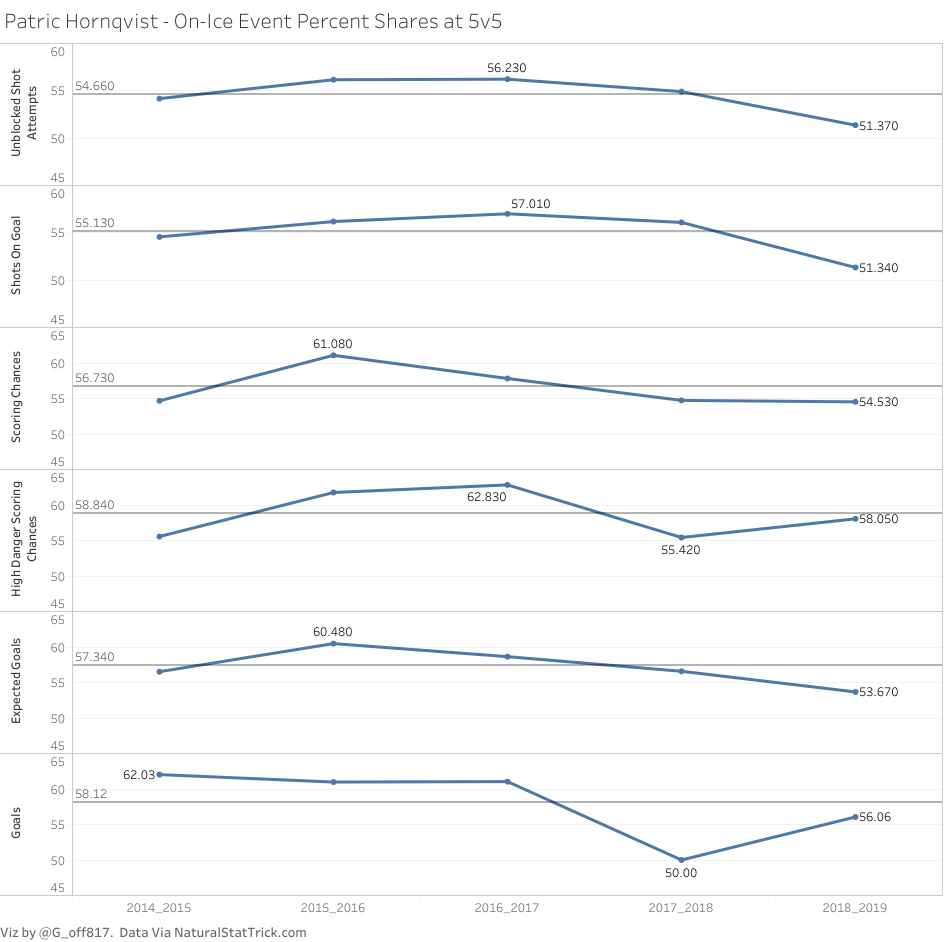
Importantly, though, is Hornqvist’s overall share of events that take place while he is on the ice.
Once again, we’re talking about a slight drop below his 5-year average, but we’re also talking about a player that has never been a sub-50% player in his time with the Penguins.
To put that into perspective: Neither Evgeni Malkin nor Phil Kessel can say they’ve never had a sub-50% season over the last 5 seasons.
Again, it’s important to consider his relative impact as well. Relative to the rest of the team, the Penguins controlled a +2.33 percent share of the unblocked attempts. +4.09 percent share of the scoring chances, +6.28 percent share of the high danger chances, and +3.31 percent share of the expected goals while Hornqvist was on the ice versus when he was off of it.
Put another way: the Penguins were a better team when Hornqvist was on the ice this past year than when he wasn’t.
It seems that, more than anything, it was his two concussions that derailed what was otherwise a decently productive year.
And consider this: Hornqvist’s 0.78 goals per 60 minutes of 5v5 play was exactly the same as that of Claude Giroux, William Karlsson, and Reilly Smith, all of whom either make more than him (Giroux), will likely make more than him this summer (Karlsson), or are in the same AAV ball park (Smith – $5M AAV). It was also 0.01 fewer than Mitch Marner and Mats Zuccarello and 0.01 more than Ryan Nugent-Hopkins and Anze Kopitar.
His 1.69 total points per 60 minutes of 5v5 play ranked ahead of Anders Lee (1.67), Kyle Palmieri (1.66), Anze Kopitar (1.55), Mike Hoffman (1.54) and just behind Jaden Schwartz (1.77) and Ryan Nugent-Hopkins (1.75).
These are all quality players that Hornqvist finds himself surrounded by, all of whom are right in the same cap hit range as him.
All that being said, there’s still the concern about his long term health and where he fits with the Penguins. Maybe he’s not the right fit when he’s not playing with Sidney Crosby and maybe it makes sense to capitalize and move on from him while he’s still productive to get a useful, younger piece back.
Because Father Time catches up with us all and Patric Hornqvist, with his style of play, will surely be no different.
But at 32 (soon to be 33), it seems that he still has something to offer the Penguins in the coming seasons.
Add The Sports Daily to your Google News Feed!
