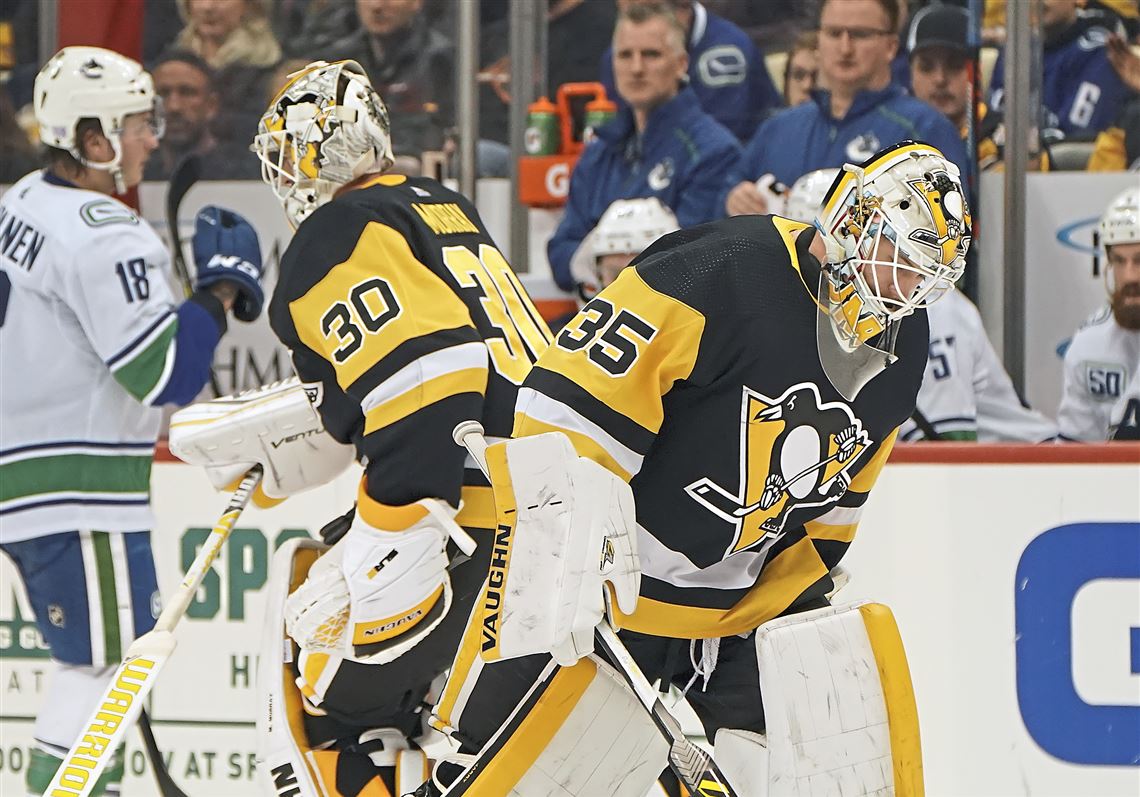
And now, for the final installment of our 3 part series looking at the Penguins roster heading into the Covid Cup Playoffs, we’re here to talk about everyone’s favorite whipping boys: the goaltenders.
[Part 1, detailing the forward lines can be found here, while Part 2, detailing the defense pairings, can be found here.]In one corner, we have a 26 year old goaltender that won two Stanley Cups before his rookie eligibility expired, who has a 28-19 postseason record and a career .921 SV% in those games, but has had two straight rocky seasons, even in spite of finishing the 2018-19 regular season from December onward as one of the best goalies in hockey and showing signs of life in the back 9 of this season.
In the other corner, we have a largely untested 25 year old goaltender that has started a total of just 10 more regular season games across the last 4 seasons (57) than the other goalie has started total postseason games (47). In his regular season career, he’s recorded a .914 save percentage and in 33 games this year, a .921 SV%, an overall showing that had him among the best goalies in hockey over the course of the season. He also participated in an NHL All Star Game, an effectively meaningless credential.
On the surface, it’s easy to make the case that the goalie with a 2019-20 save percentage of .921 should man the crease come Saturday’s playoff opener over the guy that saved just 89.9% of the shots he faced.
And yet, by all accounts, it would appear that it’s the guy with 2 Cup rings that will get the start in Toronto.
Let’s examine why that may be.
Over the course of this season, there was very little to differentiate between how the Penguins played in front of each of their two netminders, a stark difference versus how they played in front of Murray pre- and post-injury a season ago.
In fact, utilizing HockeyViz.com’s Environment Distiller, we can see just how similar the team defense was in front of each.

A reminder that when looking at these maps, red indicates more shots compared to the league average, while blue reflects fewer. In other words, red in the defensive zone means the Penguins are allowing more shots from those locations compared to the league average (bad), while blue in the defensive zone means they are allowing fewer shots than the league average from those locations (good).
So, ideally, for the Penguins skaters to be doing their job, we want to see more blue in the defensive zone, preferably in and around the goal. With Jarry in net, you see a slightly deeper blue in and around the net front compared to that of Murray, suggesting the Penguins are a little bit tighter in those areas with Jarry in net. However, there is a slight red blip in the mid-slot with Jarry, meaning the Penguins are allowing more from that area of the ice compared to the league average and, in this case, compared to when Murray is in goal.
The other differences in play show up in the high slot/low point (Jarry) and the top of the right circle (Murray) where the Penguins are giving up shots.
Altogether at 5-on-5, the Penguins are allowing 2.31 expected goals against per hour of play (down 10% from the league average) with Murray versus 2.36 per 60 minutes (down 8% from league average) with Jarry.
So there’s really not much there.
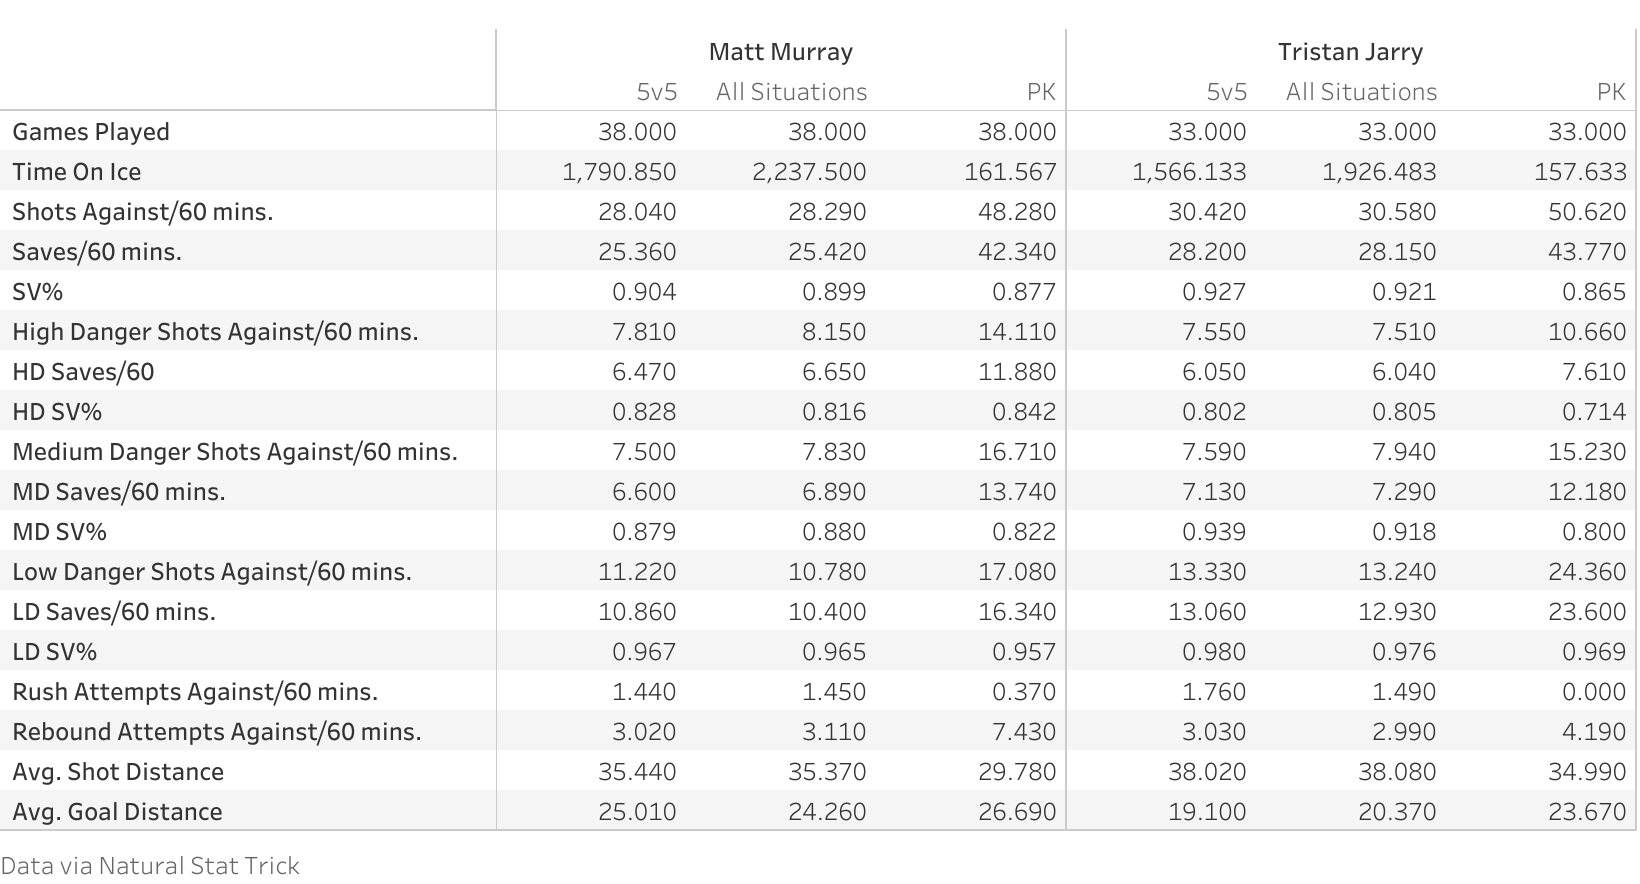
Breaking it down even further, we can really get a sense of where the differences between the two netminders are.
For reference here, league average SV% at 5-on-5 this season was .920 and .910 in all situations. In both cases, Jarry found himself above the average, while Murray found himself below.
But looking over this, you’ll see that at 5v5, on the PK, and in all situations, Matt Murray faced more high danger shots against and was actually the better the goaltender in dealing with those (a good sign).
Tristan Jarry was better in dealing with the low danger in a similar sense, of which he faced more per hour of play than Murray. This is also a good sign. You want your goalie to make the saves he’s supposed to make.
But the real difference was in the medium danger shots each goalie faced.
By and large, both goaltenders faced a similar rate of those medium danger shots as one another (save for on the penalty kill) and at 5v5 and all situations, it was Jarry handling them the best.
And it wasn’t even close.
At 5v5 and all situations, Murray only managed to stop about 88% of those medium danger shots he faced, down from the 90.8% in his career at 5v5 prior to this season. Conversely, Jarry made saves on 93.9% and 91.8% of the time respectively. That’s a pretty wild swing.
Now, you’re probably thinking, “holy shit, why on earth would the Penguins choose to go to Murray on Saturday?”
It’s a question that seemingly has no answer. Or, at least no answer that satisfies everyone’s opinion in this conversation.
But despite Jarry’s numbers being mostly better than Murray’s over the course of the season, Mike Sullivan (by almost every account) seems set on giving Murray the nod in Game 1.
Maybe it’s because Sullivan knows Murray and knows what he’s capable of.
Maybe it’s that Murray has earned the right to lose the job based on the last 5 seasons.
Maybe it’s trust (you’ll recall that it was Murray getting the call against Washington, Boston, Tampa and Toronto from January-March).
Maybe it’s the known playoff experience or maybe it’s the Cup rings.
Or maybe it’s because Murray was trending in a better direction before shutdown.
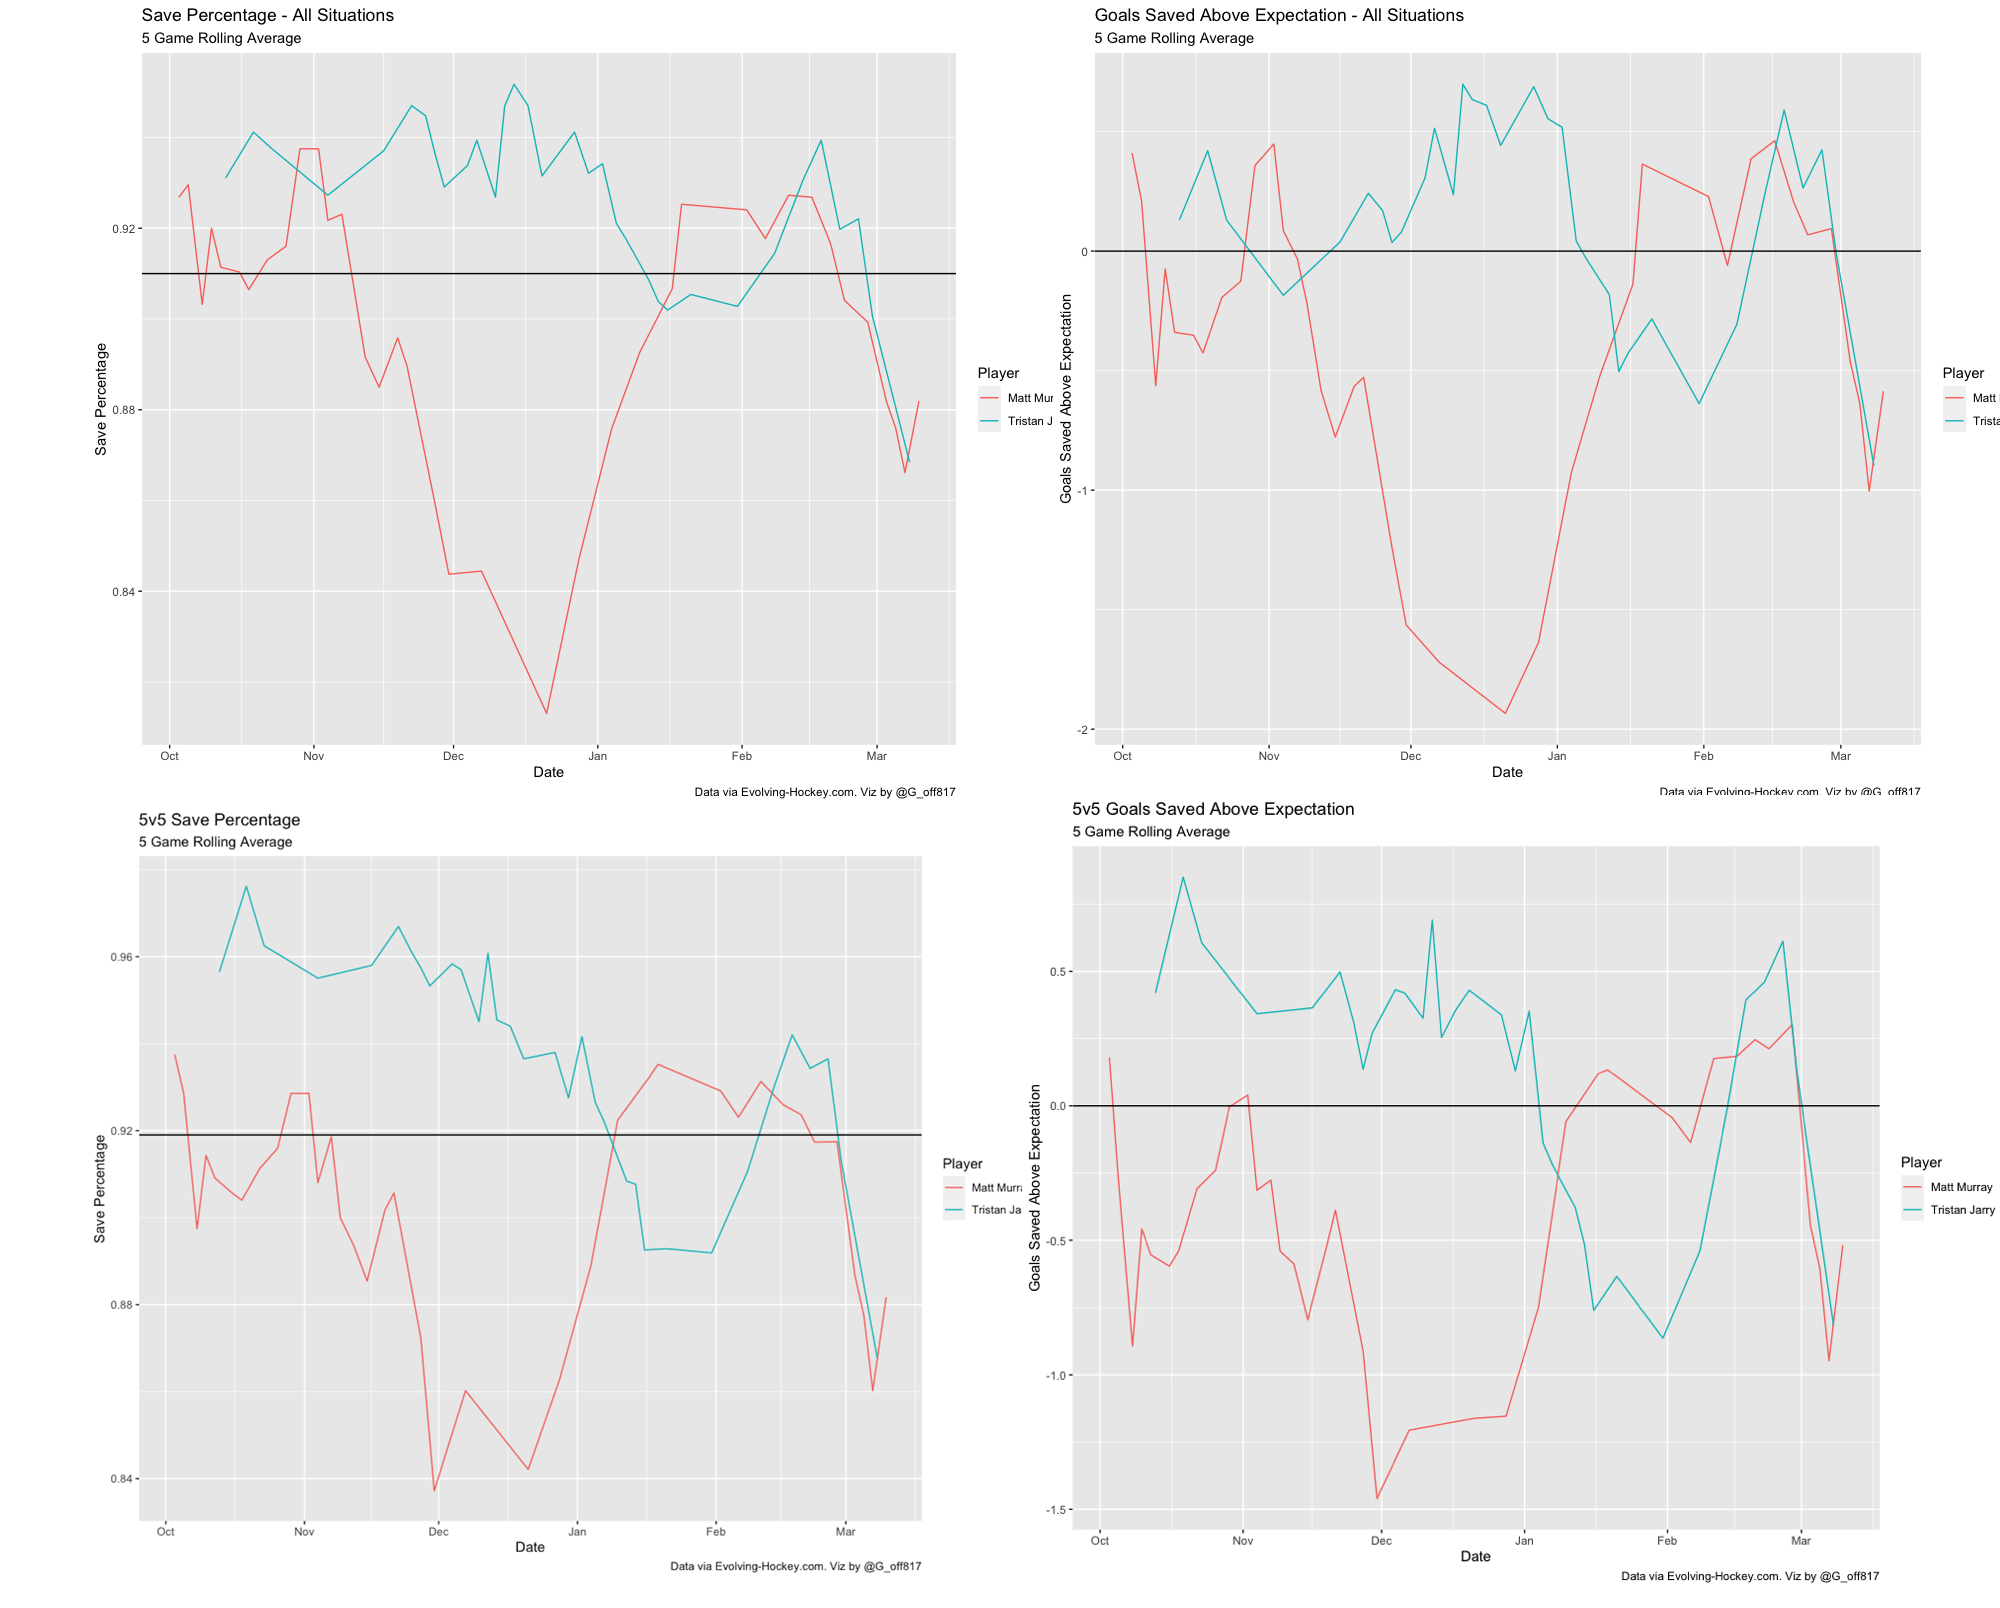
Above, you’ll see four 5 game rolling average over time graphs in all situations (top) and 5v5 (bottom) illustrating their rolling averages of save percentage (left) and goals saved above expectation, which is just the difference between the expected goals against and actual goals against.
The numbers may be different, but the story of all 4 graphs is the same.
And as it turns out, Jarry’s league-wide 8th best .921 SV% and his All Star Game appearance can be a bit misleading.
Take nothing away from Jarry- he was brilliant for large parts of this season. He helped keep the Penguins afloat when they seemed destined to give up control of their own end of the ice.
But since mid-to-late October, he was also on the decline.
Now, his drop off wasn’t nearly as severe as Murray’s month of November, but by the time the calendar turned to 2020, these two netminders were on very different trajectories as Murray jumped above average and expectation (in the more important games) and Jarry dipped below average and expectation.
Jarry did, however, start turning it around and we’d be remiss if we didn’t mention that.
We’d also be remiss if we didn’t point out that after both had great, dueling, hot starts to February, by the middle of the month they both cratered. Murray looked like he was potentially turning the corner just before lockdown, which is evident by that sharp uptick at the tail end of his lines.
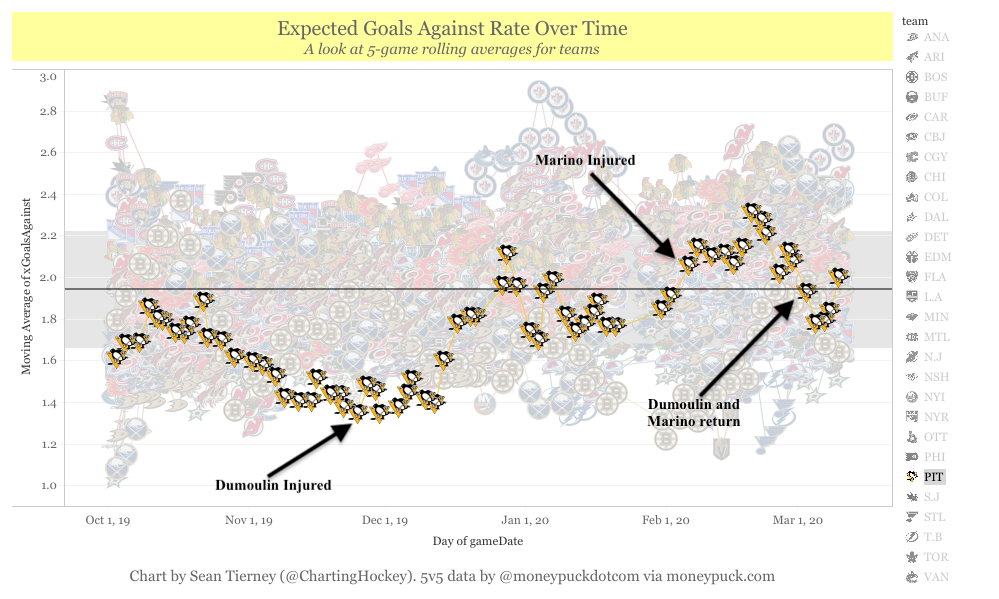
Oddly enough, there’s a case to be made that Jarry’s performances over time reflect and follow more along with how the team was performing defensively at the time, while Murray was quite the opposite: performing poorly when the team was rock solid in front of him and stonewalling teams when the Penguins were porous in their own end.
There’s no telling what having nearly 5 months off from game action is going to do when they have to hit the ground running on Saturday. It’s entirely possible that the whole goalie discussion is meaningless.
But there’s little doubt in my mind that with the depth and balance of forwards the Penguins are employing this postseason and the fully healthy crop of defensemen in front, the Penguins and Mike Sullivan will do a great job at making their goaltenders’ lives easier and mitigating that defensive zone porosity we saw throughout the latter stages of the season.
Even then, they’ll still want the best possible version of Matt Murray (or Tristan Jarry) to show up and stop the puck, no matter how long or short the leash is.
And if either one replicates what we’ve seen that they’re capable of, we’re all in for a treat.
Add The Sports Daily to your Google News Feed!


