“Hockey is a game of one-one-one battles.”―Mark Messier
What Is Penalty Plus-Minus?
One of the most overrated hockey stats is plus-minus. Penalty plus-minus, however, is an underrated stat. Penalty plus-minus is calculated by subtracting the total number of penalties a player has taken from the total number of penalties he has drawn. Only penalties drawn and taken at even strength are counted. Also, penalty plus-minus doesn’t count coincidental penalties or misconduct penalties that don’t result in power plays.
In 2013-14, Nazem Kadri (for the second year in a row) led the NHL in penalties drawn with 37. Kadri also took 14 penalties, so his penalty plus-minus was +23. (Edit: After I had completed this post I noticed that Matt Duchene also was +23.) The player with the NHL’s worst penalty plus-minus was Chris Neil with a -24. (The numbers for penalties drawn and taken are taken from Behind the Net.)
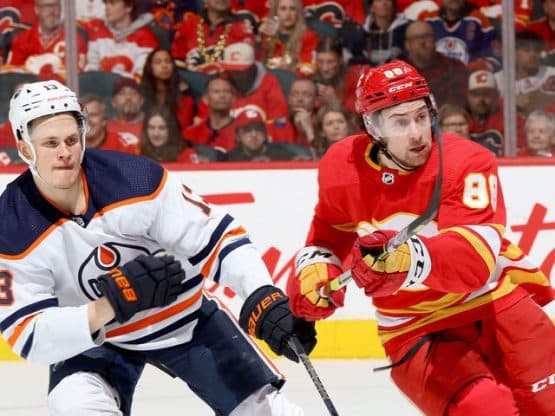
As I see it, three types of players are good at drawing penalties. First, there is the “embellisher” (e.g., Dustin Brown) who dives and feigns injuries. Second, there is the “agitator” (e.g., Corey Perry) who goads players into taking penalties simply by being annoying. Third, there is the “offensive star” (e.g., Claude Giroux) who draws hooking and holding penalties. The reason why Kadri is so good at drawing penalties is because he’s an embellisher and an agitator with offensive skill.
Why Is Penalty Plus-Minus Important?
One writer who has done quite a bit of work on penalty plus-minus is Daniel Wagner of Pass It to Bulis. Here’s what he had to say about the importance of penalty plus-minus:
It’s fairly obvious how [penalty plus-minus] contributes to wins…. If a power play converts at around 20% (a little higher than the league average, but convenient as a round number), then a single power play opportunity is worth 0.2 goals. For every five power plays a player gets his team, he’s contributing 1 goal, all without necessarily recording a point.
The flipside to that is that every five penalties a player takes, he’s costing his team 1 goal as well. This is why penalty plus-minus is important, tracking how many power play opportunities a player gave his team compared to how many he gave the opposition.
In 2013-14, the Oilers’ power play percentage was 17.0% (21st in the league), and their penalty kill percentage was 82.1% (tied for 14th). These are the stats that fans and the media usually focus on. But a team’s power play minutes and penalty kill minutes are often neglected. The Oilers’ power play minus penalty kill time was -33.42 (23rd). Because the Oilers had a negative power play minus penalty kill time and because the opposition’s power play percentage was slightly higher than the Oilers’, the team gave up more power play goals (50) than they scored (46). Add to that a terrible even-strength goals-for percentage (41.6%), and there’s no mystery why the Oilers were so bad last season.
Penalty Plus-Minus in 2013-14
Below are the Oilers’ penalty plus-minus numbers for last season. Keep in mind that that defensemen (because of the nature of the position) typically take more penalties than forwards and therefore tend to have inferior penalty plus-minus numbers.
| Player | GP | Penalties Drawn | Penalties Taken | Penalties Drawn/60 Minutes | Penalties Taken/60 Minutes | Penalty Plus-Minus |
| Nail Yakupov |
63 |
17 | 7 | 1.4 | 0.6 |
+10 |
| Taylor Hall |
75 |
23 | 15 | 1.2 | 0.8 |
+8 |
| Jordan Eberle |
80 |
15 | 7 | 0.7 | 0.3 |
+8 |
| Anton Lander |
27 |
7 | 1 | 1.5 | 0.2 |
+6 |
| R. Nugent-Hopkins |
80 |
13 | 8 | 0.6 | 0.4 |
+5 |
| Mark Arcobello |
41 |
7 | 3 | 0.8 | 0.4 |
+4 |
| Oscar Klefbom |
17 |
3 | 0 | 0.7 | 0.0 |
+3 |
| Luke Gazdic |
67 |
7 | 5 | 1.1 | 0.8 |
+2 |
| Ryan Jones |
52 |
10 | 8 | 1.4 | 1.1 |
+2 |
| Justin Schultz |
74 |
8 | 7 | 0.4 | 0.3 |
+1 |
| Jesse Joensuu |
42 |
5 | 4 | 0.8 | 0.7 |
+1 |
| Tyler Pitlick |
10 |
1 | 0 | 0.7 | 0.0 |
+1 |
| Philip Larsen |
30 |
2 | 3 | 0.3 | 0.4 |
-1 |
| David Perron |
78 |
26 | 29 | 1.3 | 1.5 |
-3 |
| Martin Marincin |
44 |
1 | 4 | 0.1 | 0.3 |
-3 |
| Will Acton |
30 |
0 | 3 | 0.0 | 1.0 |
-3 |
| Anton Belov |
57 |
6 | 11 | 0.4 | 0.8 |
-5 |
| Boyd Gordon |
74 |
3 | 8 | 0.2 | 0.6 |
-5 |
| Jeff Petry |
80 |
10 | 16 | 0.4 | 0.7 |
-6 |
| Andrew Ference |
71 |
6 | 14 | 0.3 | 0.7 |
-8 |
| Ryan Smyth |
72 |
8 | 16 | 0.6 | 1.2 |
-8 |
| Mark Fraser |
42 |
3 | 12 | 0.3 | 1.3 |
-9 |
| Matt Hendricks |
77 |
9 | 19 | 0.7 | 1.5 |
-10 |
| Sam Gagner |
67 |
4 | 14 | 0.2 | 0.9 |
-10 |
What about the Oilers’ off-season additions? Their penalty plus-minus numbers are below.
| Player | GP | Penalties Drawn | Penalties Taken | Penalties Drawn/60 Minutes | Penalties Taken/60 Minutes | Penalty Plus-Minus |
| Teddy Purcell |
81 |
7 | 5 | 0.4 | 0.3 |
+2 |
| Benoit Pouliot |
80 |
14 | 13 | 0.9 | 0.9 |
+1 |
| Keith Aulie |
15 |
0 | 1 | 0.0 | 0.4 |
-1 |
| Nikita Nikitin |
66 |
2 | 7 | 0.1 | 0.4 |
-5 |
| Mark Fayne |
72 |
5 | 14 | 0.3 | 0.7 |
-9 |
What do the numbers above tell us? Here are a few observations:
- David Perron is extremely active in the penalties drawn/taken department. He led the Oilers in both penalties drawn (26) and penalties taken (29). That’s a combined 55 penalties drawn and taken, by far the most on the team. The next highest was Taylor Hall with 38.
- When you compare Perron’s numbers with the rest of the NHL, he was tied for 12th in penalties drawn and tied for 5th in penalties taken. Hall was 17th in the NHL in penalties drawn.
- Somewhat surprisingly, Nail Yakupov led the Oilers in penalty plus-minus with +10. In his rookie year, Yakupov was -1, so this was one of the few areas in which he improved.
- Another surprise was that Anton Lander led the Oilers in penalties drawn per 60 minutes with 1.5 (albeit in only 27 games).
- Matt Hendricks and David Perron were tied for last in penalties drawn per 60 minutes. Of course, Hendricks started the season with Nashville, so it’s hard to know if that number was better or worse with Edmonton.
- One promising sign for the coming year is that three out of the four worst Oilers at penalty plus-minus in 2013-14 (Smyth, Fraser, Gagner) are no longer with the team.
- It would have been helpful to know the zone in which players took penalties. I’ve heard many people say that Pouliot has a bad habit of taking offensive zone penalties, but I’m not aware of an easy way to find out if that’s true or not.
- The Oilers will have to allow fewer short handed goals this season. Drawing penalties isn’t such a great thing when you give up 13 short handed goals.
[adsanity_group num_ads=1 num_columns=1 group_ids=1432 /]
Add The Sports Daily to your Google News Feed!


