This is the second of a four part series on Nail Yakupov’s career. This part covers his rookie season under Ralph Krueger. His pre-draft years and his KHL half-season is in Part 1, which also includes an introduction to the whole project. Part 3 is his years under Dallas Eakins and Todd Nelson. The final part is this last year under McLellan and a summary of all the findings.
Nail Yakupov has been an enigma. He has immense skill but hasn’t had tremendous success in Edmonton. He’s fascinating to me in just how polarizing he is. Many people whose opinion I respect fall on opposite sides of this debate. I, myself, am undecided on Yak. I’ve watched him grow and develop over the last four years. So, now that he’s gone, I decided to take on a larger project. I am digging deeper into Yakupov’s time in Edmonton to at least come to my own conclusion.
My intention is to be as thorough and comprehensive as possible to answer the question: Just Who Was Nail Yakupov in Edmonton?
Who Was Nail Yakupov… under Ralph Krueger
As 2012 turned into 2013, the NHL finally got its act together and we got half a season of hockey. The Oilers had a new head coach in Ralph Krueger, who had no training camp, but he did know the team as associate coach the previous season.
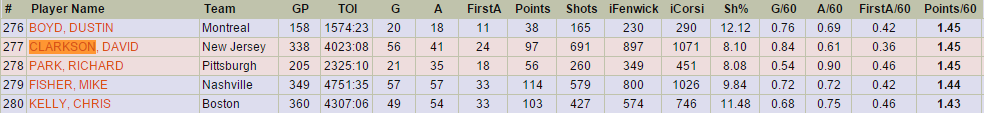
After a productive campaign in the KHL, Yakupov continued to produce points in the NHL. His 31 points in 48 games put him 91st in the league for points per game among forwards (tied with Patrick Marleau). That’s well above average 2nd line production. Impressive, given he averaged less than 15 minutes a game.
It wasn’t all powerplay points either. He was 3rd on the Oilers in even-strength points behind only Eberle and Hall. Given his low time on ice per game, he had a pretty high 2.14 points / 60 minutes of even-strength ice time. That was 53rd in the league among forwards (minimum 300 minutes), which is average 1st line production.
There is no doubt that Yakupov produced a high rate of offence in his rookie season. Impressive for a 19-year-old rookie!
Warning 1 – Shooting Percentage
There were, however, some warning signs that this production was not sustainable.
For one, Yakupov’s shooting percentage was unsustainably high in that rookie season. He shot 21% in all situations, which is ridiculous.
This had a massive impact on his point totals. Yakupov’s career shooting percentage is 9.6%. Had he shot his career shooting percentage in his rookie season, instead of scoring 17 goals, he would have scored 8 (actually 7.8, but I’ll give him credit and round up). That alone would have dropped his point totals from 31 to 22. Instead of 91st in the league in points per game, he’d be 177th (just behind Raffi Torres). That’s more like below average 2nd line or above average 3rd line production.
Now, that’s not bad, especially for a rookie playing on a poor team. It does, however, take some of the shine off his season.
Warning 2 – IPP
Another sign of unsustainability was Individual Point Percentage. IPP is simply the percentage of time a player gets a point when his line scores a goal. If this is a low number, you’re likely less involved in the goal scoring. If this is a high number, most plays are flowing through you. Like shooting percentage, this number is also highly volatile but tends to average out over time. Only a few elite players (like Sydney Crosby) tend to have a persistently high IPP. On average, forwards tend to hover around 68%.
Nail Yakupov’s IPP was 83.3% in his rookie year, which would turn out to be the highest of his Oiler career. Now, some of this IPP was his high shooting percentage, so I don’t want to double-count him here. However, IPP would also account for his assists. In that rookie season, Yakupov was getting a higher than normal number of points when his line scored. On one hand, that could be a good thing, but he was unable to sustain that in future years. As a result, his point totals in his rookie season were likely buoyed by this number.
Goal Share
Hockey really comes down to goals at the end of the day. So we can look at how many goals were scored while Yakupov was on the ice both for and against Edmonton.
Turns out, when Yakupov was on the ice, the Oilers scored 51.1% of the goals! Hey, that’s above 50%. Not bad! That’s good for 5th among forwards on the Oilers (tied with a sophomore Ryan Nugent-Hopkins).
Now, there’s some caveats to that… which we’ll get to next.
Shot Attempts
Despite the Oilers scoring 51.1% of the goals while Yakupov was on the ice, they only had 42.9% of the shot attempts. The ice was tilted towards the Oilers end and not by a little. Of course, the Oilers were also a bad team, so that’s not all on Nail. That number, though, was 10th of the 14 forwards who played at least half the season. His corsi-rel was -5.3%, meaning the Oilers did much better in terms of shot attempts when Yakupov was off the ice compared to when he was on the ice.
Now, just because Yakupov’s corsi was poor, doesn’t mean he was the one dragging the possession numbers down. We can do a WOWY analysis (With Or Without You) to see which players did better with Yak and which ones did better without.
There were 16 skaters who played at least 50 minutes with Yakupov in his rookie season. Eleven of them did better away from Yakupov and only five did worse. Of course, 50 minutes is a small sample size even within a season. There were 10 skaters who played at least 100 minutes with Yak. Eight of them did better away from Yak.
Expected Goals
One criticism of corsi is that it doesn’t take into account shot quality. Expected goals (xG) makes an attempt at doing that. It corrects for a variety of factors including shot distance, type, rebounds and rushes among others. It then comes to an “expected goals for” and “expected goals against” based on the quality of shots given up while a player is on the ice. Perhaps Yakupov was scoring better than his corsi numbers implied because he was creating more dangerous chances while giving up less dangerous ones.
In actual fact, his xG (calculated by Manny Elk from corsica.hockey) was 39.2%. Meaning, accounting for shot quality, when Yakupov was on the ice, the Oilers should have only scored 39% of the goals. That was ahead of only Smithson, Petrell, Belanger and Brown among forwards. Not good.
PDO
So how is that possible? How is that Yakupov should’ve only had 39% of the goals go in his favour while on the ice, but actually got 51%?
PDO is just shooting percentage + save percentage. This tends to regress to 100 for most players. Anything well above and well below is likely due to variance. Yakupov had a team leading PDO of 103.4 in his rookie season, buoyed heavily by shooting percentage. His expected PDO, based on shot quality, was 99.3. Nail Yakupov had the percentages going in his favour in this rookie year and it would not continue in any future season.
Usage
Yakupov averaged 12:04 even-strength ice time per game (7th among forwards). That puts him upper 3rd line territory. He also got 2:28 in powerplay time per game, which is 9th on the team and 7th among forwards. He was definitely a second-unit powerplay option overall through the season. Although I don’t have the exact numbers, Yakupov was being benched often during the third period in close games, implying he didn’t really have Krueger’s trust.
As far as zone starts go, Yakupov was not sheltered in his rookie season. Excluding shifts on the fly, he started 31.1% of his shifts in the offensive zone, 30.8% in the defensive zone and the rest in the neutral zone. That percentage of offensive zone starts is 5th on the team among forwards, neither sheltered nor buried.
Linemates and Competition
For this, I go to Micah McCurdy (@ineffectivemath). He has wonderful visualizations for every player in the league. The following is Yakupov’s Teammates and Quality of Competition in 2012/13.
Forwards and defencemen are ranked by time on ice in every game. On the left side of the graph is Yakupov’s teammates. The blue represents how often Yakupov was on the ice with the player of that ranking. The red is how often Yakupov himself ranked at that TOI. On the right is the competition Yakupov faced.
Basically what this chart says is that Yakupov mostly played with 2nd line forwards, despite getting 3rd line ice-time. This makes sense when we consider that Yak was often benched in close games in the 3rd. He would play 2nd line minutes in the first two periods and then sit. He also got less time with the top two defencemen and a little more time with the bottom pairing. Meanwhile, he played a little more against 2nd and 3rd line competition at the expense of 1st line opponents. Similarly, he played a bit less against the top opposing defencemen.
Yakupov’s most common centre by far was Sam Gagner, followed by Horcoff at a distant second. Yak’s most common winger was close to an even split between Paajarvi and Hemsky.
Yakupov got relatively little time with RNH or Hall, who spent most of the season with Eberle as a winger. When he did play with them, it was a disaster in a very small sample size, with corsi percentages in the sub-40% range.
Who he played best with is displayed in another Micah McCurdy graph.
Click on the graph to make it readable. This basically looks at all of Yakupov’s most common line combinations in his rookie season and plots them based on shots for and against. What I want you to take away from this is that Yakupov played best with Hemsky (and Gagner) and worst with Horcoff (and Paajarvi).
Powerplay
Yakupov produced 4.62 points / 60 minutes of powerplay time, which was 7th on the team and 5th among forwards. He had second team powerplay production, which is appropriate for his second team powerplay ice-time. In his favour, he actually led the team in shots/60 on the powerplay, teeing it up more than anyone else and managed a respectable 20.8% shooting percentage.
Zone Exits
Thankfully we have some tracking data from the 2012/13 season to add a little more information to our Yakupov puzzle. Bruce McCurdy tracked zone exits by all Oilers during the lockout shortened season. Yakupov gets a lot of flak from being a mess in his own zone. At least by this measure, though, he was not disastrous in terms of exiting compared to other wingers.
Yakupov got the puck out of the defensive zone with control 68% of the time, a number equal to Ales Hemsky. Among regular wingers, he trailed only Taylor Hall and Jordan Eberle (72%) each. He didn’t do it quite as frequently as one would like, though. He got it out with control 3.2 times per 15 minutes of gameplay. That number is behind Hall and Hemsky (over 4), as well as Eberle (3.6), Paajarvi (3.3) and tied with Smyth.
Still, Yakupov was in the range of the other offensive wingers and well clear of the grinders.
Zone Entries
Jon Willis tracked zone entries through the 2012/13 season but unfortunately I can’t find it online. If I do find it, I’ll update this section.
Rookie Year with Ralph Krueger – Summary
Krueger gets a lot of credit for Yakupov’s rookie shortened rookie season, which was notable for an excellent point production rate. However, it was a mirage of shooting percentage and IPP. If you strip away the unsustainability, Yakupov played 3rd line minutes, with 2nd line teammates, against 2nd & 3rd line opponents, and produced at about an average to above-average 3rd line rate. He wasn’t a complete possession black-hole, but he did seem to be a bit of a drag on his linemates. His expected goals was sub-40% and his PDO saved him from being absolutely torched in goals while he was on the ice.
Yakupov was reasonably effective on the powerplay. He was given 2nd powerplay minutes and produced at about that level compared to the rest of the Oilers, while maintaining a high shot rate. When transitioning the puck out of the zone, Yak managed be fairly average on the team, not excelling or lagging behind.
Summary So Far
Through the end of his rookie season, Yakupov had some positive signs. He had a track history of scoring through Junior, was the consensus #1 overall pick and scored at a decent clip in a half KHL season. In the NHL, his story was more of a mixed bag. Inflated scoring numbers hid some possession and weighted shot problems. With normalized IPP and shooting percentage, he produced at a 3rd line rate, with 3rd line minutes, 2nd line teammates, and against 3rd line competition. However, he didn’t completely drown in the NHL in his rookie season and he had a reasonable base to build on.
In the next part, we’ll go on to look at his time with Dallas Eakins and Todd Nelson.
Save
Save
Add The Sports Daily to your Google News Feed!


