There’s been a lot of talk recently that the Oilers’ have a yearning for some Mid-Western hospitality. The so-called Chicago Model is all the rage. What is it? What kind of roster construction does it rely upon? What are its antecedents? What are its current analogues? And, what might it look like if adopted fulsomely by the Oilers?
The Quote
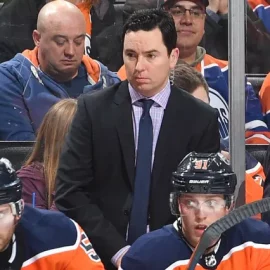
Just prior to the 2014 NHL entry draft and the July 1st Free Agent Frenzy, MacTavish laid out the plans for his off-season moves and gave fans some insight into his ideas about future roster construction:
We need some experience up front. We need some guys that can help round out our top three lines and that’s what we’re basically looking to do.”
MacTavish said the team will be looking to bring in the pieces to allow players like Boyd Gordon and Matt Hendricks to slide down the lineup, while adding more offence to the top three lines.
“I think that’s the model that we’re ultimately trying to piece together where we have a fourth line that would have lots of defensive zone starts and be able to play against anybody and then have three lines that are able to have success offensively.”
That right there is the Chicago Model MacTavish is describing. One line headed for a labor camp and 3 scoring lines getting as much of an offensive boost as possible.
The Chicago Model
The Hawks are a dominant hockey team. In the language of regular hockey folks: they’ve won two Stanley Cups in the past five years (09-10 and 12-13), picking up two division and conference championships and a President’s Trophy along the way. Over the past five years, the Hawks have never finished lower than 5th in Fenwick For Close % (2nd 4 times, 5th once). They haven’t been lucky. They’ve been dominant in possession, which matters and correlates strongly with winning.
Ok, so they’re successful. But, what’s the Chicago Model? Glad you asked. Here it is:
Every picture tells a story, don’t it?
What you are looking at here is a player usage chart (courtesy of the fine folks at extraskater.com). A usage chart like this gives us visual learners a whole whack of information about a hockey team in one interesting burst. In brief, it tells us about the possession stats of each player by color (blue = good; red = bad); how much time on ice each player plays by size of bubble; about a player’s zone starts by the horizontal axis (on the left = defensive; on the right = offensive); and about the quality of competition a player faces by the vertical axis (bottom = easier; top = harder).
For our purposes here, we are going to focus on forwards, especially centers. The Chicago Model, as you can see from the chart, has the Hawks’ coach Joel Quenneville running one intensely heavy defensive zone start forward line (centered by Marcus Kruger with Brandon Bollig and Ben Smith on the wings) and everyone else, and I mean everyone else, being given a big push up the river.
Zone starts are simply the record of where a coach deploys a player on the ice at the start of his shift. In the aggregate, it is an indication of how a coach understands and uses his team (i.e., are you capable of handling tough zone assignments? if I put you in the defensive zone, am I sacrificing offence for the sake of defence? If in the offensive zone, am I optimizing your talents?).
The reason we talk about the Chicago model is not only because Chicago wins (though that is certainly part of it, success always breeds dissection), but because it is so tactically radical (and let’s face it visually too, at least with the aid of a usage chart like the one above). Most NHL teams deploy their forwards in a more evenly distributed manner. That is, they will typically split the zone start duties among the 4 forward lines more evenly.
If we take a look at the forward deployment for the top 4 possession teams last year, we can see how novel Chicago’s model is
LA Kings; Chicago Blackhawks
San Jose Sharks; Boston Bruins
I’ll let the pictures do most of the talking here. One can plainly see that most teams, even the best possession teams, distribute their zone starts more evenly among their forwards than the Blackhawks do. But, I’ll ask you to note the hashmarks on the horizontal axis. The Kruger line has c. 20% zone start percentage (that is, only 20% of their zone starts are in the offensive zone), whereas all the other Blackhawk forwards are up in the 60-65% range. This kind of gap is truly radical.
Let’s look at it another way. Here’s every forward that played 62 NHL games last year on one chart:
The extreme nature of the Chicago Model really shines through here. The major players are all at one extreme or the other. On the far left, you can see Kruger and his linemates (Bollig and Smith). On the far right, if you follow the arrows I’ve added from bottom to top, are Andrew Shaw, Kris Versteeg, Brandon Saad, Patrick Kane, Patrick Sharp, Marian Hossa and Jonathan Toews. What’s amazing is that, for the most part, we don’t need visual aids. The usage of these players makes them such outliers that we can make them out.
Roster Construction; Or, How Does it Work
The lynch pin of the Chicago model is the availability of one hell of a defensive center. In this case, Marcus Kruger. Marcus Kruger is, simply put, some kind of witch.
Kruger is easily the most valuable 4th liner in the NHL. At the tender age of 24, he’s been tasked with the 4th most severe zone starts in the league. From a paltry c. 20% zone start, Kruger nearly manages to get his team back to even (c. 45% zone finish). His possession numbers (51.4 CorsiFor%), suggest that the puck, despite the ugly zone start is going the right way with him on the ice.
And, the coup de grâce… Kruger manages all this while being stuck in the Gazdic Cage, carting around Brandon Bollig (c. 638 of Kruger’s c. 875 5×5 TOI was spent with Bollig).
We know Kruger must be a witch because prior to this year, Bollig has no real history of being a good hockey player. His role has typically been that of a short minute face-puncher. Over his pro career (AHL and NHL), Bollig has amassed just 38 points in 271 games (0.14 PPG) and 643 PIMS. During his time in the NHL, Bollig has relied on the hospitality of others to stay afloat. His limited time in the NHL for the 2011-13 seasons––c. 300 5×5 minutes––is marked by the efforts of Michael Frolik and Kruger to keep him legible.
This small WOWY chart shows the impact the players had on one another’s CorsiFor % (11-13):
This year, Bollig looks like an improved player. He played all 82 games, playing c. 10 minutes of 5×5 TOI/60. He managed to score a bit (7-7-14, 0.17 PPG; all his NHL points are from this season) and he had positive possession numbers. While it is possible that a career face puncher took a big leap from bad to good hockey player at the age of 27… that seems incredibly unlikely.
Indeed, what makes a lot more sense is that Kruger, already a very good hockey player, got better at age 24 and helped Bollig look good enough to whet Brian Burke’s appetite for meatpuck. Looking at the WOWY numbers for the 13-14 season, it’s clear Kruger was in charge of things (even if the difference isn’t as stark as the 11-13 years).
Kruger is lucky to have Ben Smith with him. He’s not nearly the disaster Bollig is. Even so, it’s clear that Kruger is driving the bus on his line.
Positional Responsibility/ Optimizing Others/Quality of Competition
The importance of Kruger isn’t just the player and his individual talents. The Chicago Model, to a very large degree, relies on a structural philosophy regarding the usage of centers. A single center is tasked with taking an extremely high number of the defensive zone faceoffs and then pushing the puck up the ice so that his teammates can enjoy offensive zone starts. This center has to be able to win faceoffs and manage the puck up and out of his own zone. Kruger is the ideal center for this role:
1. Kruger took an ghastly c. 20% zone start
2. Kruger took the second most faceoffs after Toews, winning an impressive 56.7%
3. Kruger has an impressive c. 45% zone finish
4. Kruger’s 51.4% CorsiFor percentage suggests the puck is going the right way
What the Kruger role isn’t tasked with, however, is ghastly quality of competition. While is it hardly easy street (Kruger had the 5th hardest QC of the Blackhawk forwards >62 games played) the more severe competition is saved for Toews.
Here, we can see the trade off Quenneville is employing (to the degree he has control over it).
1. Toews &. Co. get the cherry zone starts but have to play the league’s best players
2. Kruger &. Co. get the ugly zone starts but get some relief by only facing the league’s 2nd tier players
By using a single center almost exclusively in the defensive zone, Quenneville frees up the rest of his roster to start in a much more advantageous position. The idea being, if you have one line that can reliably do all the dirty work, you can ice three scoring lines and find them clean ice to work with.
To make it clear, this deployment strategy is a complete rejection of the traditional hockey mantra of “grind” and “energy” lines in your bottom six. The entire point of shifting the burden (all of it, really) of “shutting down the opposition in your own end” onto one line is to free up the rest of your team for offence.
[Continue to the next page to read about Chicago’s past usage; other versions of the Chicago Model; and, the Oilers’ hopes for following Chicago]Add The Sports Daily to your Google News Feed!
