
In looking for their next analytic edge, the Pittsburgh Pirates shouldn’t be afraid of looking towards old school baseball for inspiration.
A statistic that has largely fallen out of favor with the baseball’s analytic crowd is batting average. The stat itself has a rather odd construction, using the seemingly arbitrarily defined “At-Bat” as the denominator, not counting production from walks, and treating all hits as the exact same value, has left many to put one of baseball’s original statistics in the analytic trash heap.
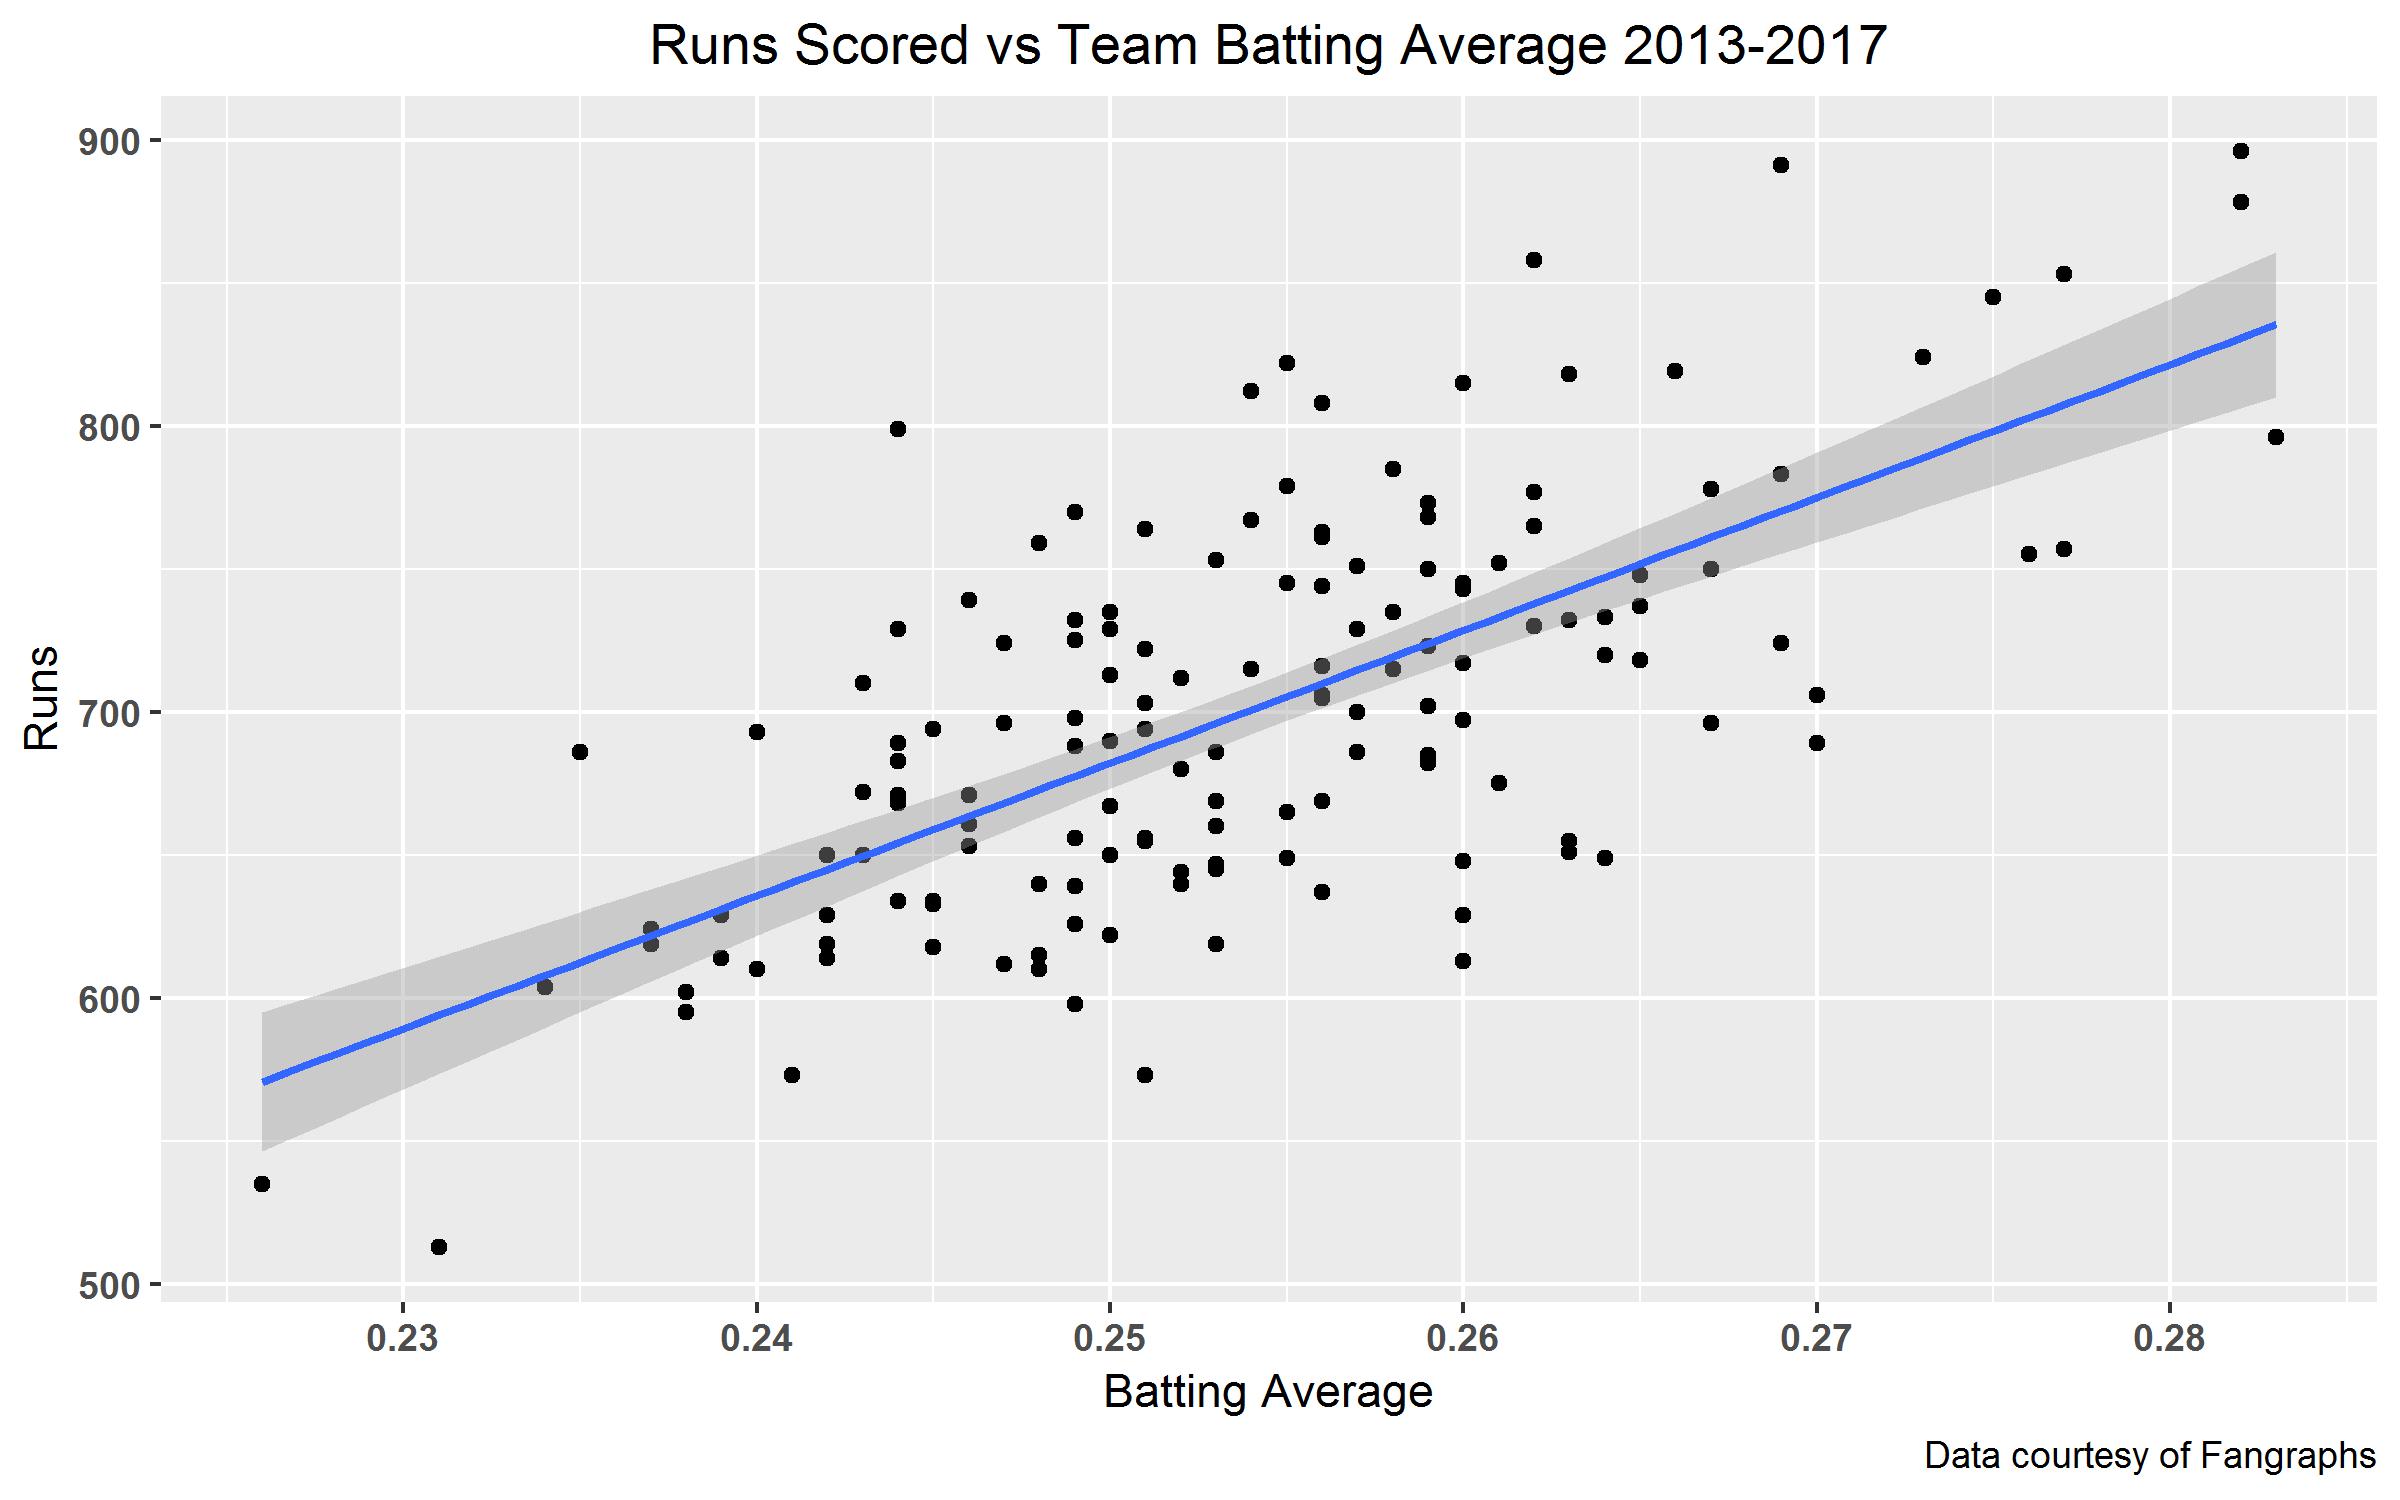
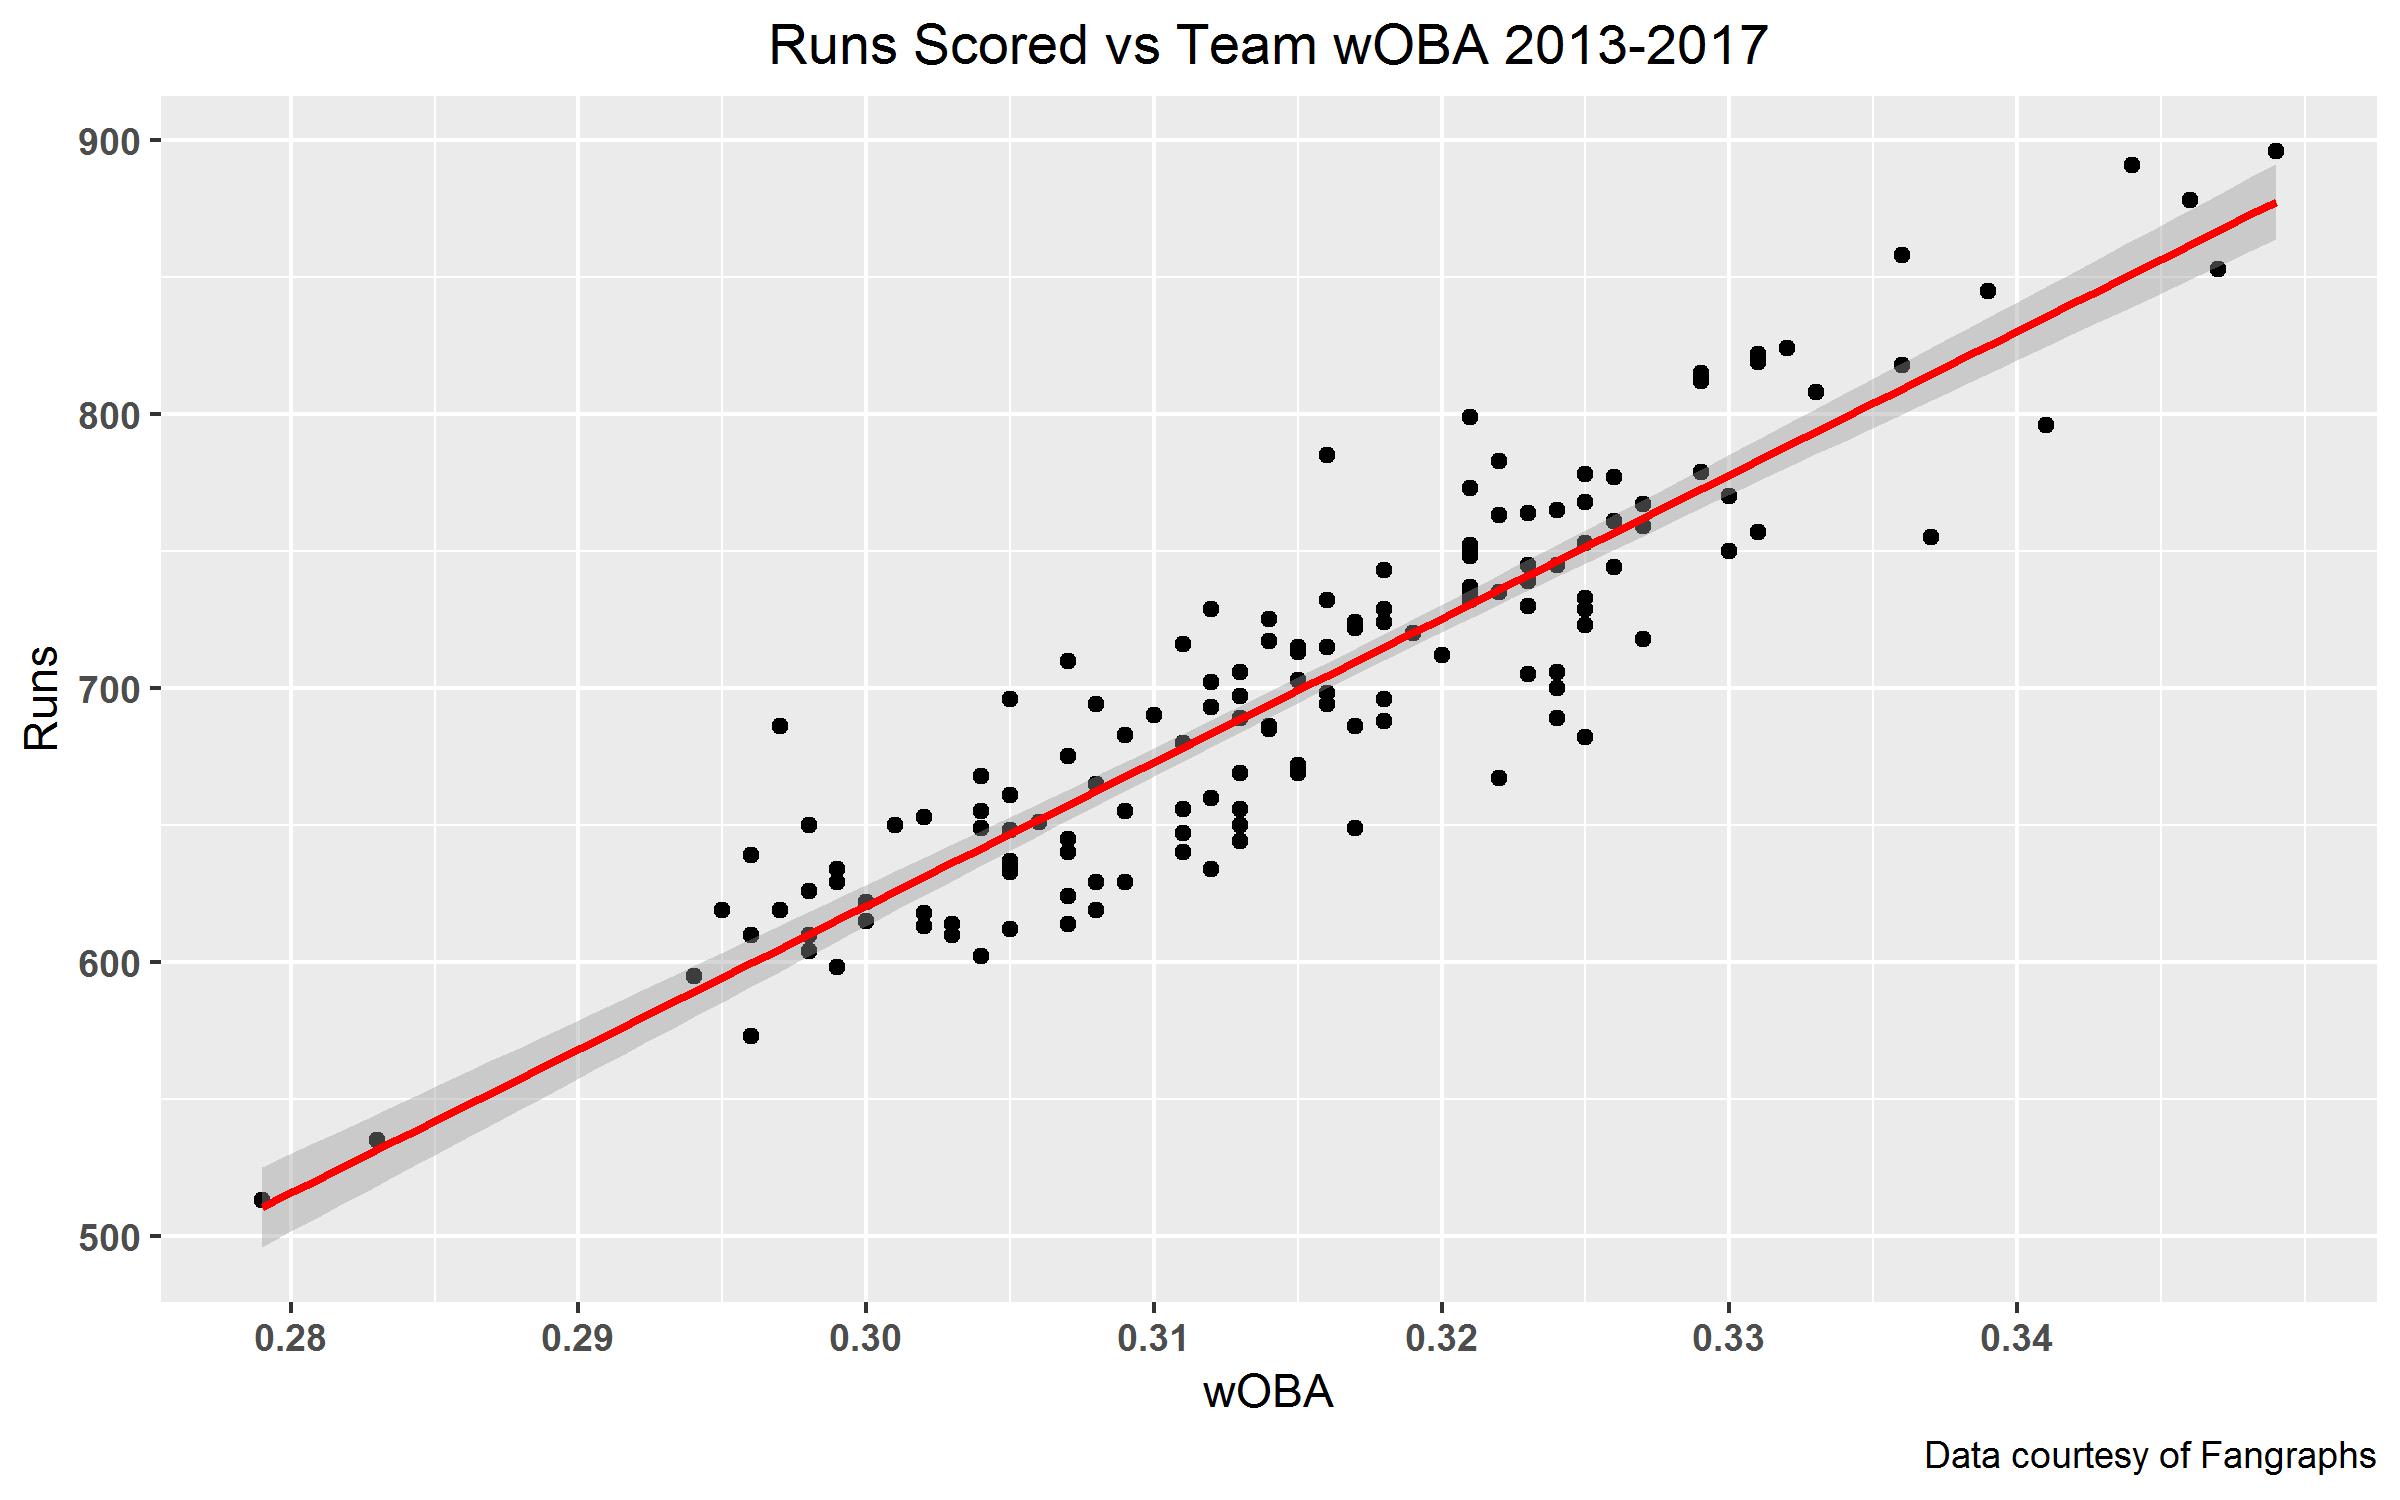
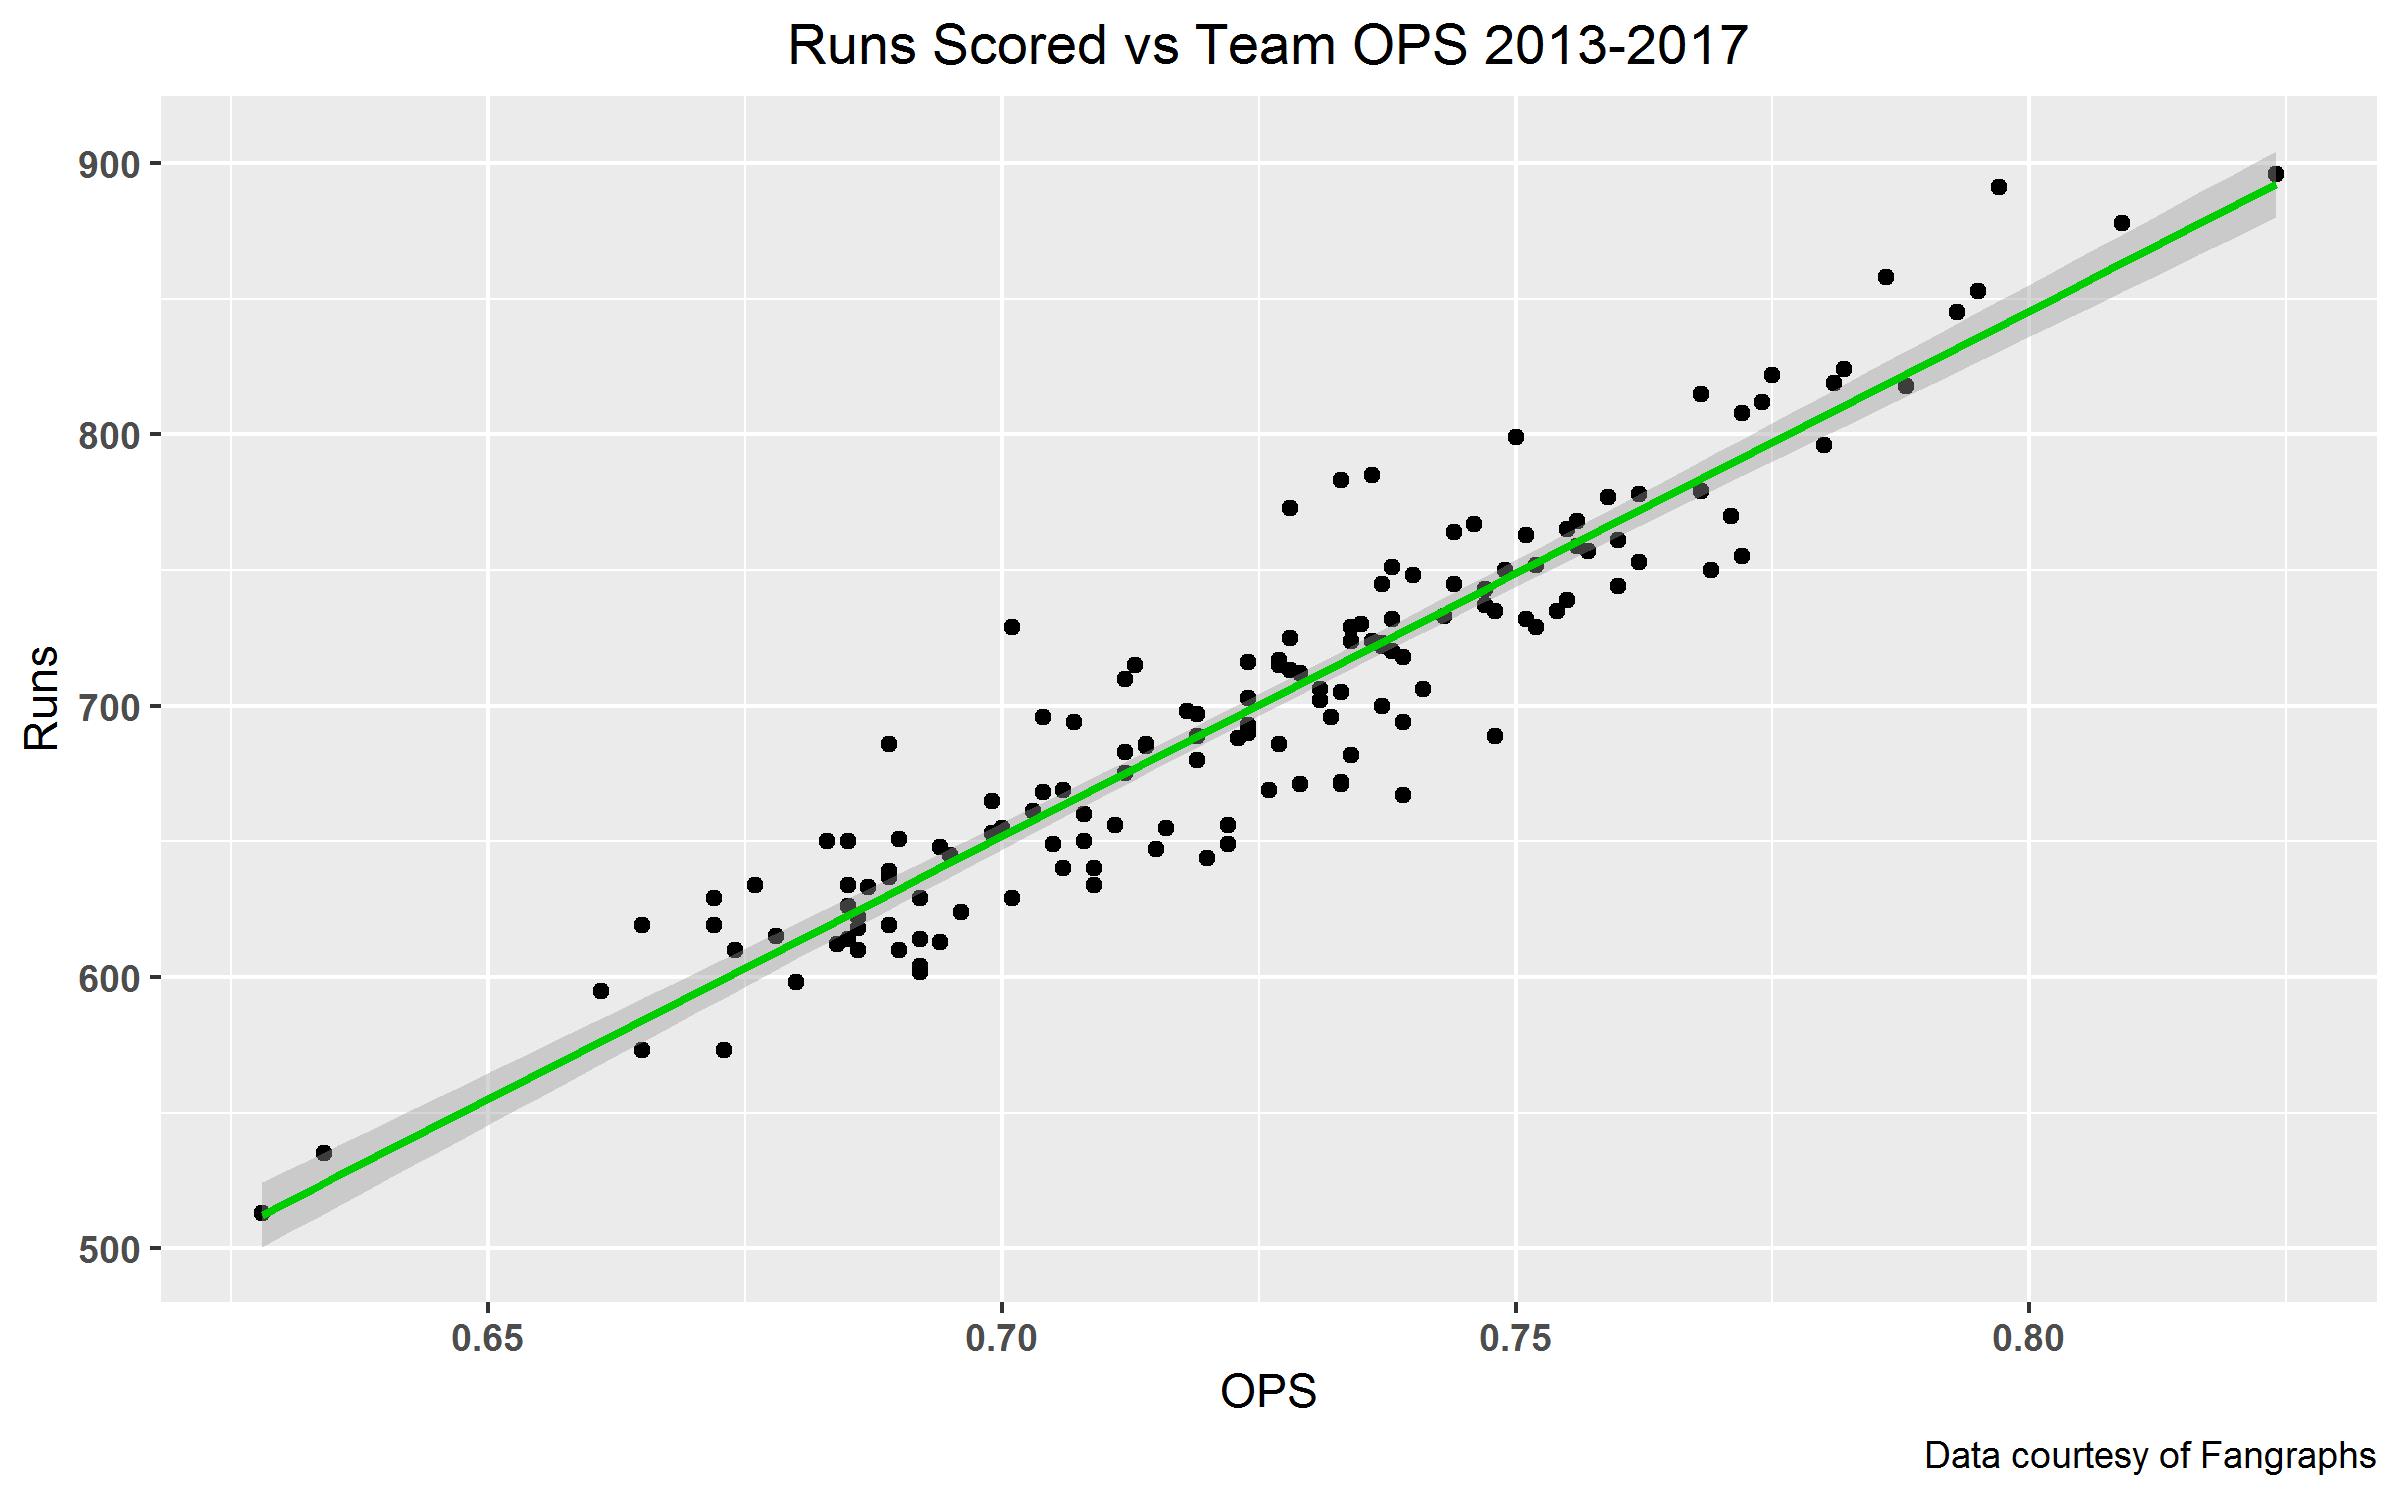
Beyond its mere odd construction, there is also a factor that Batting Average isn’t nearly as descriptive of overall offensive output. Take for example these three graphs of offensive output (Runs) as a function of Batting Average, wOBA, and OPS, respectively:
Average isn’t Great
Visually, the data points for Batting Average are spread out a lot more than with either wOBA or OPS. Similarly, the grey band around each line is the 95% confidence interval; there is substantially more grey area (i.e. less confidence) around the Batting Average line compared to either the wOBA or OPS lines.
Mathematically, the closeness of this relationship between two variables is called the squared correlation coefficient or the R2 for short. Essentially the R2 tells us how closely two variables move together. It’s expressed as a decimal from 0 to 1, the closer to 1, the more descriptive the stat. Statisticians typically report something known as the Adjusted R2 which takes into account whether a variable has any value to the analysis or not; this is what I’ll be referring to as the R2 for the remainder of this article.
In terms that we’re talking about, Batting Average has an R2 of .455, this isn’t an awful descriptor, but stats like wOBA (R2 of .831) and OPS (R2 of .879) are much better descriptors of overall offensive output. That is to say, while batting average alone has value in describing an offense, there are other single metrics that are much more descriptive and thus Batting Average has been put to the wayside.
A More Complete Picture
However, looking on the back of a baseball card, Batting Average isn’t listed as the lone statistic for describing a player; often listed alongside it are the Player’s home runs, RBIs, and walks. RBIs is a genuinely flawed statistic, it awards no value to the player that did the work to get on and around the bases, while awarding full value to the batter who may have just slapped a weak single; additionally it’s highly dependent on the players hitting in front of the batter that records the RBI.
The other two, HRs and BBs, carry obvious value in today’s game; Babe Ruth figured out the value of a home run more than a century ago, with teams seemingly rediscovering it in recent years, and walks generate value because they 1) are not outs and 2) give you base runners. If we take these two factors into account when looking at how Batting Average relates to offense, it fixes a lot of the problems associated with just using Batting Average. Doing this accounts for (at least some) of a team’s power at the plate, as well as their ability to get on base with a walk.
Instead of using Runs as a function of Batting average alone, we can instead evaluate Runs as a function of BA, HR, and BB, to get this fuller offensive picture. The correlation to runs scored of this equation is significantly better than Batting Average with an R2 = .872 (it is worth noting that this is even slightly better than wOBA).
Using this equation and plugging in each team’s particular Average, HRs, and BBs gives us something I’ll rather generically call “Batting Score” graphed out against runs scored below:
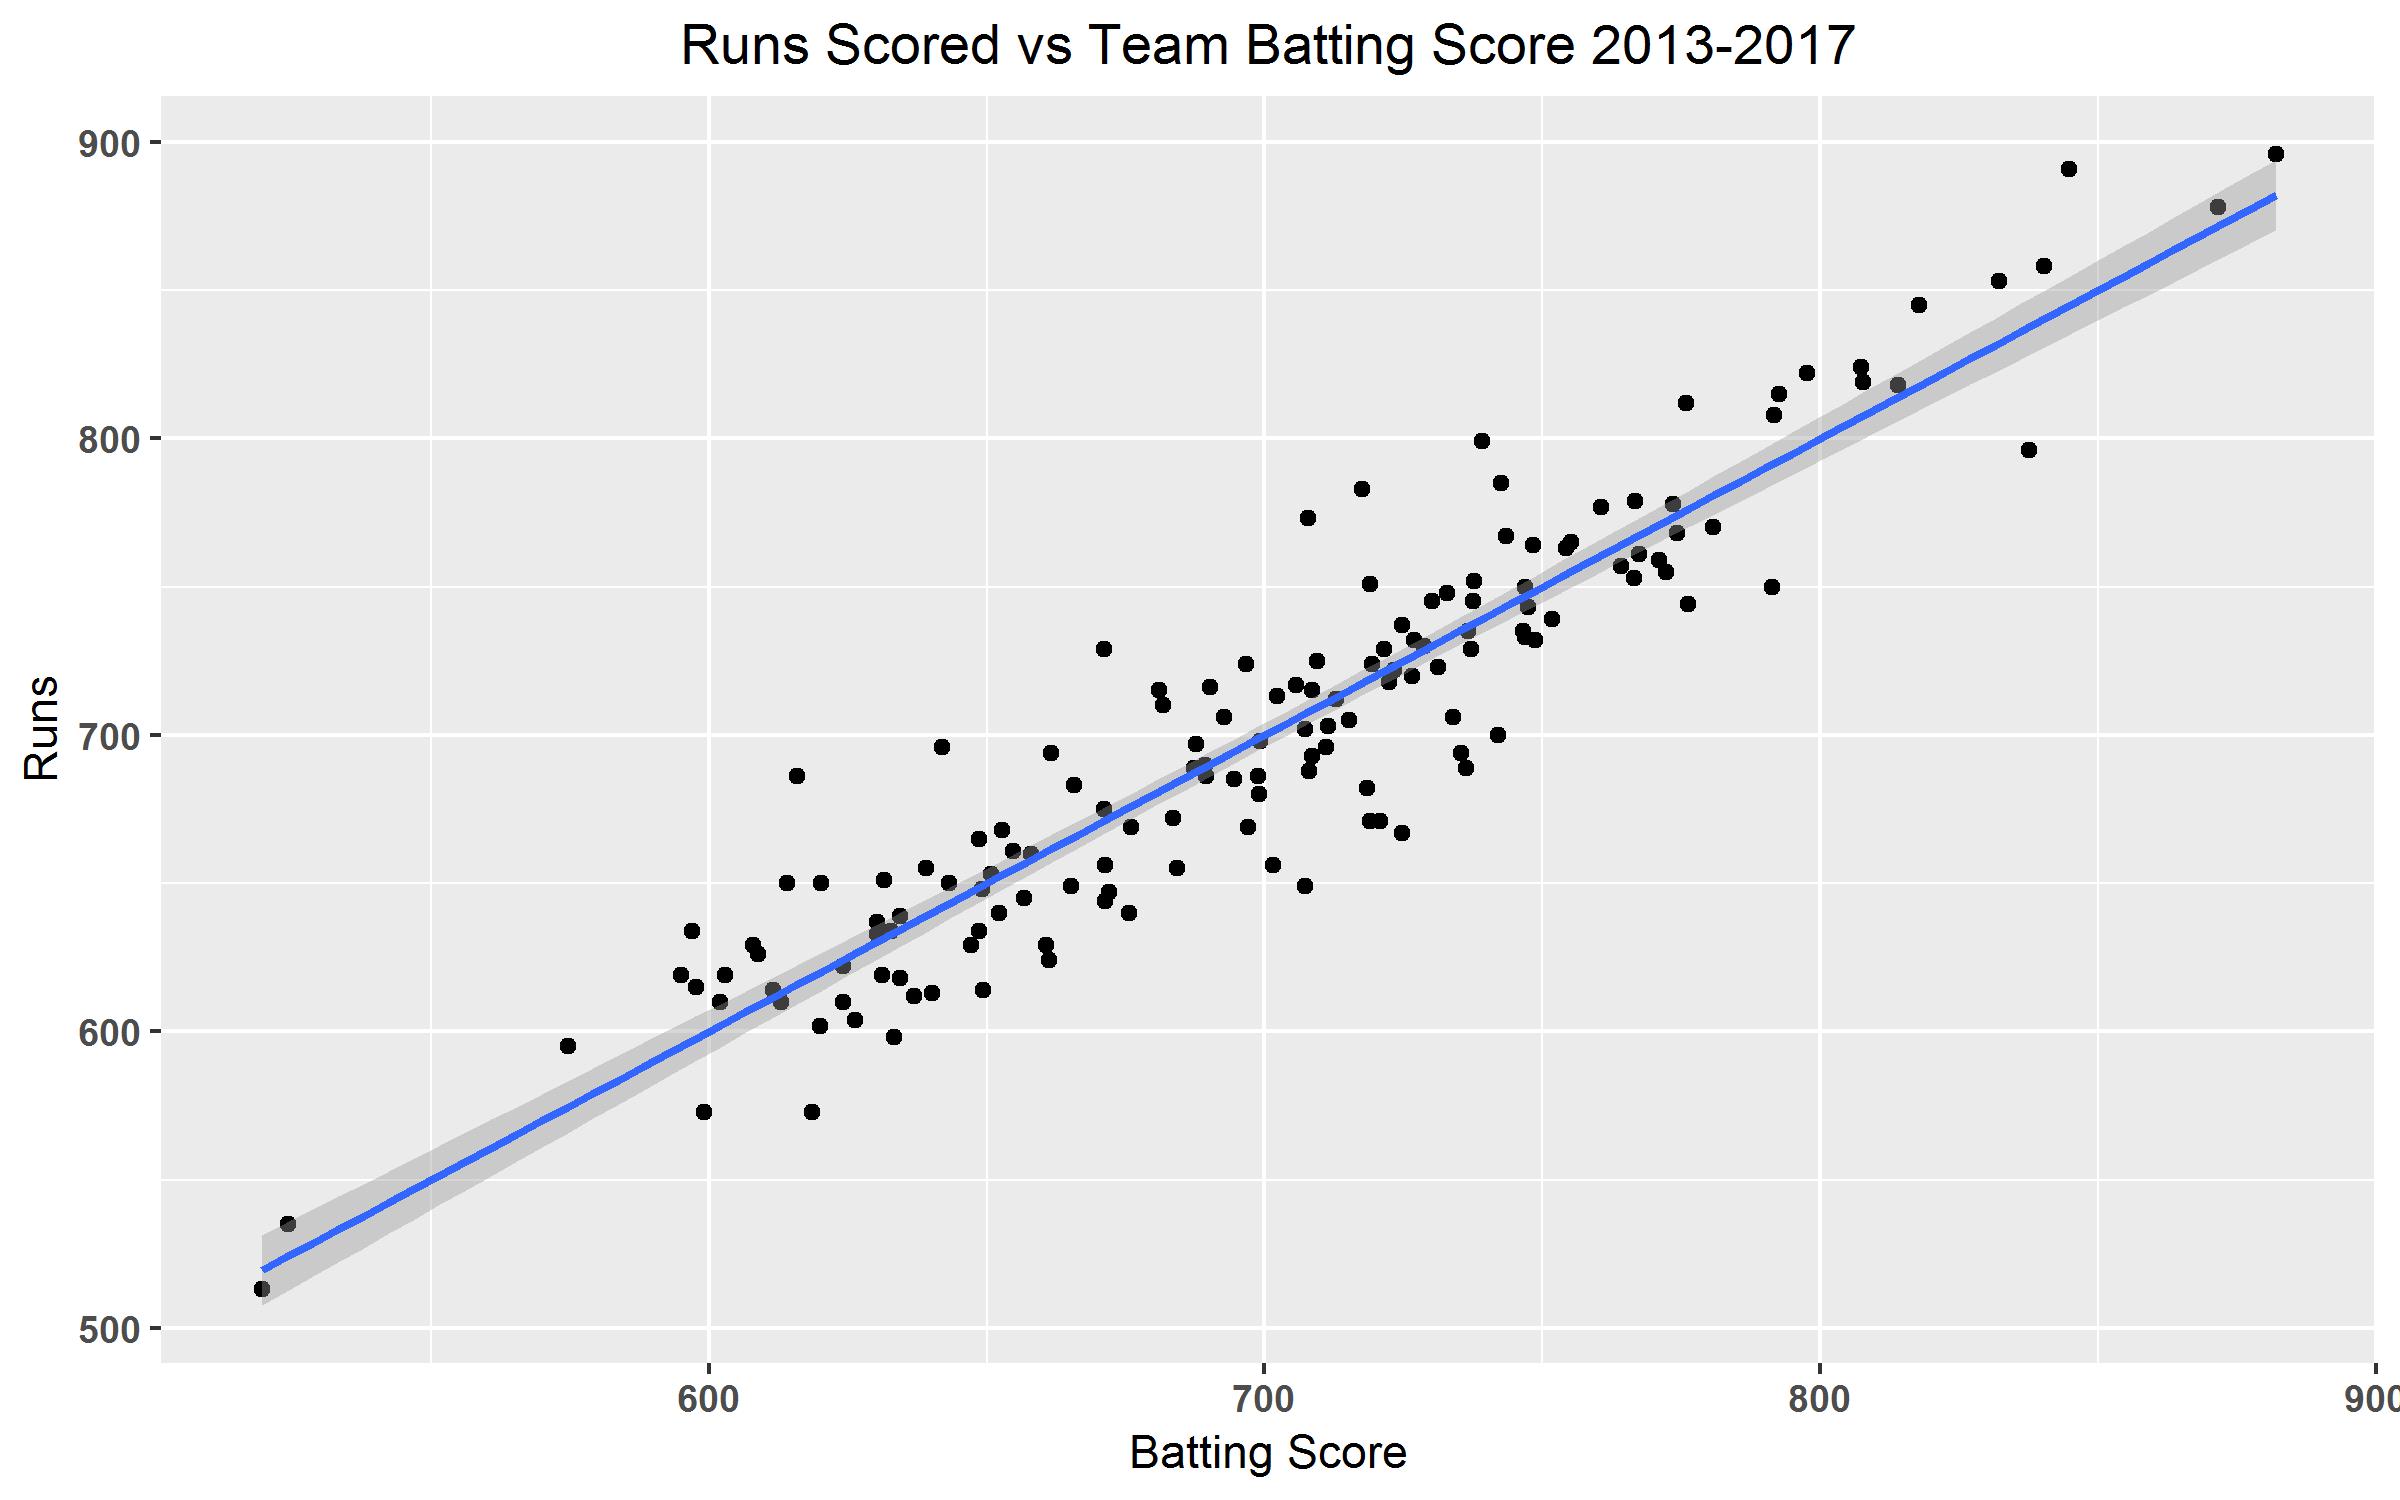
Here you can see how much closer the spread of this data looks to the wOBA and OPS graphs in comparison to the BA graph. Ultimately what this shows is that the traditional line of Batting Average, Home Runs and Walks is still just as useful to evaluating a player’s skill with the bat, when weighted correctly.
The overall point here is that Batting Average is not quite as useless a statistic as most modern baseball analysts argue. Average is descriptive of offense, though shouldn’t be used alone to those ends, and it does describe a particular skill.
Take two hypothetical hitters with identical On-Base Percentages but one hits more singles, giving him a higher batting average, while the other tends to walk more and hit less. If we’re talking in terms of runs generated, the player that hits for average is more valuable to the team; a single can score a run from second while a walk can’t. This is to say that there is a skill that batting average captures that something like OBP misses.
BA’s Importance
Taking this analysis one step further, we can also identify what the relative value of increasing team Batting Average, Home Runs, or Walks are compared to each other. If we take the number of standard deviations from average that a team’s BA, HRs and Walks are, then run the regression of runs as a function of the SD of BA, the SD of HRs and the SD of BBs, we can then compare their respective coefficients, as they’re on the same scale.
The finding is that an increase of 1 standard deviation in Batting Average is 1.3 times more valuable as a standard deviation increase in Home Runs and 1.9 times as valuable as the same increase in Walks (for those curious: increasing HRs by a standard deviation is 1.5x as valuable as increasing walks). These effects work both ways, meaning that decreasing a team’s BA by a standard deviation costs them 1.3 times as many runs as doing the same decrease in home runs and so on.
Similarly, teams that saw an increase of 1 standard deviation in BA, all else constant, saw on average a 42 run increase, compared to a 1 SD increase in HRs scoring just 33 additional runs and for Walks just a 22 run increase. Put in terms of wins that’s roughly a 4 win improvement for increasing Batting Average, a 3 win improvement for Home Runs, and just a 2 win improvement for Walks. This means that a team could, hypothetically, give up a standard deviation of home runs while increasing their batting average by a standard deviation and still have a 1 win improvement.
All in all, improving batting average seems to have a larger overall impact on a team’s offense over improving their power.
Average or Power?
The next step is to get an estimate of whether achieving a standard deviation change year to year is easier for one of these metrics or another. Over the 120 team-seasons that occurred between 2014 and 2017, there were 34 teams, or 28.3 percent, that changed their BA by at least 1 standard deviation or a .010 change in team BA year to year. 35 teams (29.2%) changed their HRs by at least a one standard deviation, and 43 (35.8%) changed their Walks by at least a standard deviation.
Over this time period, changing a team’s batting average and home runs by a standard deviation were roughly equally as difficult, whereas changing their walks was relatively easier.
If we additionally consider that the MLB saw an unprecedented spike in longballs over this time period, due in large part to a change in the baseball, perhaps the ease of increasing home runs is overstated, and increasing Batting Average is in fact relatively easier to change under more typical circumstances.
What this points to is an overvaluation of the long ball in the MLB and an undervaluation of hitting for average. With many teams chasing home run hitters as a means of offensive improvement, they seem to have forgotten a part of the game’s roots.
This trend is evident in the data; baseball has seen its league wide average drop fairly steadily since 2006 while simultaneously seeing a drastic rise in the reliance on home runs as a portion of total offensive output more recently.
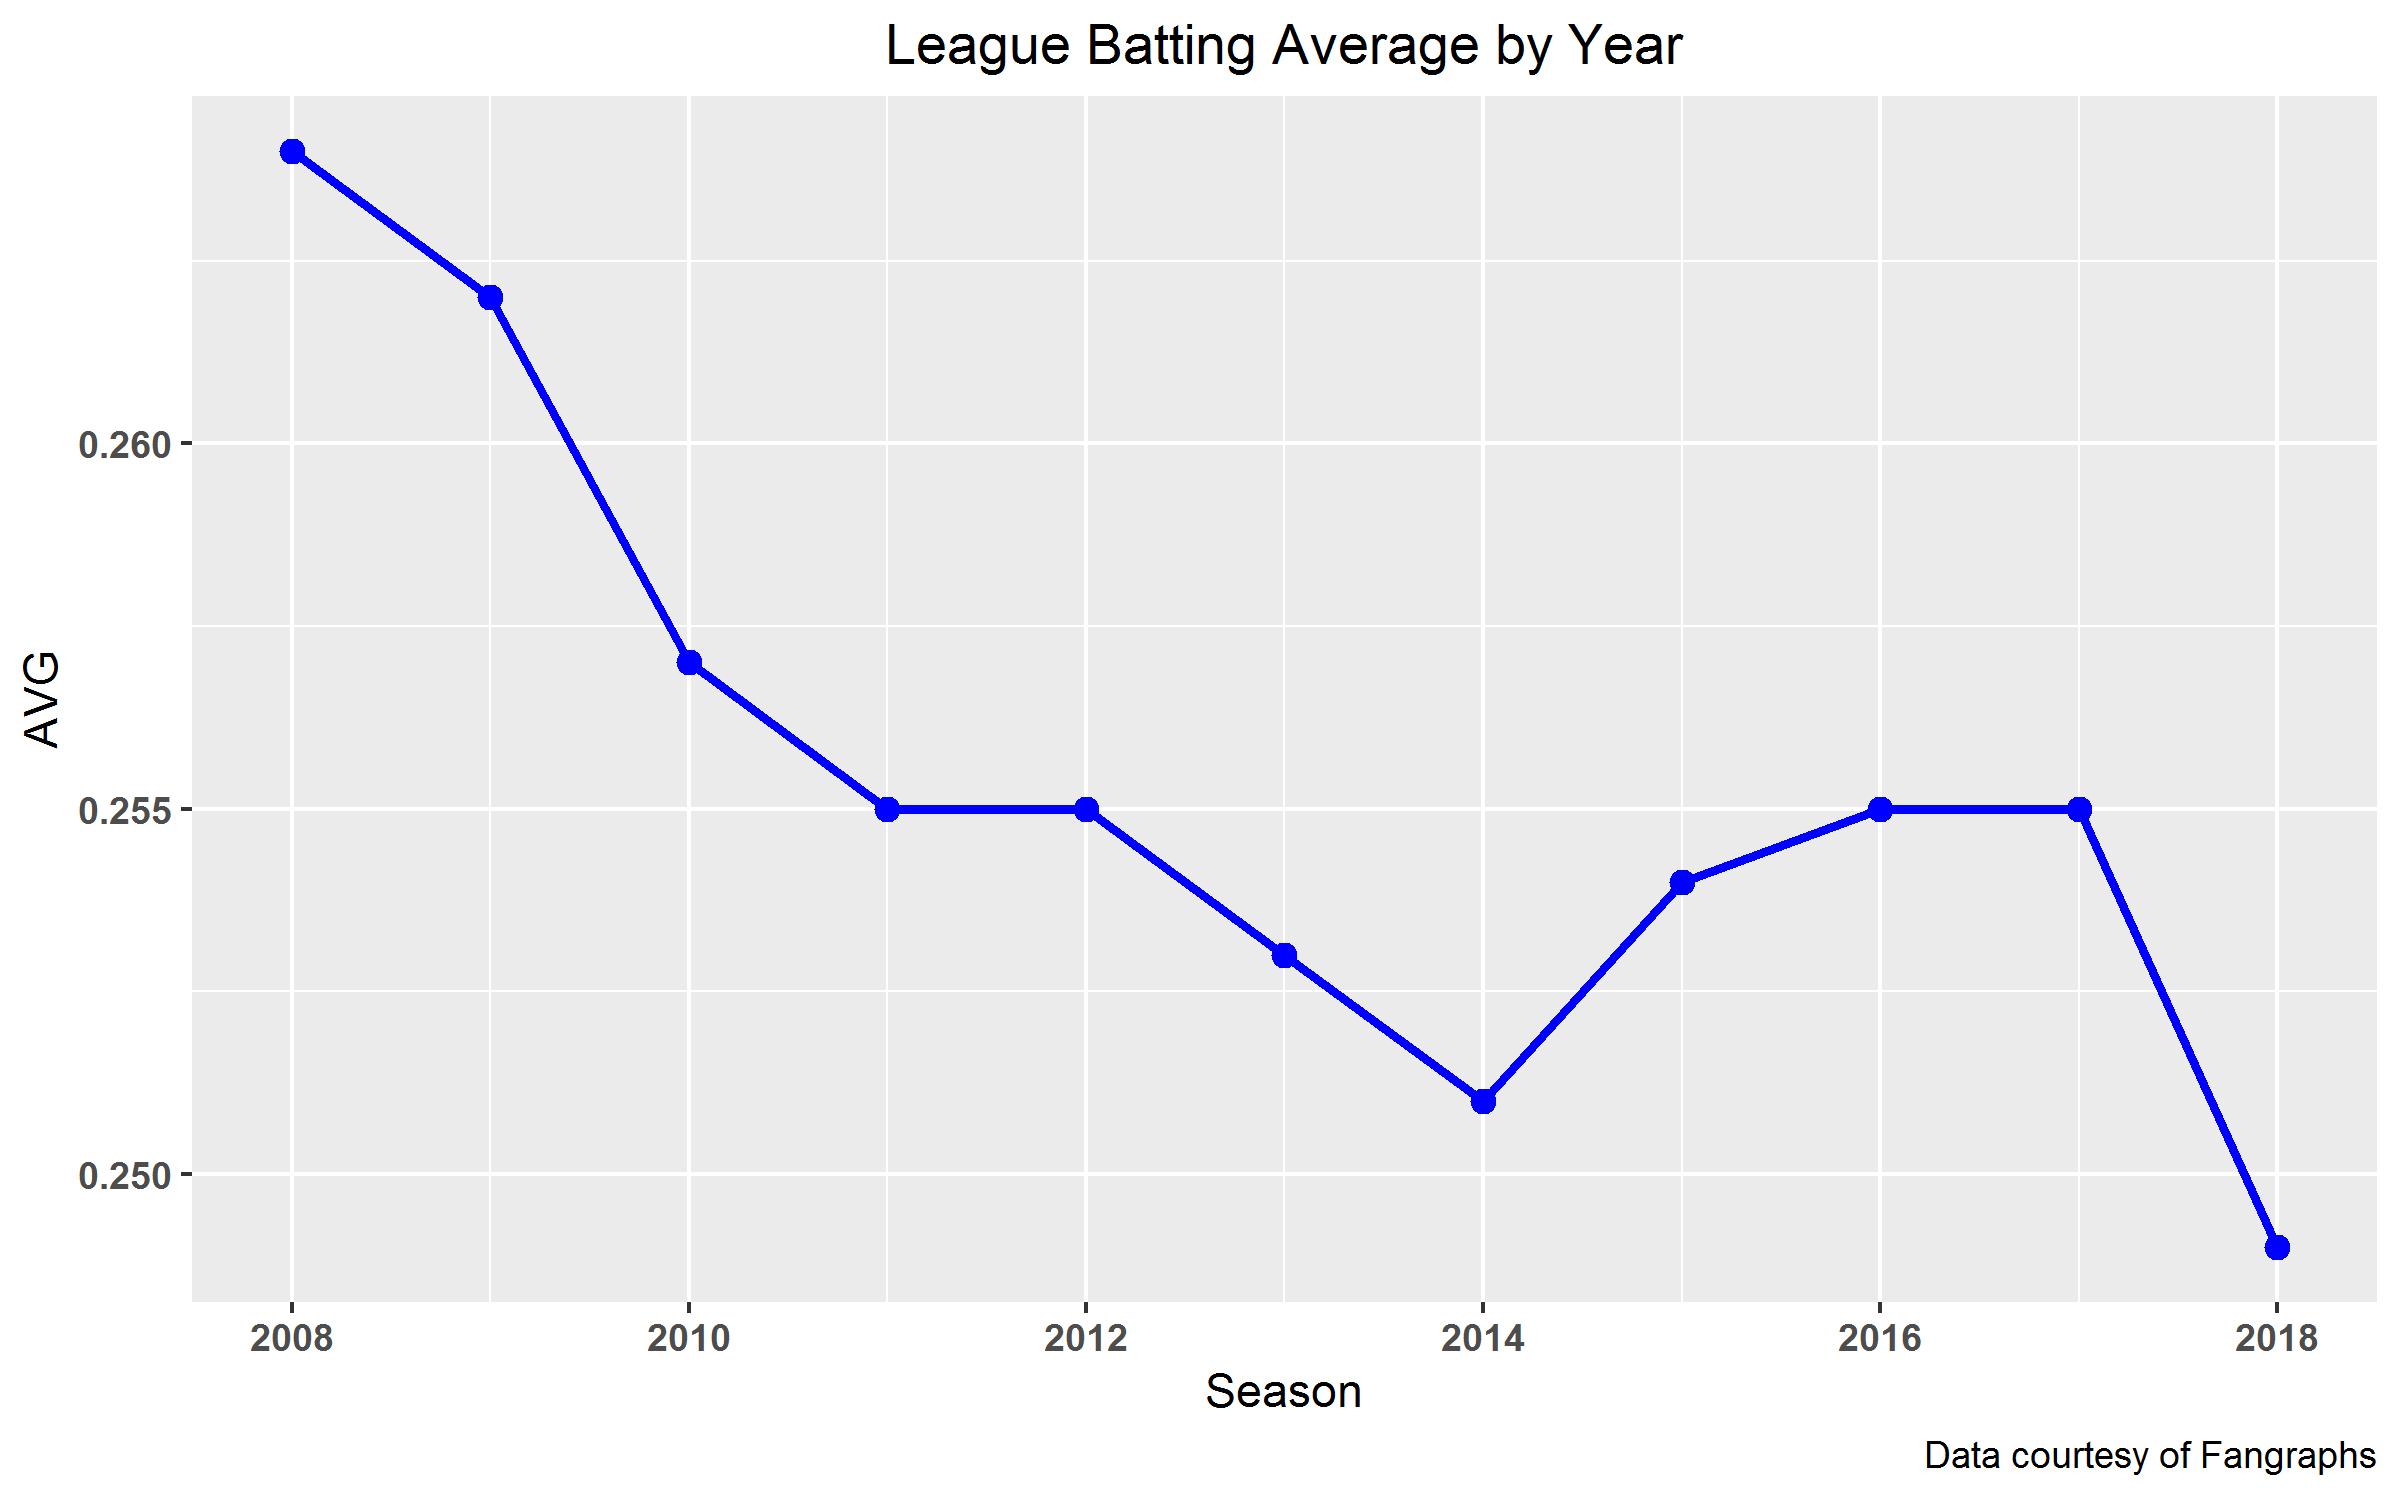
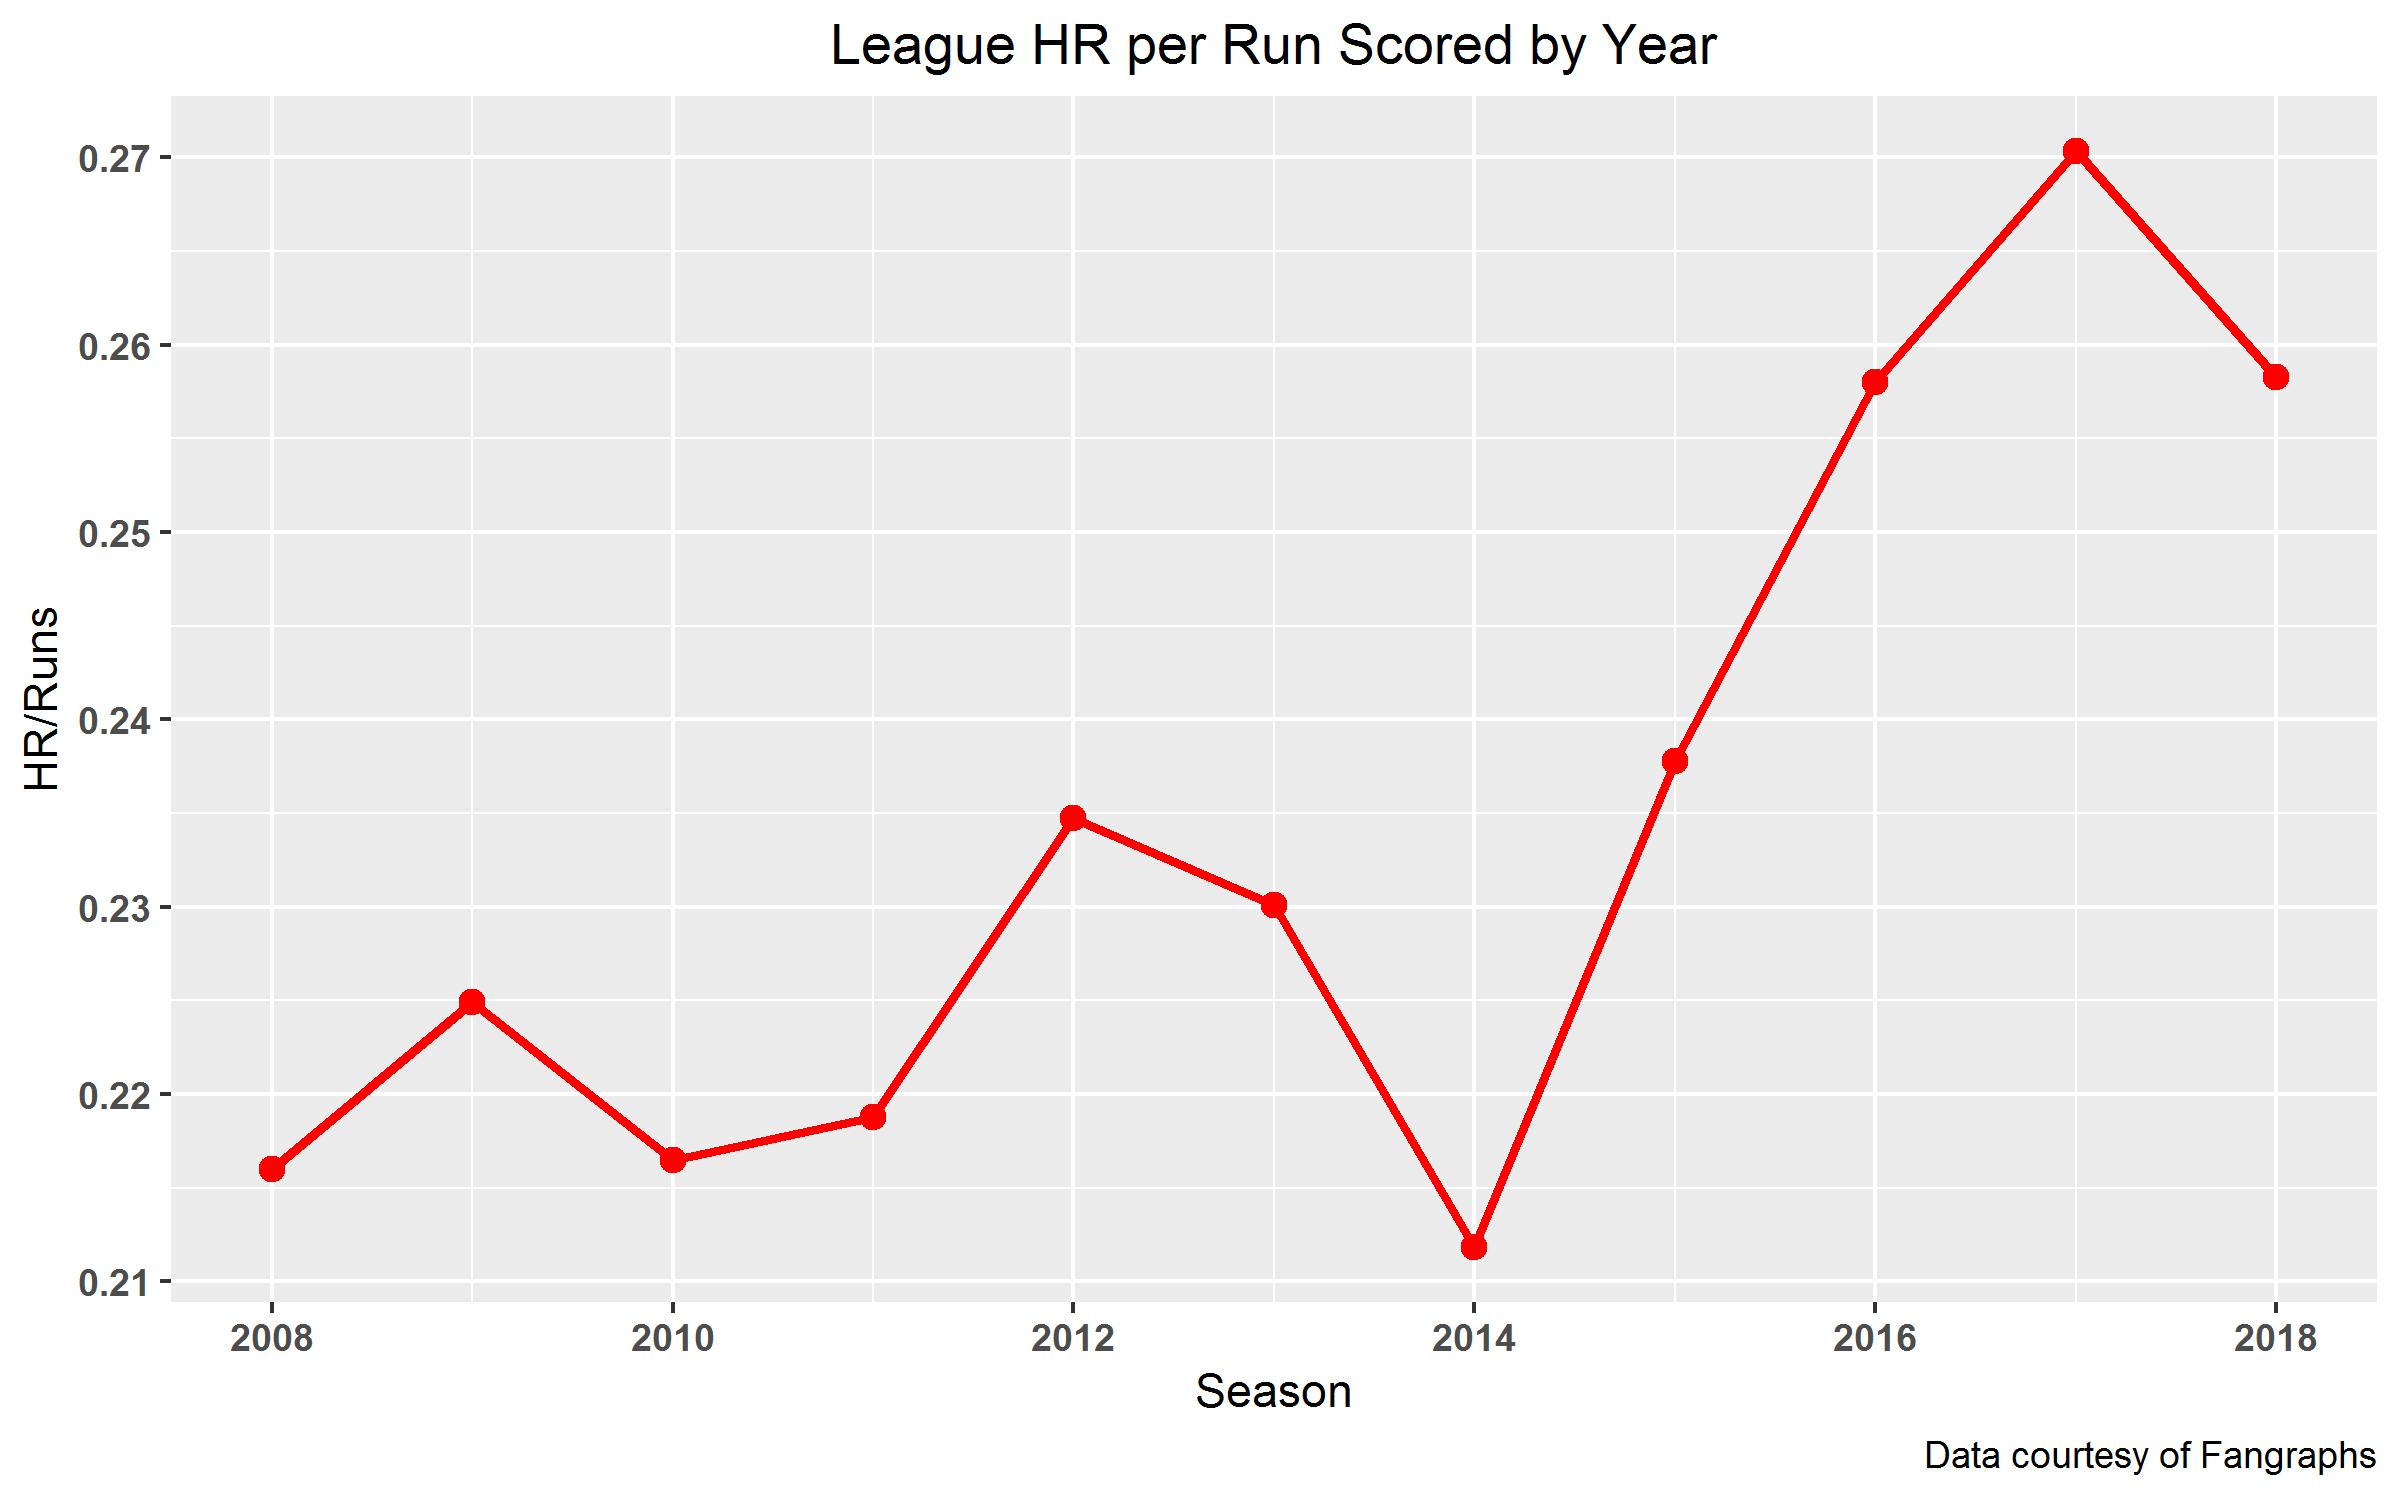
While batting average has dropped to its 45 year low, home runs are just off their all-time high and have accounted for more than a quarter of all runs scored in each of the past 3 seasons. The league has largely left the, hopefully now established, value of batting average for the relatively less valuable increases in home runs.
The Pirates’ Move
This provides an opening for the Pirates to approach high-average players, or find players who would generate more value as Batting Average hitter rather than a raw power hitter, while everyone else undervalues their abilities. Simply put, the pendulum has swung a bit too far to the “sell out for power” side leaving room for improvement on the “smart hitting” side.
The good news is that this does seem to be on the Pirates radar. After a truly rough offensive season in 2017, this season the Pirates batting average is up by nearly a full standard deviation (.008) while also seeing their home run rate improve from 2.46 percent in 2017 to 2.60 percent in 2018. While their walk rate has dipped from 8.5 percent in 2017 to 7.8% this season, given that it has the smallest impact on offense of the three stats, the net effect is still positive for this offense.
Moreover, it seems as though this is a strategy that the Pirates are coaching to players.
The Pirates took a 30 home run threat in Corey Dickerson, turned him into a batter for average and he has become a key part of the Pirates offense. While Dickerson has hit for a .300+ average in the past, it was when he was in the very batter friendly Coors Field. To “average out” this park effect we can simply look at his Batting Average on the road; Dickerson was never better than a .256 hitter while with Colorado and is a career .274 hitter on the road. This season, however, Dickerson has posted a quality .291 road BA suggesting that, at least in part, Dickerson has taken a new approach at the plate and it seems to be working.
Coming from within the Pirates system, Adam Frazier similarly profiles as a player that can hit for high average in an otherwise power dominated league. Frazier’s .288 average this season is largely marred by a .239 start to the season and subsequent sending down to Indianapolis; after fixing his swing and being recalled on July 25th Frazier is batting .352 in 108 At Bats.
In recent years the league has crowded around launch angles and exit velocities to generate as much power as possible. This has left something of a gap in value between what is traditionally thought of as a quality baseball player, and the more recent analytic trend. This gap can and should be exploited by the Pirates to their team’s benefit going into the 2019 campaign.
Add The Sports Daily to your Google News Feed!